Derived from the AMAP model developed in the 1990s at CIRAD , GreenLab's new formulation was introduced at LIAMA (Beijing) in 2000, through the GreenLab Associate Team with INRIA. Today, the model is studied and improved owing to the DigiPlant research team that is a joint team of researchers from INRIA, CIRAD and Ecole Centrale Paris. Some very close partnerships exist with LIAMA, China Agriculture University, Wageningen University, INRA, SupAgroMontpellier and AgroParisTech. The development of the GreenLab model is shared between all these partners, with strong interactions (International exchanges, common publications and joint PhD).
Our approach to develop the mathematical model of plant growth strongly relies on the plant organization described by botanists. This leads to relevant choices in order to obtain an efficient method of factorization based on plant instantiations . Plant development concerns organogenesis, i.e. the appearance of organs. Growth depends on photosynthesis that insures organ expansion. On the common assumption of the existence of a global pool of reserves, it is not necessary to consider local conditions and we can distinguish 3 steps to control plant development and growth.
Computing organogenesis. It provides the number of organs produced by the buds. It may be determined by plant functioning and the level of trophic competition .
Computing biomass production and allocation. Leaf surface area is used to determine photosynthesis and the neat biomass production is shared between the different organs (whose numbers are known by the organogenesis step) according to their sinks to insure their expansion. The yield is thus computed according to the sizes and the weights of the different organs produced.
Building plant architecture for visualization or to study interactions with the environment. This last step involves geometry applied to the results of the two previous steps.
For most applications in agronomy, only the first two steps are necessary, and no geometry is required.
GreenLab combines both organogenesis and functional growth in a mathematical dynamic system. A dual-scal automaton was initially used to describe GreenLab organogenesis. However, it was shown to be equivalent to a growth grammar , and this formalism is used from now on to describe the GreenLab organogenesis model. In this section we recall the basic botanical hypotheses used to construct the model of organogenesis, how it defines a growth cycle that is used to synchronize the computation of both organogenesis and functional growth. The construction of the growth grammar is also recalled, with its fundamental property: its factorization, taking advantage of all instantiations in plant architecture. Based on this growth grammar, the functional equations of biomass acquisition and distribution can be derived.
As explained in , organogenesis results from the functioning of undifferentiated cells constituting the apical meristem and located at the tip of axes. When in active phase, this meristem forms buds that will develop into new growth units composed of one or several metamers (also called phytomers). A metamer is a botanical entity chosen as the elementary scale to model plant architectural development in this study. It is composed of an internode bearing organs: axillary buds, leaves, flowers. Depending on species, metamers are set in place rhythmically or continuously.
In the rhythmic case, see Figure , the plant grows by successive shoots of several metamers produced by buds. The appearance of these shoots defines the architectural Growth Cycle. A Growth Unitis the set of metamers built by a bud during a growth cycle. These metamers can be of different kinds and ordered according to botanical rules, like acrotony. For example, most temperate trees grow rhythmically, new shoots appearing at spring. For such plants, and if we do not consider polycyclism and neoformation, the architectural growth cycle corresponds to one year.
Plant growth is said continuous when meristems keep on functioning and generate metamers one by one, see Figure . The number of metamers on a given axis (that is to say generated by the same meristem) is generally proportional to the sum of daily temperatures received by the plant, see . The growth cycle is defined as the thermal time unit necessary for a meristem to build a new metamer, it can be quite short, corresponding to a couple of days. The growth unit is thus simply composed of one metamer. The growth of tropical trees, bushes or agronomic plants is often continuous.
So far, Digiplante does not consider time scales that are smaller than the architectural growth cycle and we study the development of new growth units as a discrete process. The Chronological Age(CA) of a plant (or of an organ) is defined as the number of growth cycles it has existed for.
Since metamers may bear axillary buds, plant
architecture develops into a hierarchical branching system.
underlined that architectural
units can be grouped into categories characterized by a
particular combination of morphological parameters. Thus,
the concept of
Physiological Age(PA) was introduced to represent
the different types of growth units and axes. For instance,
on coffee trees, there are two types: orthotropic trunk and
plagiotropic branches. The main trunk's physiological age
is equal to 1 and the oldest physiological age denoted by
Pcorresponds to the ultimate state of differentiation
for an axis, it is usually short, without branches. We need
less than 5 physiological ages to describe the axis
typology of most trees. The apical meristem or bud of an
axis is thus characterized by the physiological age of the
growth unit that it may produce and a metamer is
characterized by its physiological age
i(which is the physiological age of the growth unit
that it belongs to) and that of the buds that it bears
j. Except in some very rare cases, we always have:
i![]()
j. Moreover, along an axis, the morphological
features of the growth unit may evolve with the age of the
apical meristem. This process is described as the meristem
sequence of differentiation by
, and corresponds to a
transition to a superior physiological age of the
meristem.
This section summarize results presented in
,
,
. In GreenLab, the alphabet
![]() is given by the set of metamers
is given by the set of metamers
![]() and buds
and buds
![]() . A metamer is defined with four indices and is
denoted by
. A metamer is defined with four indices and is
denoted by
mpqt(
n):
its chronological age:
n,
its physiological age:
p,
the physiological age of its
axillary buds:
q,
(
q
![]()
p),
the chronological age of the plant:
t.
A bud is defined by three indices and is denoted by
bpt(
n):
its physiological age:
p,
the number of growth cycles
kfor which bud's physiological age has been p -
in the sequel, we will call it
ontogenic ageof a bud,
the chronological age of the plant:
t.
If
Tis the maximum growth time, the organogenesis
alphabet is given by:
![]() , with
, with
![]()
We do not consider symbols for organs since the constitution of a metamer is supposed fixed by botanical rules (an internode and a given number of leaves and fruits). If, for example, flowering is particularly studied, symbols denoting flowers could be introduced in the alphabet.
Definition 1 (Set of words over an alphabet)The set
of words over an alphabet
![]() is defined as the monoid generated for the
concatenation operator ".", seen as an internal,
non-commutative operation, by
is defined as the monoid generated for the
concatenation operator ".", seen as an internal,
non-commutative operation, by
![]() , where
1is the neutral element for the
concatenation operator (which corresponds to the empty
word). It is denoted
, where
1is the neutral element for the
concatenation operator (which corresponds to the empty
word). It is denoted
![]() .
.
![]() will thus represent all the possible topological
structures composed with buds and metamers. For example,
will thus represent all the possible topological
structures composed with buds and metamers. For example,
![]() represents at growth cycle
represents at growth cycle
ta structure composed of an internode of
physiological age 1, bearing a lateral bud of physiological
age 2 and an apical bud of physiological age 1. We will see
that of course the structures of interest, that is to say
botanically relevant, form a small subset of
![]() (corresponding to a language over
(corresponding to a language over
![]() ). It is important to consider concatenation as
non-commutative when studying plant topology.
). It is important to consider concatenation as
non-commutative when studying plant topology.
As recalled in section , GreenLab organogenesis can be seen as the combination of two phenomena, branching and meristem differentiation. It can be easily modelled with the grammar formalism and we propose to define it as a F0L-system as follows:
Definition 2 (GreenLab Organogenesis)GreenLab
organogenesis is defined as a F0L-system
![]() with the following production rules
with the following production rules
Pr:
For all
![]() :
:
and for all
(
t,
n,
p,
q)
![]() [1;
[1;
T]×[1;
t]×[1;
P]×[
p;
P]:
![]()
with:
upq(
t): number of phytomers
mpqin a growth unit of PA
p, appearing at growth cycle
t
vpq(
t): number of active axillary
buds of PA
qin a growth unit of PA
p, appearing at growth cycle
t
![]() (
(
p): number of GC after which
a bud of PA
pchanges to PA
![]() (
(
p). Vectors
![]() and
and
![]() characterize meristem differentiation.
characterize meristem differentiation.
A fundamental result was surprisingly never used in the context of models of plant development: it is the ability to factorize the L-system productions. It showed particularly adapted to the concept of physiological age, cf. , . We are thus able to factorize plant structure into smaller parts that may repeat themselves a large number of times.
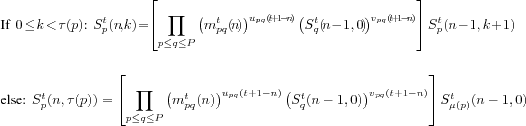
Definition 3 (Substructure)At growth cycle
t![]() 0, a substructure of physiological
age
0, a substructure of physiological
age
p, 1
![]()
p![]()
Pand chronological age
n, 0
![]()
n![]()
tis a word in
![]() defined as the complete plant structure that is
generated after
defined as the complete plant structure that is
generated after
ncycles by a bud of physiological age
p. It is also characterized by the ontogenic age
kof the bud generating it. It is denoted by
Spt(
n,
k)(corresponding to the structure
generated by
bpt-
n(
k)after
ngrowth cycles).
We show how the structural factorization allows the inductive computation of all the substructures, providing an efficient algorithm to simulate plant organogenesis. We deduce the following important result.
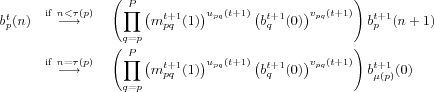
Theorem 1 (Dynamic Equation of Plant Development)For
all
t![]() 1,
1,
![]() ,
,
![]() ,
,
![]() ,
,
![]() , we have:
, we have:
This decomposition is illustrated on
S1(2)in Figure
. If we suppose that all the
elements of the alphabet (set of metamers
mpqt(
n), set of buds
bpt(
n)) as well as the sequences
![]() and
and
![]() are known, Theorem 1 shows us how to build the
topological structure of the plant at any growth cycle
are known, Theorem 1 shows us how to build the
topological structure of the plant at any growth cycle
trecursively, as follows:
![]() Substructures of chronological age 0 are buds:
Substructures of chronological age 0 are buds:
![]() ,
,
![]() and if all the substructures of chronological age
and if all the substructures of chronological age
n-1are built, we deduce the
substructures of chronological age
nfrom Equation
as functions of
mpqt(
n),
upq(
t-
n+ 1)and
vpq(
t-
n+ 1).
Substructures and metamers will be repeated a lot of times in the tree architecture, but they need to be computed only once for each kind.
If we only consider topology, we do not need to
characterize the metamers by their chronological ages nor
by the plant age.
mpqt(
n)can thus be simply be denoted
by
mpq. But if we consider the functional growth of a
plant, metamers of different chronological ages have
different masses and sizes, as well as metamers of the same
chronological age, but at different plant ages.
introduced how the dynamic development equation can be extended to build plant geometry with geometric operators replacing the concatenation operator. We will not detail this point here since our objective is to study plant functional growth which only relies on topology and not geometry in GreenLab.
Plant toplogy can simply be seen as a function of:
the sequences
![]() and
and
![]() for all
(
for all
(
p,
q)such that
1
![]()
p
![]()
q
![]()
P(they will be called
development sequences),
the vectors
![]() ,
,
![]() in case of meristem differentation.
in case of meristem differentation.
The GreenLab organogenesis model has been derived in 3 forms:
GL1 corresponds to the deterministic
organogenesis model, without influence of the plant
functioning. Mathematically, it corresponds to
upqand
vpqconstant, see
. In
such case,
Spt(
n)are (topologically)
independent of
t, and the construction does not have to be done
at each growth cycle but only once.
GL2 corresponds to a stochastic
model of organogenesis,
upqand
vpqare stochastic variables. As a consequence,
substructures of the same chronological and
physiological ages can be very different:
Spt(
n)is a stochastic variable
with values in
![]() . More details are given in section
and in
.
. More details are given in section
and in
.
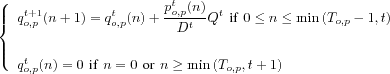
GL3 corresponds to a deterministic
model with total retroaction between organogenesis and
photosynthesis.
upq(
t)and
vpq(
t)are functions of the
biomass produced by the plant at growth cycle
t-1and
trespectively, see
.
Utwill denote the vector
![]() and
and
![]() the associated sequence of vectors. Likewise,
the associated sequence of vectors. Likewise,
Vtwill denote the vector
![]() and
and
![]() the associated vector of sequences.
the associated vector of sequences.
Literature is already abundant on the functional concepts underlying the GreeLab model and its various versions ( , , , , ). The fundamental principles common to all these versions are actually very general and are shared (to some extent) with various other models (for example LIGNUM , TOMSIM , GRAAL ...). The central equation of GreenLab describes the growth of an individual plant potentially in a population (field crops, forest stands...). Competition with other individuals for light, water, nutrients can thus be taken into account and affects the computation of biomass production, see regarding competition for light or for competition for water.
GreenLab aims at describing the source-sink dynamics during plant growth. Sources correspond initially to the seed and then to biomass production and reserve remobilization. Sinks are demands for biomass of all living organs. So far, all sinks have access to all sources since we consider a common pool of biomass. However, this hypothesis is not fundamental and could be relaxed. Since structural development is described in GreenLab at the level of organs, the computation of demands is coupled with organogenesis. For this reason, a consistent time unit for architectural growth and photosynthetic production is defined in order to handle a constant structure. It allows the derivation of the discrete dynamic system of growth, see Figure
It is not necessary to build the tree structure to compute biomass production and partitioning at a given chronological age. We only have to compute organ production, plant demand and photosynthesis. All these data can be derived recursively by applying structural morphisms to the dynamic equation of plant development ( ) giving the number of metamers in the plant as we know the number of organs per metamer and their life spans. The functional growth is then described by the two following steps, biomass acquisition (production) and distribution among living organs.
Biomass acquisition :
Different strategies were used and are currently used
in GreenLab according to plants to compute
Qt, the biomass production at growth cycle
t. There are mostly 3 sources to provide biomass for
allocation: seed, resource acquisition by photosynthesis
and reserve remobilization (from roots, layers or senescent
organs). We will not speak about the seed, which usually
gives
u0and may be considered as emptying on several growth
cycles, that is to say also contributing to
u1,
u2...
Classically, the biomass production at growth cycle
t
Qtis taken as a parametric function of
![]() , the total photosynthetic leaf area, and of the
environmental conditions. To keep it simple, we sum up all
the environmental effects in
, the total photosynthetic leaf area, and of the
environmental conditions. To keep it simple, we sum up all
the environmental effects in
Et, which may be chosen as a function of the
Photosynthetically Active Radiation (PAR), hydric stress
(Fraction of Transpirable Soil Water), temperature (for
biologic efficiency)... Only simple functions have been
tested so far in GreenLab. A possible production function
inspired by classical crop models and Beer-Lambert's law (
and
for details) can be
written:
![]()
where
![]() and
and
![]() are empirical parameters.
are empirical parameters.
It is helpful to rewrite this equation by changing the parametric structure:
![]()
with the parameters having now a more
relevant physical meaning:
![]() is an energetic conversion efficiency,
is an energetic conversion efficiency,
kis the extinction coefficient of the Beer-Lambert
law and
Spis related to a characteristic surface for resource
acquisition.
In her PhD, V. Letort proposed that, after some time, a proportion of organ biomass is given back to the common pool and reallocated to new organs in expansion.
Biomass partitioning :
We recall that
mpt(
n)denotes at growth cycle
ta metamer of physiological age
pand chronological age
n. It contains organs of type
o(where
o=
b,
p,
i,
f, for blades, petioles, internodes, flowers or
fruits respectively) whose masses are denoted by
qo,
pt(
n)at growth cycle
t. Let
To,
pdenote the maximal life span of organs of type
oand physiological age
p. The allocation equation is thus given for all
t![]() 0by:
0by:
where:
po,
pt(
n)is the sink of an organ of
type
oin
mpt(
n)
Dtis the total demand of the plant at growth cycle
t(that is to say the sum of all sinks)
![]()
where
No,
pt(
n)is the number of organs of
type
o, physiological age
p, chronological age
nat time
t.
Qtis the biomass available for allocation.
Eventually, the organ volume depends on its apparent density and its dimensions on allometric rules. All this features can be measured directly from organ forms.
Remark 1This general formulation concerns primary growth of the above ground organs. For the complete model, we need to consider the root system demand, and for trees, the ring demands (for the secondary growth). A detailed presentation of the different types of modelling strategies can be found in the PhD thesis of V. Letort .
The shape chosen for the sink variation function
pis up to the user, but it should be able to fit
properly any kind of numerical variations of the sinks
according to the organ chronological age. Beta laws were
found to be suitable for the purpose.
During her PhD, A.Mathieu modelled a retroaction of plant functioning on plant topology controlled by the state of trophic competition (GL3 model). Such model illustrates in a very simple way how plant plasticity is expressed under environmental constraints.
The vectors
Utand
Vtthat give the rules of the organogenesis model (that
is to say that control the bud behavior) are chosen as
functions of the ratio of available biomass to demand.
Integer part of linear functions are usually chosen. In
Figure
, we see the difference between
the GL1 model (with constant sequences
![]() ,
,
![]() ) and the GL3 model, (with sequences
) and the GL3 model, (with sequences
![]() ,
,
![]() functions of
functions of
ut).
Utis a function of
![]() and
and
Vta function of
![]() (they are usually chosen as linear functions). The
behaviour of the system was studied by A. Mathieu during
her PhD. The conditions of the growth stabilisation were
determined according to the parameters. Moreover, an
interesting emerging property was obtained: under some
conditions, rhythmic phenomena may be generated by the
system (Biomass production, fruiting and branching
alternation, number of internodes per growth unit ..., see
Fig.
). Such phenomena are often
observed during plant growth but were poorly modelled so
far.
(they are usually chosen as linear functions). The
behaviour of the system was studied by A. Mathieu during
her PhD. The conditions of the growth stabilisation were
determined according to the parameters. Moreover, an
interesting emerging property was obtained: under some
conditions, rhythmic phenomena may be generated by the
system (Biomass production, fruiting and branching
alternation, number of internodes per growth unit ..., see
Fig.
). Such phenomena are often
observed during plant growth but were poorly modelled so
far.
As detailed in the section giving the new research results of the team, some important results concerning the calibration of the thresholds of fructification have been obtained on cucumber plants (in collaboration with the Chinese Agricultural University and Wageningen).
The objective is now to give a parobabilistic framework to this model of interaction.
The results on single plant growth modelling are extended at the field and stand level, in order to simulate crop and forest production. It needs to integrate the competition for light and for soil resources among plants.
A model of competition for light :
The empirical production equation of GREENLAB is extrapolated to stands by computing the exposed photosynthetic foliage area of each plant. The computation is based on the combination of Poisson models of leaf distribution for all the neighbouring plants whose crown projection surfaces overlap, .
To study the effects of density on architectural development, we link the proposed competition model to the model of interaction between functional growth and structural development introduced by Mathieu .
The model was applied to mono-specific field crops and forest stands.
The application of the model to trees illustrates the expression of plant plasticity in response to competition for light, cf. Figure . Density strongly impacts tree architectural development through interactions with the source-sink balances during growth. The effects of density on tree height and radial growth that are commonly observed in real stands appear as emerging properties of the model.
For high density crops at full cover, the model is shown to be equivalent to the classical equation of field crop production (Howell and Musick, 1984) . However, our method is more accurate at the early stages of growth (before cover) or in the case of intermediate densities. It may potentially account for local effects, such as uneven spacing, variation in the time of plant emergence or variation in seed biomass.
Functional landscapes :
Models of landscape functioning aims at simulating, crop plantations and small landscape with a “reactive” environment. The goal is to simulate water exchanges (rain, runoff on terrain and absorption, diffusion in soil, plant water uptake and evapotranspiration) and competition in interaction with the GreenLab growth model. The difficulty of the approach lies in the multiphysics and multiscal models to implement. After some prelimnary works carried out at LIAMA, it is now the PhD subjet of V. Le Chevalier, under the supervision of Marc Jaeger.
Two successive prototypes were developped. The first prototype, voxel based, was a simple simulator synchronizing all events at a daily schedule (water rain, run-of, diffusion, plant growth). Models were basic, and run-of simulated as a diffusion process on the land surface , using a discrete volume spatial grid. This model was implemented in C++ under QT environment and tested on BULL Novascale HPC (16 cores). The second prototype, is still based on a spatial discrete grid, but limited to the layer. It involves an appropriate water run-off model, and the plant model is a simple version of the GreenLab crop model and involves more advanced visualisation tools.
At this stage, visualisation of functional landscape simulations aims at visualizing combination of maps (among terrain altitudes, water soil content, run off, daily biomass, cumulated biomass, temperature, ...). Classical surface mesh tools were written, as well as histogram, and curve display tools, allowing comparisons during a given period, or spatial heterogeneity comparisons at a given stage. The orginality of the developped tools lays in the fact that all these maps are dynamic (daily change), and thus not compatible with classical approaches (all in memory). Vegetation representation is rougth, limited to a simple color definition merged with the relief texture. A "pseudo realistic" landscape visualisation can be preformed representing the cumulated biomass by spheres, converting some how the crop production to a "tree crow". The correponding tool (SURFVIEW) is written in C++ with GLUT and OpenGL librairies.
The system was tested on synthetic cases, with real climate conditions and published in JCST journal .
Both prototypes show strong conceptual limitations especially on two crucial points: model synchronism and data integrity. Time synchronism is a strong critical aspect in our case since we have to face calendar asynchronism processes (rain, run off) with thermal time cycles (plant development). However plant functioning must be simulated at short periods of calendar time in order to uptake the appropriate water supply. Concerning data now, and more precisely water ressources, the various models (run off, absorbtion, plant growth interact spatially on the same data with high risk of collusion). Since end 2006, concepts to develop the design of landscape functional simulators are extensivily studied leading slowly to discrete event simulation formalisms.
The plant architecture is a target for the mathematical model, and it is the visual result of the growth process. The hidden parameters of source and sink functions must be estimated in order to fit the weights and sizes of all the organs produced by the plant development at each stage of growth. Theoretically speaking, this inverse method should be able to assess also the effect of the environment (climate and density), biomass production and biomass partitioning to each organ during the growth from the architectural data. However, the identifiability issue has not been studied yet. Only a lot of numerical tests on a wide variety of real plants have helped us define a proper experimental framework for identification, see for example .
The Generalized Least Square Method was used for parameter estimation of the model. The application of this method to GreenLab was described by Zhan et al. and Guo et al. . Advantages of this method are that it provides rapid convergence and the standard error linked to the parameter values thus indicating the accuracy of the solution. Fitting can be done on a single architecture (single fitting), or on several stages of growth to follow the trajectory of the dynamical process (multi-fitting). This second one is more accurate, since it helps retrieving the dynamics of sink variation more easily. In both cases all the data are adjusted at the same time by the same parameter set.
This methodology for parametric identification was implemented in Digiplantsoftware, and used on several plants: Maize , Arabidopsis , Pine saplings , Cucumber , Sugar-Beet , Cotton , Beech , Chrysanthemum , Grapevine ...
We give beneath an example on the sugar beet. It corresponds to an industrial partnership with the French institute for Sugar Beet Research (ITB). Concerning the experimental data from which the model parameters are estimated, biomass measurements were carried out at seven different stages. At each date, seven individuals plants were selected and the dry mass of every individual organ (blades, petioles and root storage) was measured. The average of the seven plants was constructed. The numerical values of the parameters as well as their variances are given in and are not recalled here. As an illustration, Figure shows the fitting curves.
If the goodness of fit is excellent, the statistical analysis of the estimation results is not properly done yet. The variances of the estimates are given under the assumption that the error model chosen is the good one. But the hypothesis of a diagonal noise covariance matrix which is used in the generalized least square method, is quite gross. It corresponds to using only the deterministic part of the dynamical model, which is really restrictive since in dynamic models, errors propagate. Current studies aim at improving estimation by modelling the dynamics of the covariance matrix of the model noise.
The computer graphics in Digiplante inherits from the long tradition of AMAP works , and is mostly conducted since 2004 in close partnership with the GreenLab team at LIAMA (Dr. ZHANG XiaoPeng and his students).
Principles and main research axis hold in the frame of the project :
Plant simulated visualization in DigiPlante project is still based on the AMAP prinicples , characterized by a high level, device independant simulation output, called the line-tree. Geometrical ouput is a final process in the simulation stage, that can be processed or not. The Linetree structure describes a plant by a list of organs, refered by basic indetification information (organ type, age) and organ positioning in space 3D origin relative to seed position, and 3D orientation. Orientations (main direction, normal and secondary) are scalled, story thus internode diameter/length and other organ sizes. These geometrical informations are stored in a 3 by 4 mattrix, similar to a classical OpenGl Mattrix Model Viewer. This data structure shows several interests and drawbacks:
The Line tree structure does not store an exhaustive geometry, but just the list of each plant componant with its orientation
The structure is flat, no hierarchy or topology information is given. However, extension were developped, using a separated structure storing the componant father-son relations. From these, pruning operatin are available as well as branch per branch output or other hierarchical tree based data exploring schemes.
The structure cannot be displayed directly; each componant must be given an exhaustive geometrical description, build from instance from CAD-CAM tools. On the other side, the tree skeletton is obvious to be extracted and displayed; each componant can be simply represented by a simple line linking its origin to the end point of its main direction (which is scalled). This approach allows thus a wide range of representations, open to many graphical systems. It can be compared to a classical Display List, in which primitive objects are to be defined according to the viewing system for each kind of organ (usually a simple cilinder for branch, and specific shapes for the other organs). Organ representation must be normalized; i.e. each organ must be defined using the same main axis and normal axis and normalized in size: unit volume or length for branch/fruits, unit area for leaves.
Graphical rendering aspects, including illumination properties, textures are thus independant for the line tree, since define at the organ geometry descrition level.
The structure allows Level of Details approaches and simplifications. According to componant sizes (length / diameter ) selection can be done in order to extract componants of interest (trunk and main axis). Coupled to statistical selection of leaves/flower, fruits, lower graphical model can be generated, without losing the global sahpe of the simulated plant. On branches, successive componants can be concataneted, remplacing list of internodes by a straith branch piece.
The Line tree structure has shown a large interest for easy visualisation of complex trees on a wide range of systems, but is poorly adapted to advanced LOD models (such as hybrid polygonal/billboards models)and fast huge scene representation.
Scenes such as crops, forest, up to landscape visualisation was, up to now, mainly developped on a plant basis (not on a landscape use basis, as it is more and more the case in commercial products); and also without advanced dynamics, especially without plant/environment dynamics.
In the frame of the digiplante project, computer graphics development axis aims at developing new methods and approaches aiming to visualize large vegetation scenes in acceptable time (close to real time), in respect to plant structure and functioning. Prior is thus given to approaches keeping biological consistency (for instense leaf area) to appraoches keeping aesthetic aspects. Research axis do concern single plant LOD model definition, and new landscape simulation/visualisation approaches.
Single Plant LOD Models. :
Concerning single plant representation. In cooperation with LIAMA, we developped a set of algorithms dedicated to generate continuous LOD geometrical model from a Line tree and its associated hierarchical topology. The principles of the approach are the following:
The tree structure (trunk and branch) is converted to a Frenet Diagram. This diagram can be compressed, merging consecutive elements together, under control (error controlled). A branch part of the diagramm is then described by an equation. At the rendering stage, according to the viewing parameter, the appropriate Diagram is retrieved, and the discretisation of branch in polygons is performed, also according to viewing parameters. If branch diameter gets lower than a pixel, transparent lines are used for rendering.
For foliage, the proposed approach is to merge leaves two by two until reaching a simple quad for the whole plant crown . Various methods were explored to obtain an efficient merging process. The main idea is to collapse leaf candidates within specific clusters, faithful to botanical hierarchical structures. Hierarchical Leaf Union keeps more leaf surface area, keeping functional consistency of the DigiPlant model. In the various collapsing models, principles of the LOD schemes are unchanged, while preprocessing stages are revisited, making the approach operative for huge trees and heavy forest scenes .
in order to avoid multiple exchanges between GPU and CPU, scenes are rendered according to tree species and individuals (to optimise instanciations). The full foliage lod models are stored in a simple table, compressed and send to the GPU. wWile rendering, CPU computes the adequate LOD model, sending then the corresponding indexes of the table to the GPU. GPU draws then all items lying in the table between these indexes.
Specific LOD shemes were also defined for coniferes, replacing graphical primitives (cylinders) by lines, and defining line set replacement patterns by simple lines on far trees.
An extensive summary paper covering many aspects developped in the past four years has been published by Wesley in Computer Anination and Virtual Words journal CAVW08
This topic started two years ago at LIAMA, in the frame of the GreenLab project, with the objective to generate plant geometry from laser range point data. The work of PhD Zhu Cao is dedicated to the foliage crown. The proposed approach uses alpha shape (extension of voronoi diagrams). Originality of the approach lies in the automate definition of the alpha parameter (that controls the "smoothness" of the crown shape) , using a topological criteria: we want the surface to be a manifold. This approach, presented at Edutainment 08 shows also a high interest on simulated plants, generating thus simplified shapes of crowns. 3D reconstruction from laser range point becomes a hot topic in forestry sciences. Both LIAMA GreenLab team and Digiplante were sollicited to participate to an ANR Bioenergy project "EMERGE", planning to evaluation wood ressource for energy (project is accepted and started begining 2009)