|
|

|

|
| e-Pub |
Section: New Software and Platforms
Reorder.js
Participant : Jean-Daniel Fekete [correspondant] .
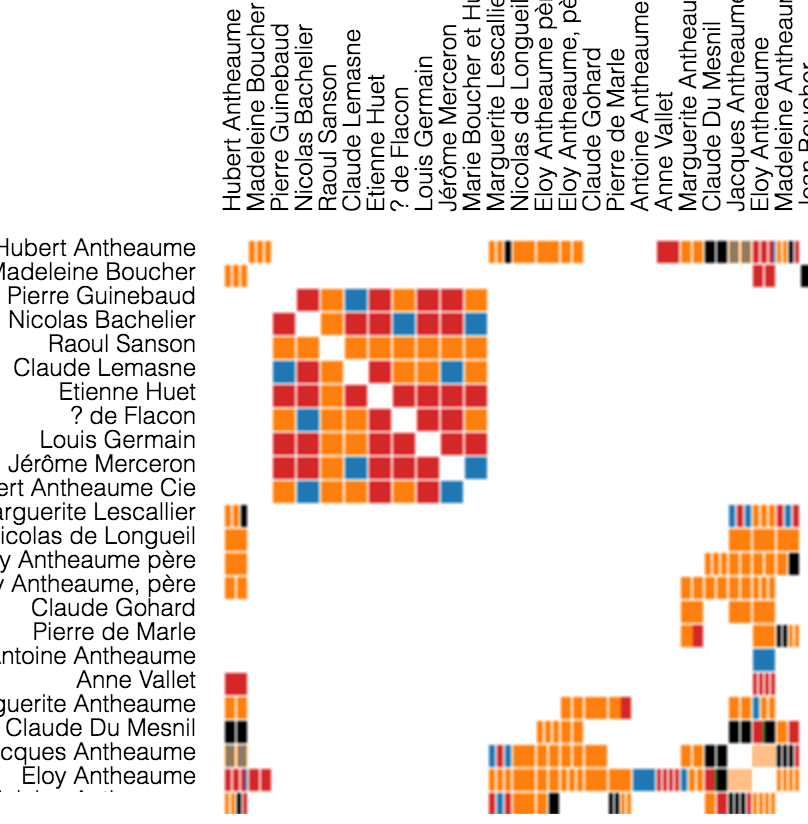
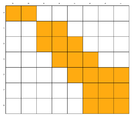
Visualizing data tables and graph/network can be done using a matrix visualization. Jacques Bertin, the French cartographer and visualization pioneer explained in his book "Semiology of Graphics" that, to make sense of a matrix, it should first be correctly ordered. This is what the Reorder.js library is doing.
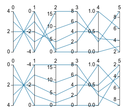
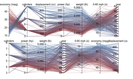
Ordering is also useful for other purposes. For example, if you want to visualize with Parallel Coordinates, you should provide an order for the dimension axes. Reorder.js can be used to find a suitable order. See also the poster paper [48].
The library also provide examples of visualizations using reordering; they are based on the d3.js library. For more information, see our survey of methods for matrix reordering [3].