|
|

|

|
| e-Pub |
Section: Research Program
Covariance estimation
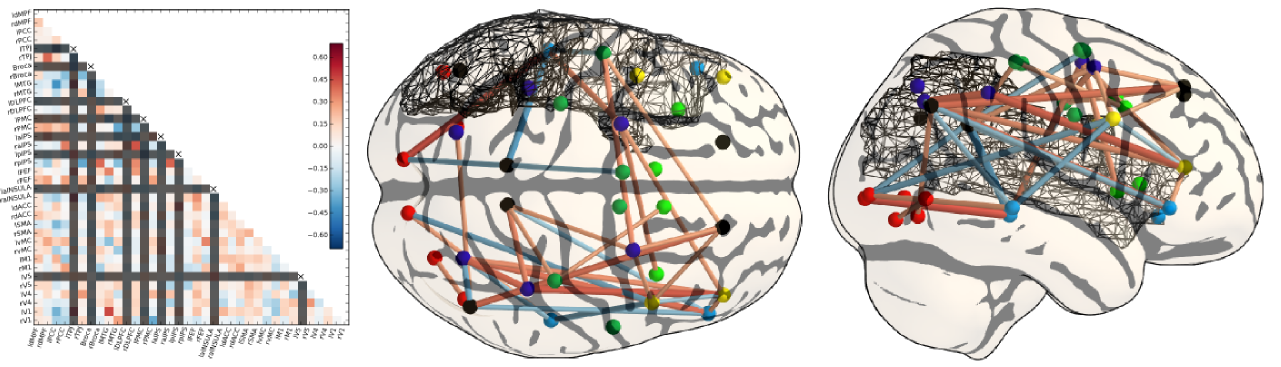
Another important estimation problem stems from the general issue of learning the relationship between sets of variables, in particular their covariance. Covariance learning is essential to model the dependence of these variables when they are used in a multivariate model, for instance to study potential interactions between variables. Covariance learning is necessary to model latent interactions in high-dimensional observation spaces, e.g. when considering multiple contrasts or functional connectivity data.
The difficulties are two-fold: on the one hand, there is a shortage of data to learn a good covariance model from an individual subject, and on the other hand, subject-to-subject variability poses a serious challenge to the use of multi-subject data. While the covariance structure may vary from population to population, or depending on the input data (activation versus spontaneous activity), assuming some shared structure across problems, such as their sparsity pattern, is important in order to obtain correct estimates from noisy data. Some of the most important models are:
-
Sparse Gaussian graphical models, as they express meaningful conditional independence relationships between regions, and do improve conditioning/avoid overfit.
-
Decomposable models, as they enjoy good computational properties and enable intuitive interpretations of the network structure. Whether they can faithfully or not represent brain networks is still an open question.
-
PCA-based regularization of covariance which is powerful when modes of variation are more important than conditional independence relationships.
Adequate model selection procedures are necessary to achieve the right level of sparsity or regularization in covariance estimation; the natural evaluation metric here is the out-of-samples likelihood of the associated Gaussian model. Another essential remaining issue is to develop an adequate statistical framework to test differences between covariance models in different populations. To do so, we consider different means of parametrizing covariance distributions and how these parametrizations impact the test of statistical differences across individuals.
|