Section:
New Results
Similarity encoding for learning with dirty categorical variables
For statistical learning, categorical variables in a table are usually
considered as discrete entities and encoded separately to feature
vectors, e.g., with one-hot encoding. "Dirty" non-curated data gives
rise to categorical variables with a very high cardinality but
redundancy: several categories reflect the same entity. In databases,
this issue is typically solved with a deduplication step. We show that
a simple approach that exposes the redundancy to the learning
algorithm brings significant gains. We study a generalization of
one-hot encoding, similarity encoding, that builds feature vectors
from similarities across categories. We perform a thorough empirical
validation on non-curated tables, a problem seldom studied in machine
learning. Results on seven real-world datasets show that similarity
encoding brings significant gains in prediction in comparison with
known encoding methods for categories or strings, notably one-hot
encoding and bag of character n-grams. We draw practical
recommendations for encoding dirty categories: 3-gram similarity
appears to be a good choice to capture morphological resemblance. For
very high-cardinality, dimensionality reduction significantly reduces
the computational cost with little loss in performance: random
projections or choosing a subset of prototype categories still
outperforms classic encoding approaches.
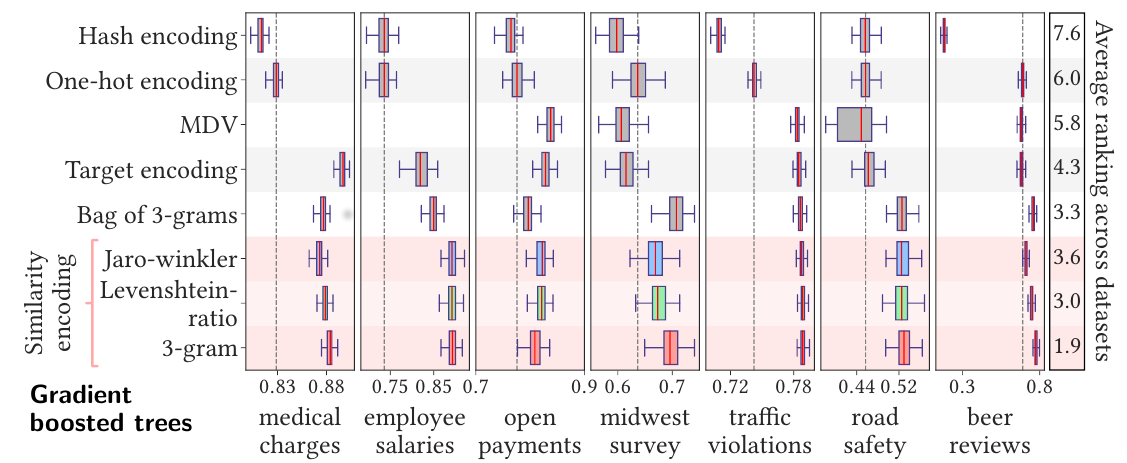
Figure
12. Performance of different encoding methods in a gradient
boosting classification task. Each box-plot summarizes the
prediction scores of 100 random splits (with 80% of the samples
for training and 20% for testing). For all datasets, the
prediction score is upper bounded by 1 (a higher score means a
better prediction). The right side of the figure indicates the
average ranking across datasets for each method. The vertical
dashed line indicates the median value of the one-hot encoding
method.
|
|
More information can be found in [7].