|
|

|

|
| e-Pub |
Section: New Results
Shapes in time
Graph-based model for multitemporal segmentation of sea ice floes from satellite data
Participants : Claudio Price González, Yuliya Tarabalka [contact] .
This work has been done in collaboration with Dr. Ludovic Brucker (NASA GSFC, USA) [http://www.nasa.gov ].
Multitemporal segmentation, region growing, MODIS, sea ice floes
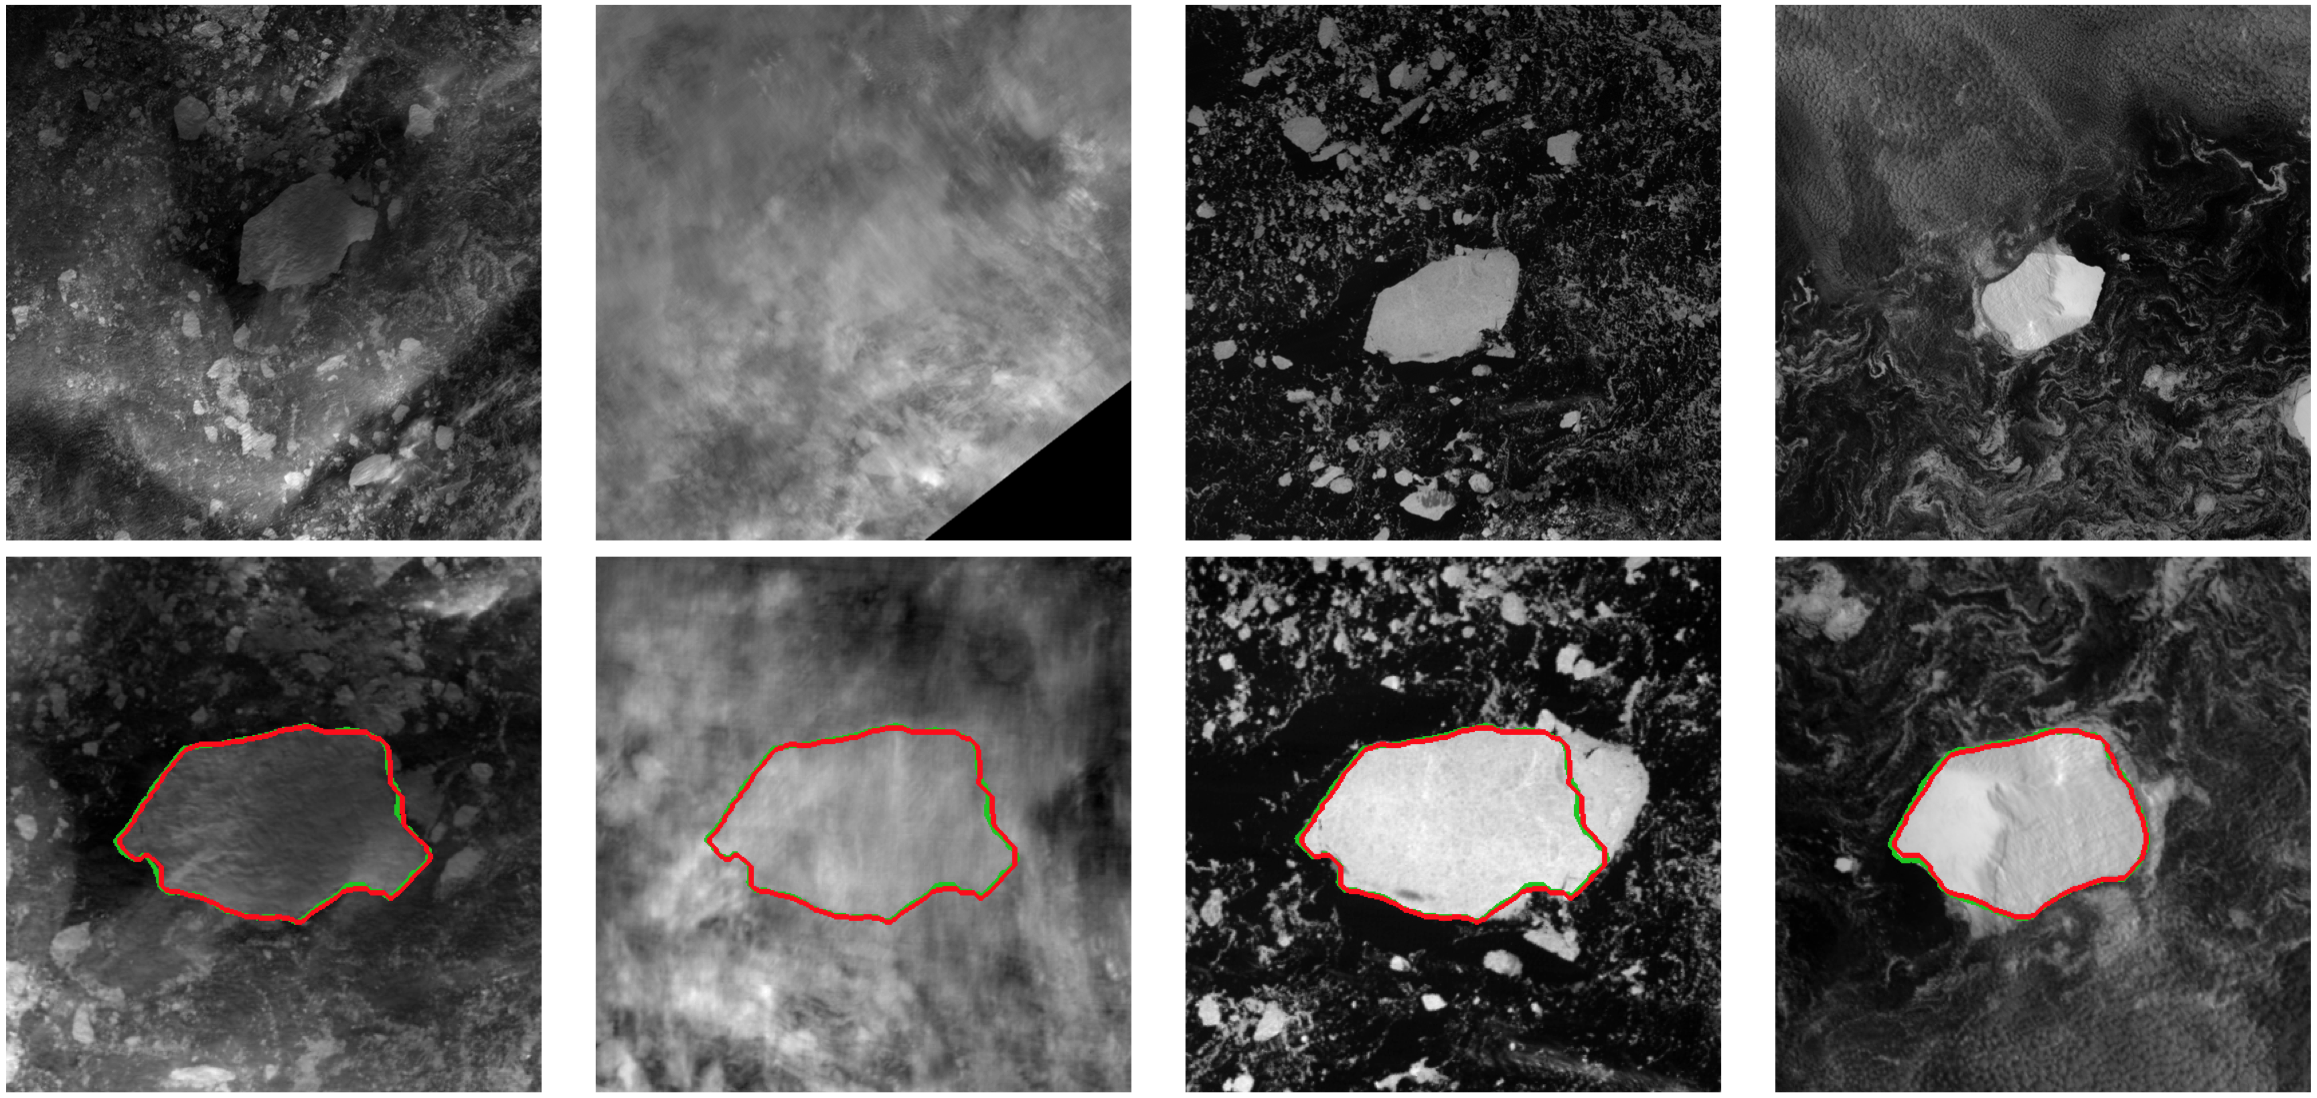
Automated segmentation of the evolution of sea ice from satellite images would allow scientists studying climate change to build accurate models of the sea ice meltdown process, which is a sensitive climate indicator. In this work, we proposed a new method which uses shape analysis and graph-based optimization to segment a multiyear ice floe from time series of satellite images [13] . The new approach combines data from two instruments onboard the NASA Aqua satellite, enabling several measurements per day over the Earth's polar regions: Advanced Microwave Scanning Radiometer - Earth Observing System (AMSR-E); and Moderate-Resolution Imaging Spectroradiometer (MODIS). The method performs best merge region growing, followed by energy minimization on the image graph, where the energy consists of two terms describing the floe shape (shape term) and the gradient between the floe and the background (data term), respectively. We validated the performance of the proposed method for segmentation of a shrinking ice floe from a sequence of AMSR-E and MODIS images acquired in August–October 2008 (see Figure 11 ). The results obtained showed both the effectiveness of the proposed approach and its robustness to low-contrast data.
|
Enforcing monotonous shape growth or shrinkage in video segmentation
Participant : Yuliya Tarabalka [contact] .
This work has been done in collaboration with Dr. Guillaume Charpiat (STARS team, Inria-SAM), Dr. Bjoern Menze (Computer Vision Laboratory at ETH Zurich and Asclepios team at Inria-SAM), and Dr. Ludovic Brucker (NASA GSFC, USA) [http://www.nasa.gov ].
Video segmentation, graph cut, shape analysis, shape growth
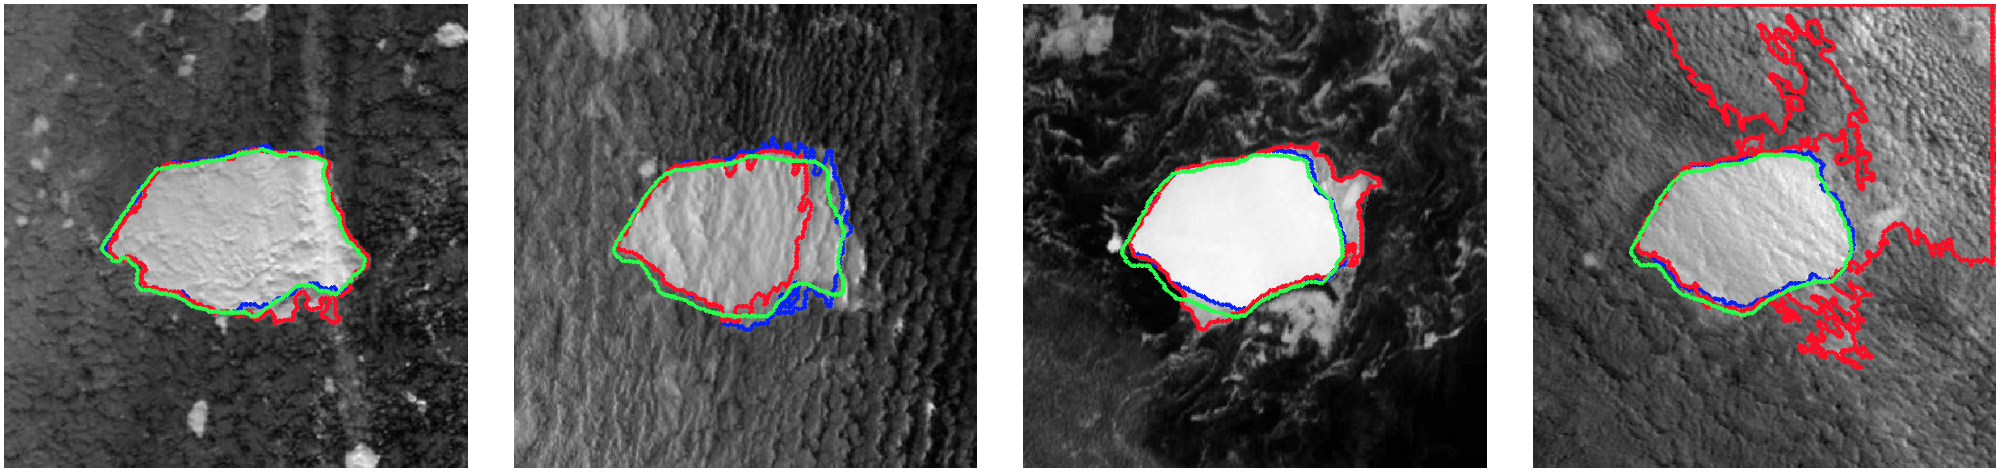
Automatic segmentation of objects from video data is a difficult task, especially when image sequences are subject to low signal-to-noise ratio or low contrast between the intensities of neighboring structures. Such challenging data are acquired routinely, for example, in medical imaging or satellite remote sensing. While individual frames can be analyzed independently, temporal coherence in image sequences provides a lot of information not available for a single image. In this work, we focused on segmenting shapes that grow or shrink monotonically in time, from sequences of extremely noisy images.
We proposed a new method for the joint segmentation of monotonically growing or shrinking shapes in a time sequence of images with low signal-to-noise ratio [15] . The task of segmenting the image time series is expressed as an optimization problem using the spatio-temporal graph of pixels, in which we are able to impose the constraint of shape growth or shrinkage by introducing unidirectional infinite-weight links connecting pixels at the same spatial locations in successive image frames. The globally-optimal solution is computed with a graph-cut algorithm. The performance of the proposed method was validated on three applications: segmentation of melting sea ice floes; of growing burned areas from time series of 2D satellite images [16] ; and of a growing brain tumor from sequences of 3D medical scans. In the latter application, we imposed an additional inter-sequences inclusion constraint by adding directed infinite-weight links between pixels of dependent image structures. Figure 12 shows a multi-year sea ice floe segmentation result. The proposed method proved to be robust to high noise and low contrast, and to cope well with missing data. Moreover, it showed linear complexity in practice.