|
|

|

|
| e-Pub |
Section: New Results
Tracking growing axons in 3D+t fluorescent two-photon microscopy images
Participants : Sylvain Prigent, Xavier Descombes [contact] , Florence Besse, Caroline Medioni.
During the maturation of the nervous system, neuronal cells emit cellular extensions (dendrites, axons) allowing them to connect to other neurons, and thus, establish a network in which information is transmitted and/or stored. The formation of axonal extensions and directed migration of these extensions are two key processes controlling the morphology of neuronal cells, and then the number and nature of partners in a given network within a neuron. These two processes are controlled by both external factors to neuronal cell (guidance molecules, neurotrophic signals, ...) and internal factors (transcription factors, post-transcriptional regulators, regulators of the actin cytoskeleton or microtubules, ...). The goal of this work is to automatically extract axonal trajectories from images to then be able to model the processes controlling the morphology of neuronal cells.
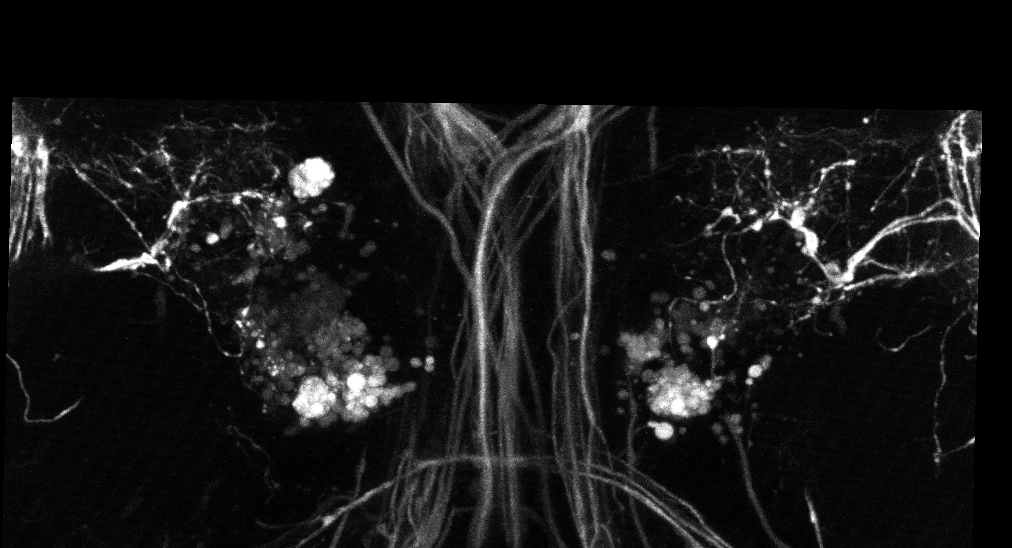
The images we use are 3D+t images of growing drosophila brains obtained with a bi-photon confocal microscope. A single movie is about 200 3D frames that correspond to an acquisition every 5 minutes.
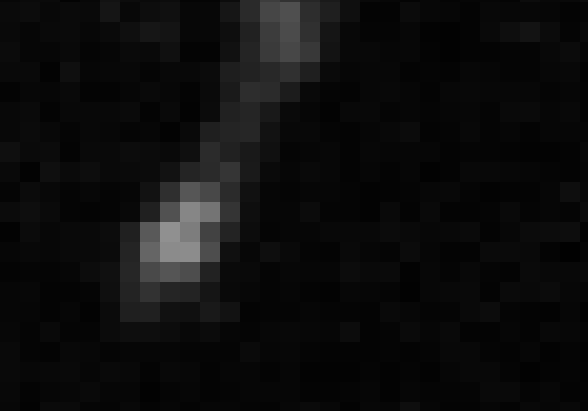
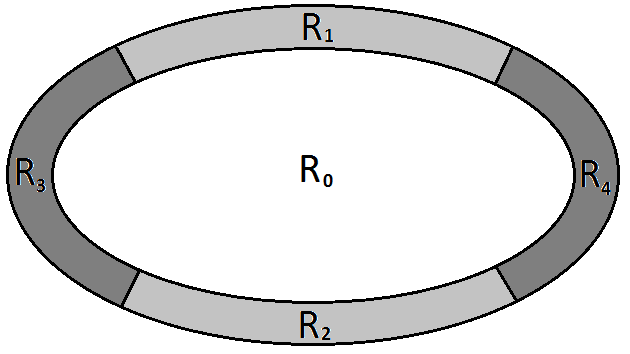
The developed method to extract axonal trajectories from 3D+t images is made of 3 main steps. The first step is to detect axonal tips on each 3D frame of the movie. This detection is performed using Marked Point Process. We designed a dedicated model based on an ellipse shape, a prior of no-overlapping between detected ellipses, and a data term calculated by:
where denote the Bhattacharyya distance, the set of pixels inside the ellipse and , , , four sets of pixels obtained by partitioning the ellipse contour into 4 regions around the ellipse vertex (see figure 9 ).
The second step consists to track the axons along the time frames by linking the tips detections. We designed an association tracking algorithm that builds a graph by connecting spatially close detections in neighboring frames. Negative costs have been introduced to favor long tracks. Then we ran sequentially the shortest path algorithm on this graph to obtain axons trajectories (see figure 10 (b)).
As the axonal tips size is close to the image resolution, the proposed method as the drawback to give false alarms trajectories. We then added a last processing step that aim to analyze the trajectories and remove those that do not correspond to axonal trajectories. This filtering removes three types of trajectories: 1) the trajectories that follow static regions of the image, 2) the short trajectories (less than 5 frames) and 3) random walk trajectories. An example of final automatic tracking is shown in figure 10 (c).