|
|

|

|
| e-Pub |
Section: New Results
Curve and graph classification using a specific metric and kernel Support Vector Machines
Participants : Vladimir Gutov, Eric Debreuve, Xavier Descombes.
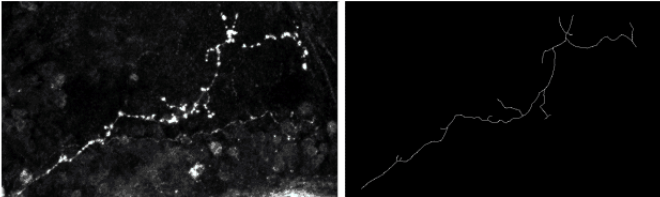
The analysis and comparison of trees are of great importance since many natural structures can be described using such models. In biology, lung airways, neurons, blood vessels can be represented by trees (or, more generally, by graphs). Starting from a biological problem (automatically classifying neurons as wild or mutant), we studied the question of using Support Vector Machines (SVM) to classify continuous data such as curves, trees and graphs. Indeed, SVMs are designed for discrete data, looking for an optimal separation hyperplane or manifold in a discrete normed space. Manifolds are found when the original, linear SVM formulation is extended using the so-called kernel trick. The Gaussian kernel is the most popular one. By definition, the isotropic Gaussian kernel involves the two sample data to be compared through the distance between them. This opens the application of Gaussian-kernelized SVMs to any normed space. When dealing with (continuous) curves, the Fréchet distance can be used. We also tested a metric based on shape analysis [34] . Finally, a (meta-)distance between trees proved to be efficient in comparing axons [33] (see Fig. 13 ). The “meta” qualifier means that this distance builds upon a metric between curves and is valid for any such metric. It was tested using the shape-based metric [34] . We adapted an open-source SVM implementation to be able to use the three aforementioned metrics (two between curves, one between trees) and we validated the classification approach on synthetic data and on a small database of 20 wild-type neurons and 24 mutants provided by biologists.