|
|

|

|
| e-Pub |
Section: New Results
Detection of Hedgehog protein using confocal imaging
Participants : Sylvain Prigent, Xavier Descombes.
This work was made in collaboration with P. Therond's group at iBV
P. Therond's lab is focusing on the understanding of how the secreted Hedgehog (Hh) morphogen, a dually lipidated highly hydrophobic molecule bound to membranes, is secreted, released and transported from the place of production in Drosophila. High resolution microscopy developed to identify and visualize such processes was successfully applied to address this question, but dynamics of membrane transport is still poorly understood mainly due to the lack of a reliable model or the need of fixation.
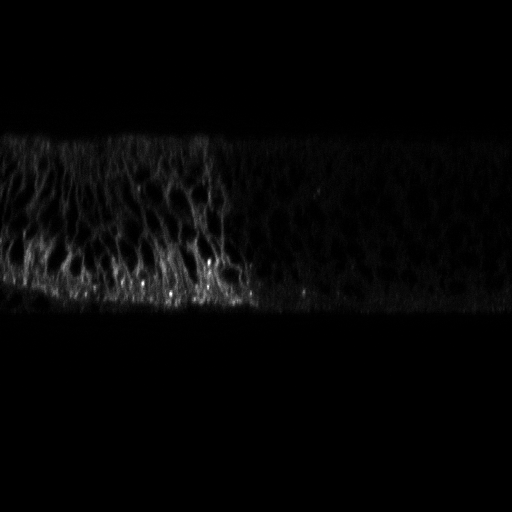
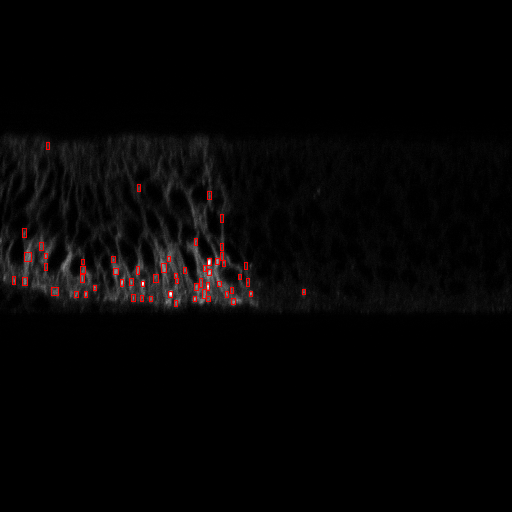
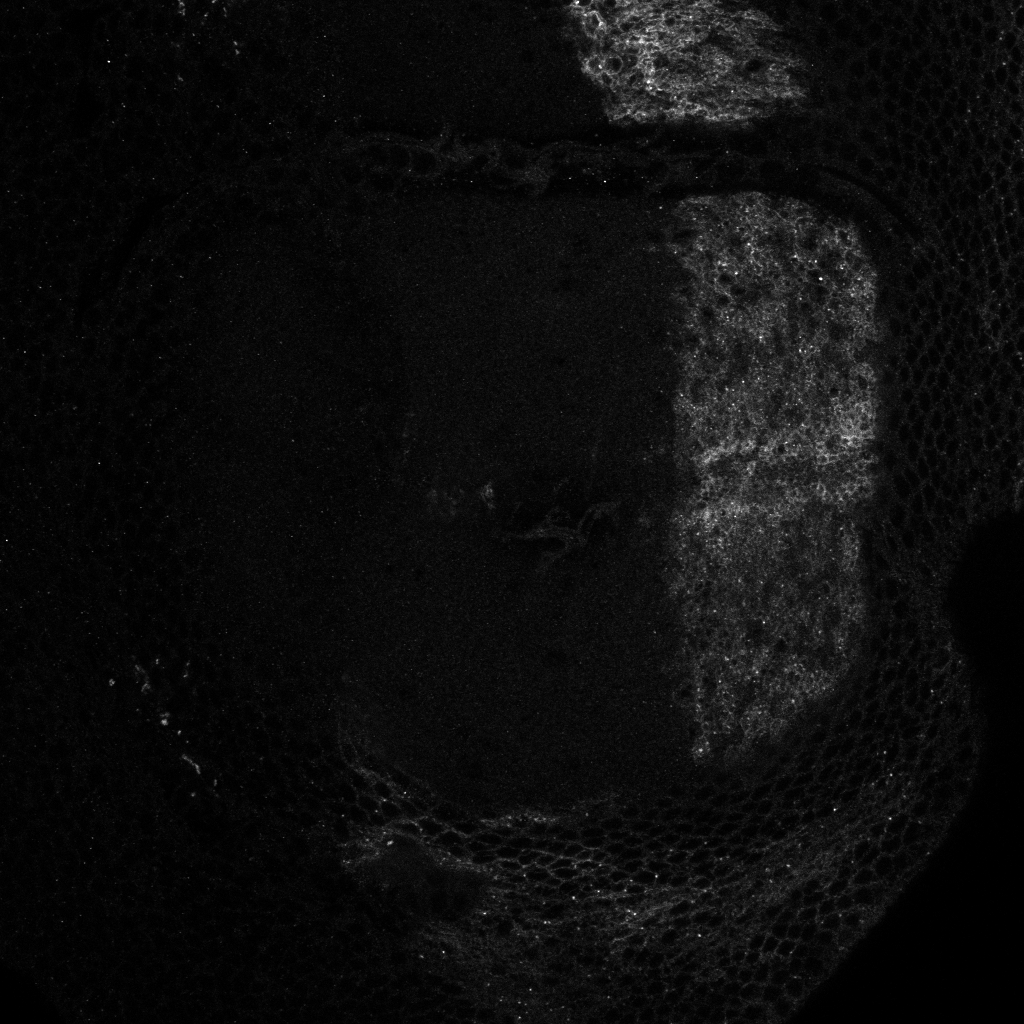
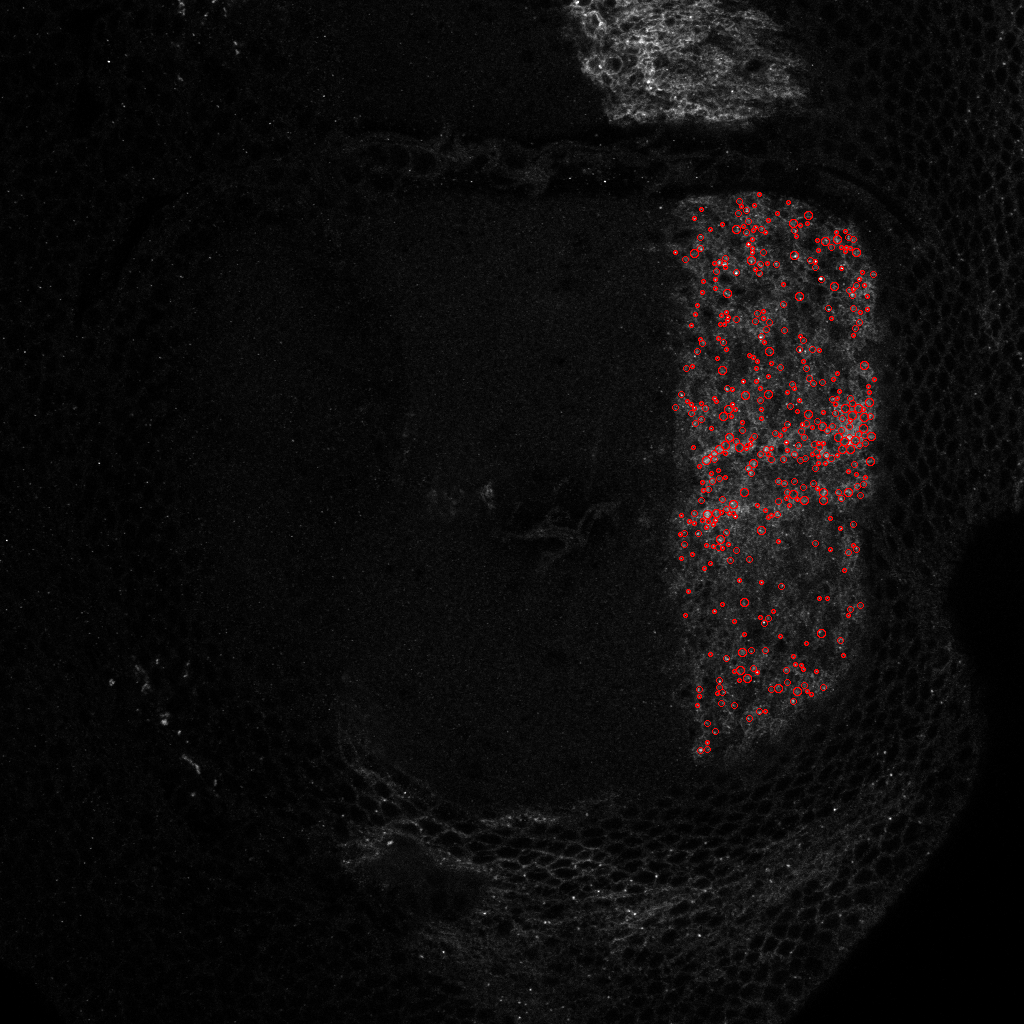
To statistically quantify the position of a population of Hedgehog proteins inside a cell, we need an automatic image processing method that detect each individual Hedgehog proteins in a 3D confocal image. The 3D images are obtained either by scanning slices (see figure 15 ), or by scanning slices (see figure 16 ). For both types of images, we used Marked Point Process (MPP) to detect 2D objects independently on each frame since proteins appear only in one slice. Using the slices, we observed that proteins appear as vertical rectangles whose size is close to the image resolution. We then design an MPP model to search for a configuration of vertically oriented rectangles that do not overlap one to each other. To define a data term for a given rectangle in the image, we calculate the Bhattacharyya distance between the population of pixels inside the rectangle and the population of pixels in the border of the rectangle. For the slices, we defined an MPP model to search for circles that do not overlap one to each other, and the data term is calculated with the Bhattacharyya distance as for the rectangle model. Examples of obtained results are shown in figures 15 and 16 .