|
|

|

|
| e-Pub |
Section: New Results
Group-level impacts of within- and between-subject hemodynamic variability in fMRI
Participants : Gaël Varoquaux, Solveig Badillo, Philippe Ciuciu [Correspondant] .
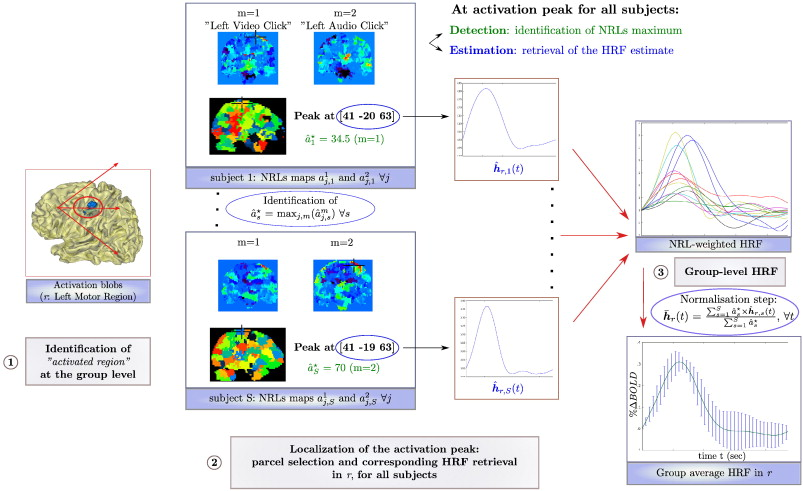
Inter-subject fMRI analyses have specific issues regarding the reliability of the results concerning both the detection of brain activation patterns and the estimation of the underlying dynamics. Among these issues lies the variability of the hemodynamic response function (HRF), that is usually accounted for using functional basis sets in the general linear model context. Here, we use the joint detection-estimation approach (JDE) [76] , [78] , which combines regional nonparametric HRF inference with spatially adaptive regularization of activation clusters to avoid global smoothing of fMRI images (see Fig. 4 ). We show that the JDE-based inference brings a significant improvement in statistical sensitivity for detecting evoked activity in parietal regions. In contrast, the canonical HRF associated with spatially adaptive regularization is more sensitive in other regions, such as motor cortex. This different regional behavior is shown to reflect a larger discrepancy of HRF with the canonical model. By varying parallel imaging acceleration factor, SNR-specific region-based hemodynamic parameters (activation delay and duration) were extracted from the JDE inference. Complementary analyses highlighted their significant departure from the canonical parameters and the strongest between-subject variability that occurs in the parietal region, irrespective of the SNR value. Finally, statistical evidence that the fluctuation of the HRF shape is responsible for the significant change in activation detection performance is demonstrated using paired t-tests between hemodynamic parameters inferred by GLM and JDE.
More details can be found in [49] .
|