|
|

|

|
| e-Pub |
Section: New Results
Extracting Statistical Information from Videos with Data Mining
Participants : Giuseppe Donatiello, Hervé Falciani, Duc Phu Chau, François Brémond.
keywords: video data mining, activity recognition, clustering techniques
Objective
Manual video observation is becoming less practical due to growing size of data. To tackle this problem, we have built a system to retrieve videos of interest thanks to an index based on activities recognized in an automated manner. We automatically detect activities in videos by combining data mining and computer vision to synthesize, analyze and extract valuable information from video data.
Approach
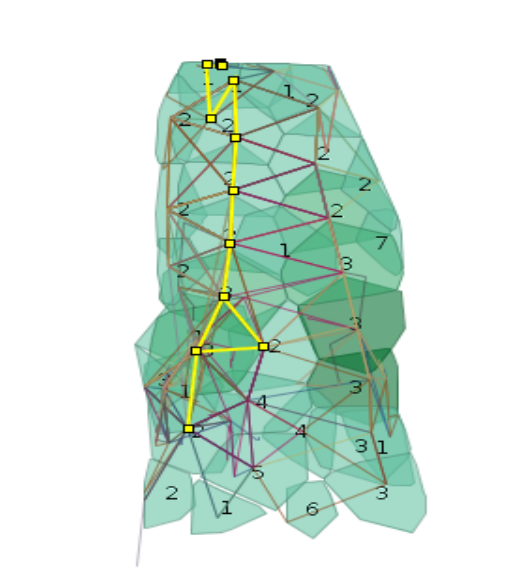
Our research introduces a new method for extracting statistical information from a video. Specifically, we focus on context modeling by developing an algorithm that automatically learns the zones in a scene where most activities occur by taking as input the trajectories of detected mobiles. Using K-means clustering, we define activity zones characterizing the scene dynamics, we can extract then people activities by relating their trajectories to the learned zones.
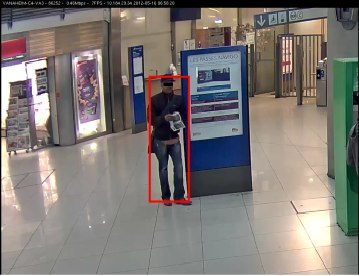
Results
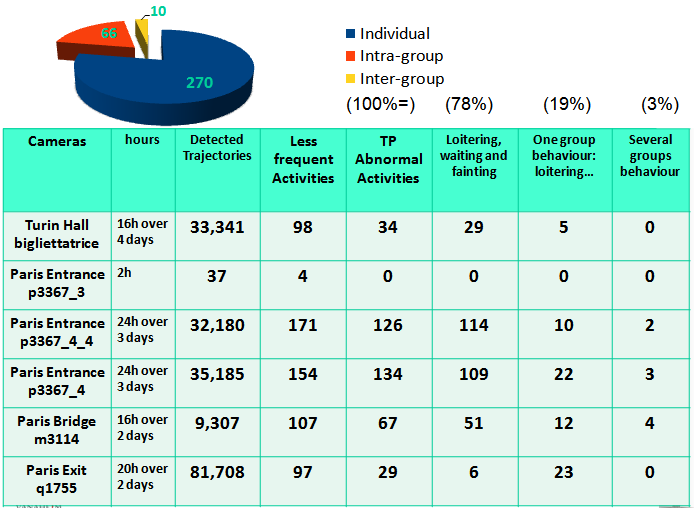
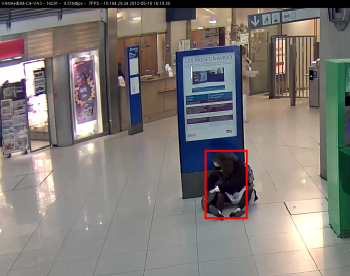
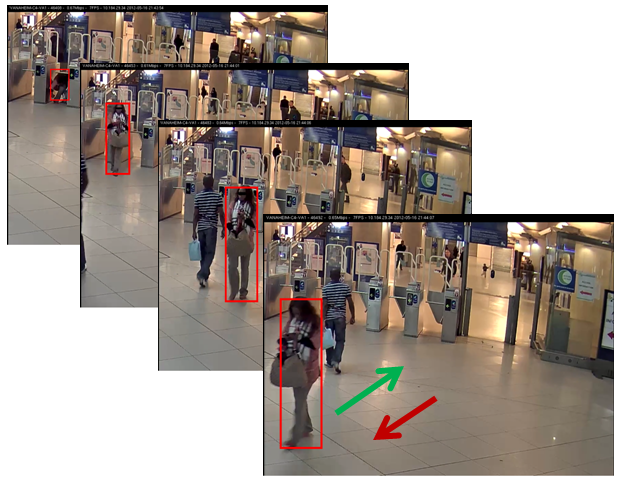
To evaluate our system we have extended the OpenJUMP framework, an open source for Geographic Information System (GIS). The end user can have an overview of all activities of a large video, with the possibility of extracting and visualizing activities classified as usual or unusual. We have tested our approach on several videos recorded in subways in Turin (Italy) and Paris, as shown below, some examples of unusual activities (Figures 41 , 42 and 43 ).The system has been showed in a live demonstration at RATP company in Paris for the European project Vanaheim (http://www.vanaheim-project.eu/).