|
|

|

|
| e-Pub |
Section: New Results
Uncertainty quantification and risk assessment
The uncertainty quantification of environmental models raises a number of problems due to:
-
the dimension of the inputs, which can easily be - at every time step;
-
the high computational cost required when integrating the model in time.
While uncertainty quantification is a very active field in general, its implementation and development for geosciences requires specific approaches that are investigated by Clime. The project-team tries to determine the best strategies for the generation of ensembles of simulations. In particular, this requires addressing the generation of large multimodel ensembles and the issue of dimension reduction and cost reduction. The dimension reduction consists in projecting the inputs and the state vector to low-dimensional subspaces. The cost reduction is carried out by emulation, i.e., the replacement of costly components with fast surrogates.
Application of sequential aggregation to meteorology
Participants : Jean Thorey, Paul Baudin, Vivien Mallet, Stéphanie Dubost [EDF R&D] , Christophe Chaussin [EDF R&D] , Laurent Dubus [EDF R&D] , Luc Musson-Genon [CEREA, EDF R&D] , Laurent Descamps [Météo France] , Philippe Blanc [Armines] , Gilles Stoltz [CNRS] .
Nowadays, it is standard procedure to generate an ensemble of simulations for a meteorological forecast. Usually, meteorological centers produce a single forecast, out of the ensemble forecasts, computing the ensemble mean (where every model receives an equal weight). It is however possible to apply aggregation methods. When new observations are available, the meteorological centers also compute analyses. Therefore, we can apply the ensemble forecast of analyses. Ensembles of forecasts for mean sea level pressure, from the THORPEX Interactive Grand Global Ensemble, were aggregated with a forecast error decrease by 20% compared to the ensemble mean.
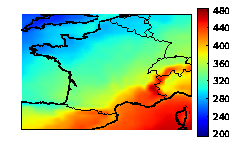
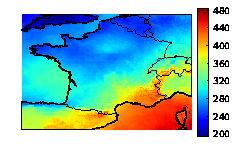
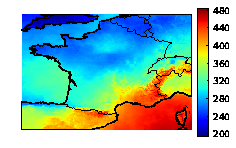
We studied the aggregation of ensembles of solar radiations in the context of photovoltaic production. The observations are based on MeteoSat Second Generation (MSG) and provided by the HelioClim-3 database as gridded fields. The ensembles of forecasts are from the THORPEX Interactive Grand Global Ensemble. The aggregated forecasts show a 20% error decrease compared to the individual forecasts. They are also able to retrieve finer spatial patterns than the ones found in the individual forecasts (see Figure 7 ).
|
Sequential aggregation with uncertainty estimation
Participants : Vivien Mallet, Jean Thorey, Paul Baudin, Gilles Stoltz [CNRS] .
An important issue is the estimation of the uncertainties associated with the aggregated forecasts. We devised a new approach to predict a probability density function or cumulative distribution function instead of a single aggregated forecast. In practice, the aggregation procedure aims at forecasting the cumulative distribution function of the observations which is simply a Heaviside function centered at the observed value. Our forecast is the weighted empirical cumulative distribution function based on the ensemble of forecasts. The method guarantees that, in the long run, the forecast cumulative distribution function has a continuous ranked probability score at least as good as the best weighted empirical cumulative function with weights constant in time.
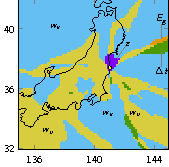
Sensitivity analysis in the dispersion of radionuclides
Participants : Sylvain Girard, Vivien Mallet, Irène Korsakissok [IRSN] .
We carried out a sensitivity analysis of the dispersion of radionuclides during Fukushima disaster. We considered the dispersion at regional scale, with the Eulerian transport model Polair3D from Polyphemus. The sensitivities to most input parameters were computed using the Morris method (with 8 levels and 100 trajectories). The influences of 19 scalar parameters were quantified. The scalar parameters were additive terms or multiplicative factors applied to 1D, 2D or 3D fields such as emission rates, precipitations, cloud height, wind velocity. The sensitivity analysis was carried out with the Morris method and by computing Sobol' indices. Both approaches were found to be consistent. Computing the Sobol' indices required the use of Gaussian process emulation, which proved to be successful at least on targets averaged in time and space.
It was shown that, depending on the output quantities of interest (various aggregated atmospheric and ground dose rates), the sensitivity to the inputs may greatly vary in time and space (see Figure 8 ). Very few parameters show low sensitivity in any case. The vertical diffusion coefficient, the scavenging factors, the winds and precipitation intensity were found to be the most influential inputs. Most input variables related to the source term (emission rates, emission dates) also had a strong influence.