|
|

|

|
| e-Pub |
Section: New Results
A new formulation of the Bayesian Occupancy Filter: a hybrid sampling based framework
Participants : Lukas Rummelhard, Amaury Nègre, Christian Laugier.
The Bayesian Occupancy Filter (BOF) is a discretized grid structure based bayesian algorithm, in which the environment is subdivised in cells to which random variables are linked. These random variables represent the state of occupancy and the motion field of the scene, without any notion of object detection and tracking, making the updating part of the filter an evaluation of the distribution of these variables, according to the new data acquisition. In the classic representation of the BOF, the motion field of each cell is represented as a neighborhood grid, the probability of the cell moving from the current one to another of the neighborhood being stocked in an histogram. If this representation is convenient for the update, since the potential antecedents of any cell is exactly determined by the structure, and so the propagation model is easily parallelizable, it also raises determinant issues :
-
the structure requires the process rate to be constant, and a priori known.
-
in the case of a moving grid, such as an application of car perception, many aliasing problems can appear, not only in the occupation grid, but in the motion fields of cells. A linear interpolation in 4-dimension field to fill each value of the histograms can quickly become unreasonable.
-
to be able to match the slowest moves in the scene and the tiniest objects, the resolution of the grid and the motion histogram must be the high. On the other hand, since the system must be able to evaluate the speed of highly dynamic objects (typically, a moving car), the maximum encoded speed is to be high as well. This results in a necessary huge resolution grid, which prevent the system from being used with satisfying results on an embedded device. This huge grid is also mostly empty (most of the motion field histogram for a occupied cell will be empty). On top of that, the perception system being used to represent the direct environment of a moving car, the encoded velocity is a relative velocity, which implies, if we consider the maximal speed of a car to be , to maintain a motion field able to represent speeds from to . The necessity of such a sized structure is a huge limitation of practical use of the method.
Considering those limitations, a new way to represent the motion field has been developped. To do so, a new formulation of the BOF has been elaborated. This new version allow to introduce in the filter itself a distinction between static and dynamic parts, and so adapt the computation power.
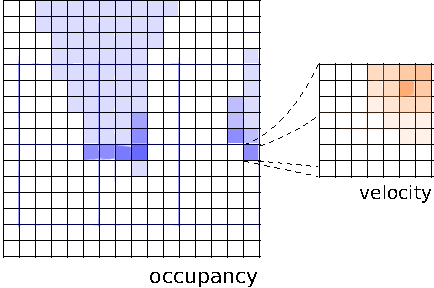
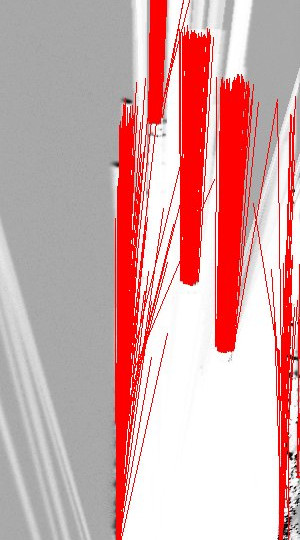
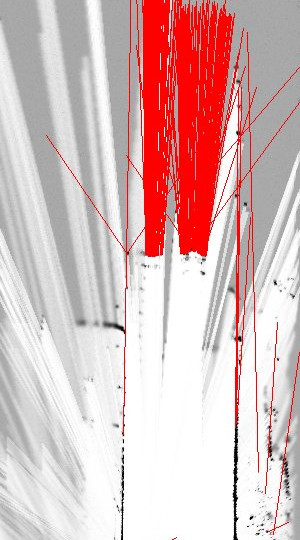
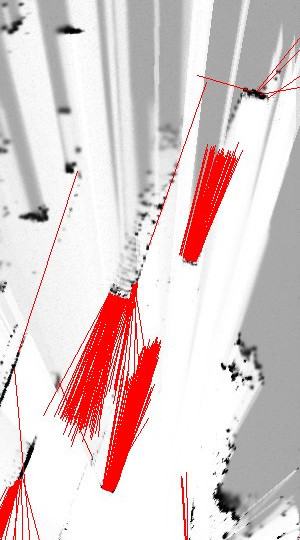
The Hybrid Sampling Bayesian Occupancy Filter (HSBOF) [21] is an evolution of the BOF, in which are introduced additionnal concepts and variables, such as probabilistic classification of the environment between static and dynamic areas, and adaptative motion model structure. The main idea of this new representation is to mix two forms of sampling of the surrounding :
-
a uniform sampling, represented as a dense regular grid, for the static objects and the empty areas. In this part, only the occupancy is stored, as the motion model of the static part of the scene is inherent. In practice, the section of the environment includes the vast majority of the scene.
-
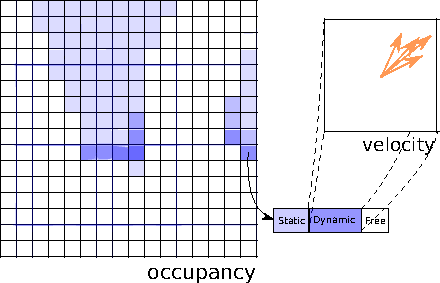
a non uniform sampling, based on particles drawn in dynamic regions, allowing to focus the computational power on the estimation of their motion. The number of particles used to represent the motion of a particular cell is calculated according to various criterions, such as the confidence in the dynamism of the cell, in its estimated motion, the global needs in the scene, etc. Dynamic regions are resampled at every time step, the amount of particles associated to the different parts of the scene is dynamicly calculated.
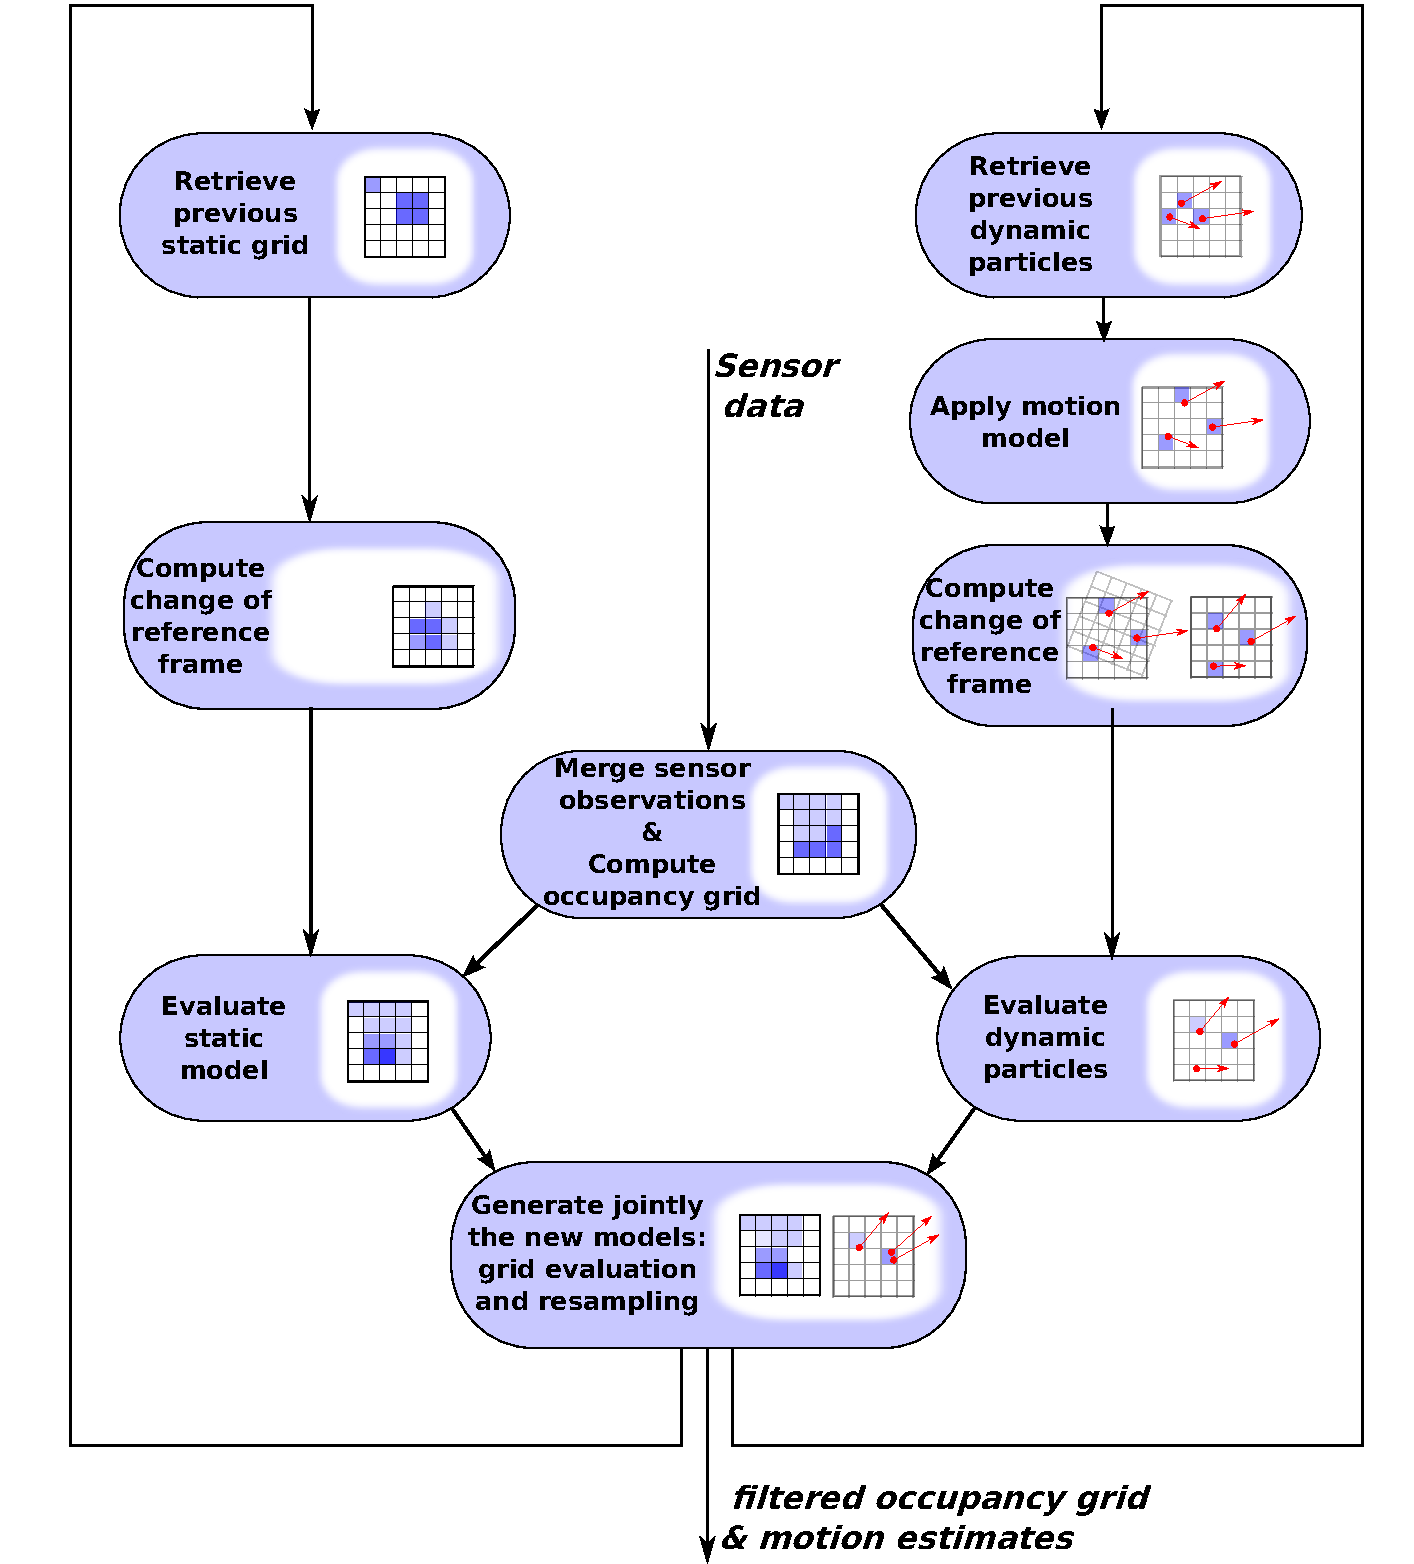
The motion field in a cell is then represented as a set of samples from the distribution for values which are not null, and a weight given to the static hypothesis. The use of a set of samples to represent the motion field leads to a important decrease of the needed memory space, so do the classification between dynamic objects and static objects or free areas. In the updating process, the antecedent of a cell can be either from the static configuration or from the dynamic configuration, which are both way easier to project in the new reference frame of the moving grid: the static part requires a 2-dimension interpolation to be expressed in the new reference frame, the dynamic part a immediate particle association and a simple rotation of the velocity vectors.
This new version HSBOF is now used in the core of our systems in place of the previous version of the BOF. It presents important improvements in the quality of the estimations, while drastically reducing the memory and computation costs (easily by a 100 factor in term of memory).
|
|
|
Probabilistic grid-based collision risk prediction
Participants : Lukas Rummelhard, Amaury Nègre, Mathias Perrollaz, Christian Laugier.
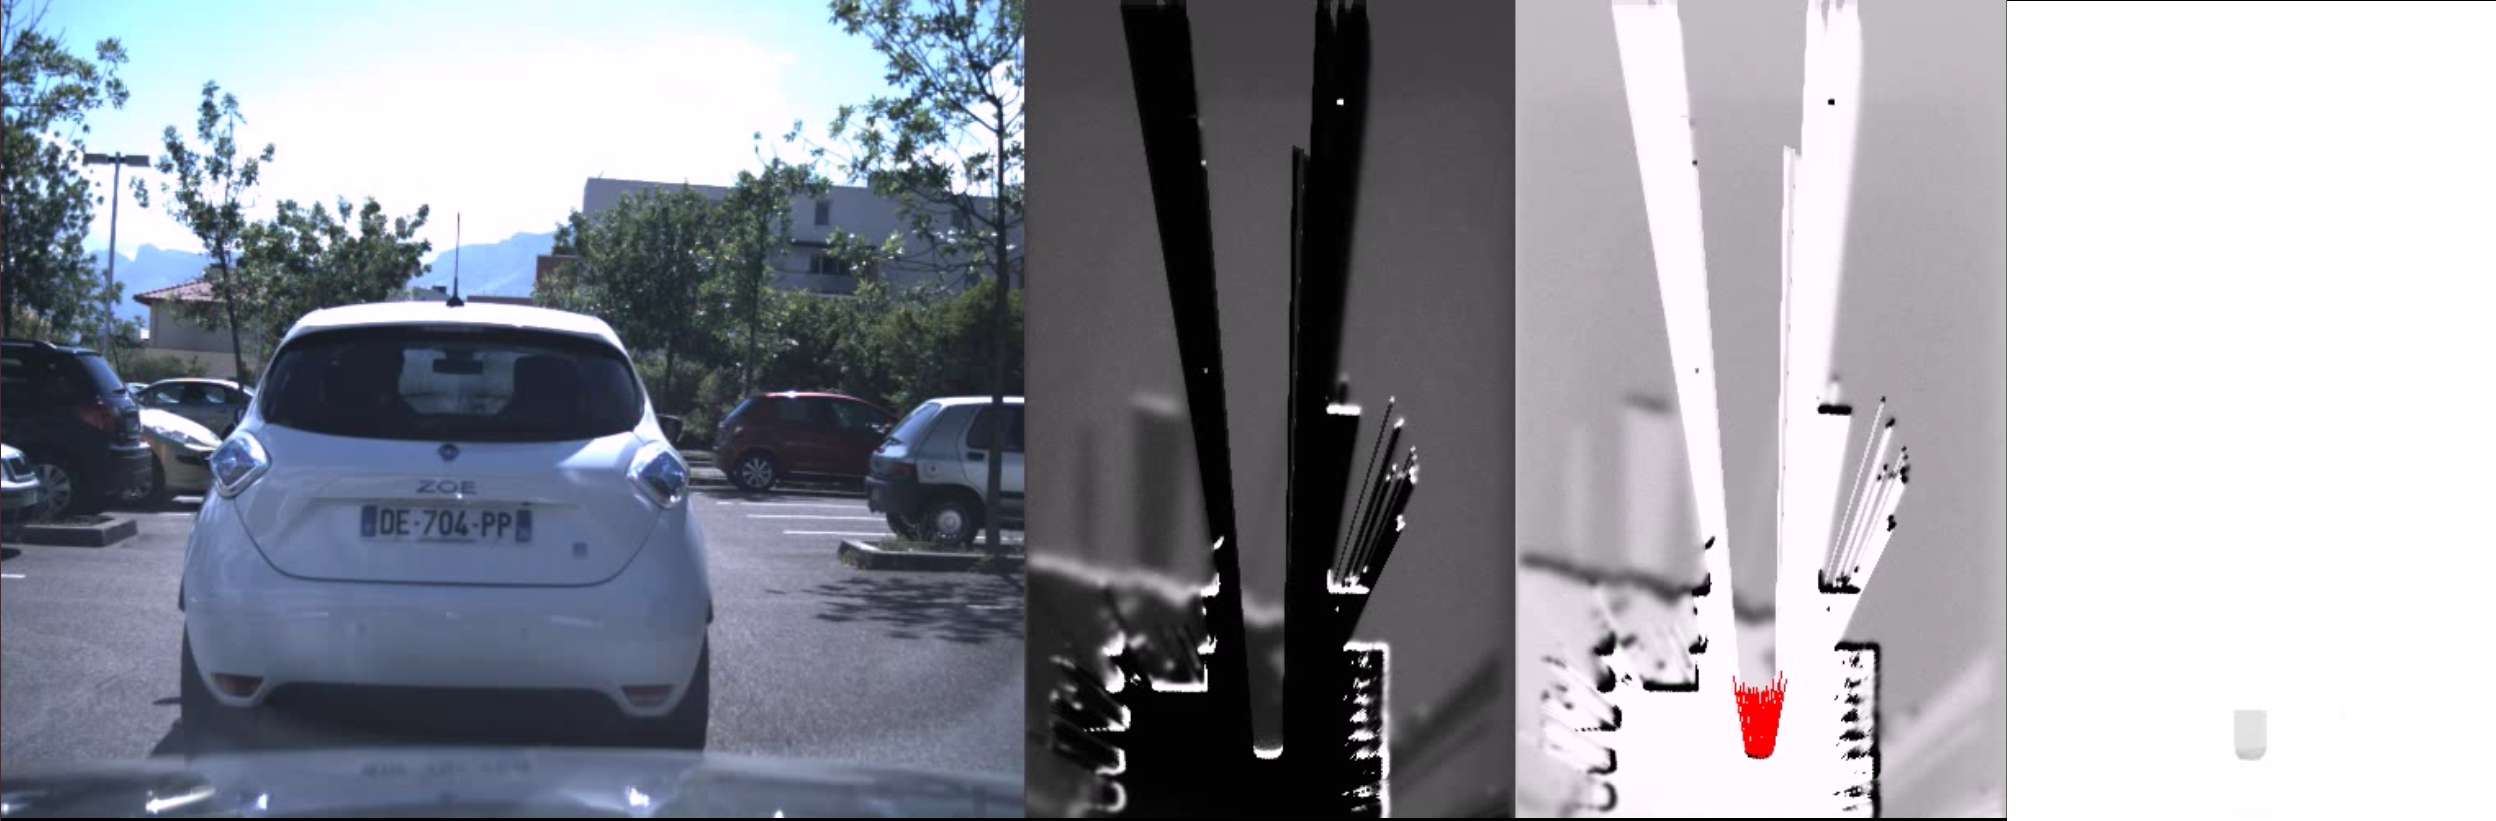
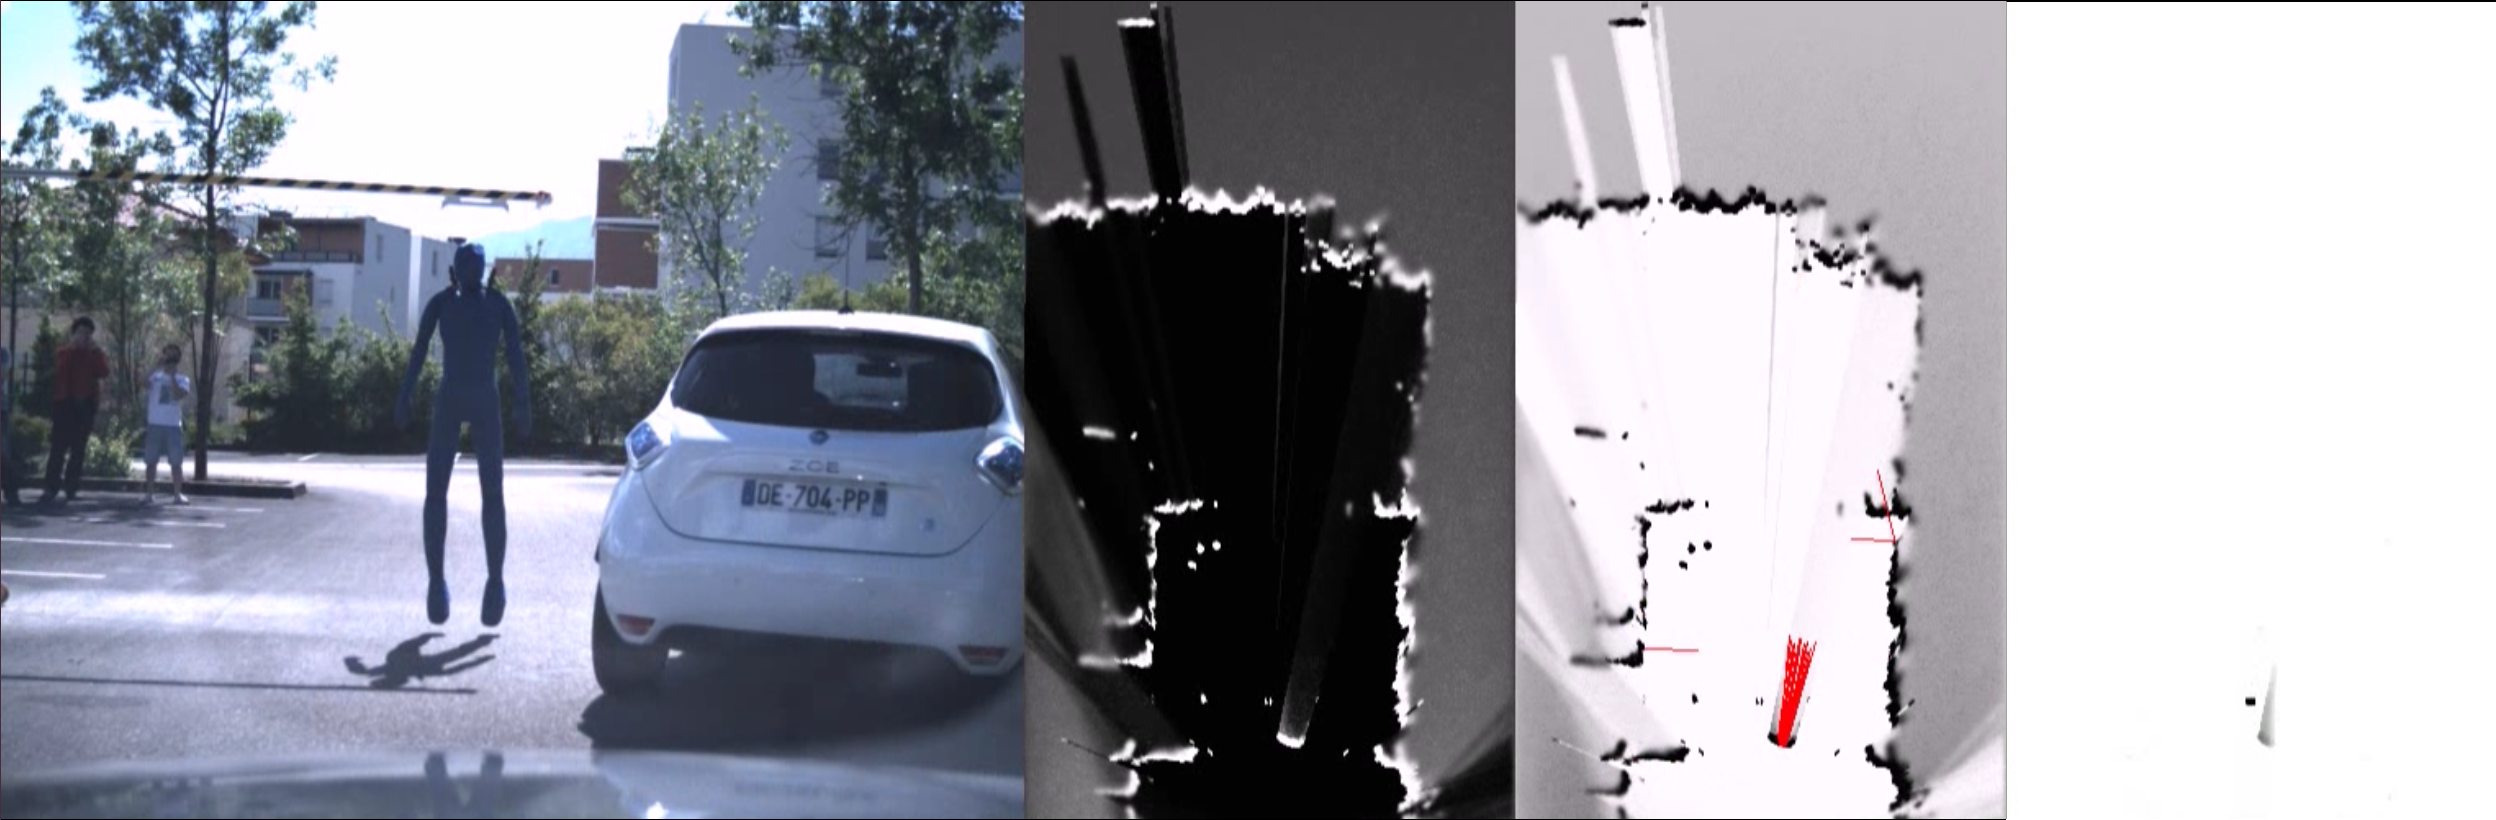
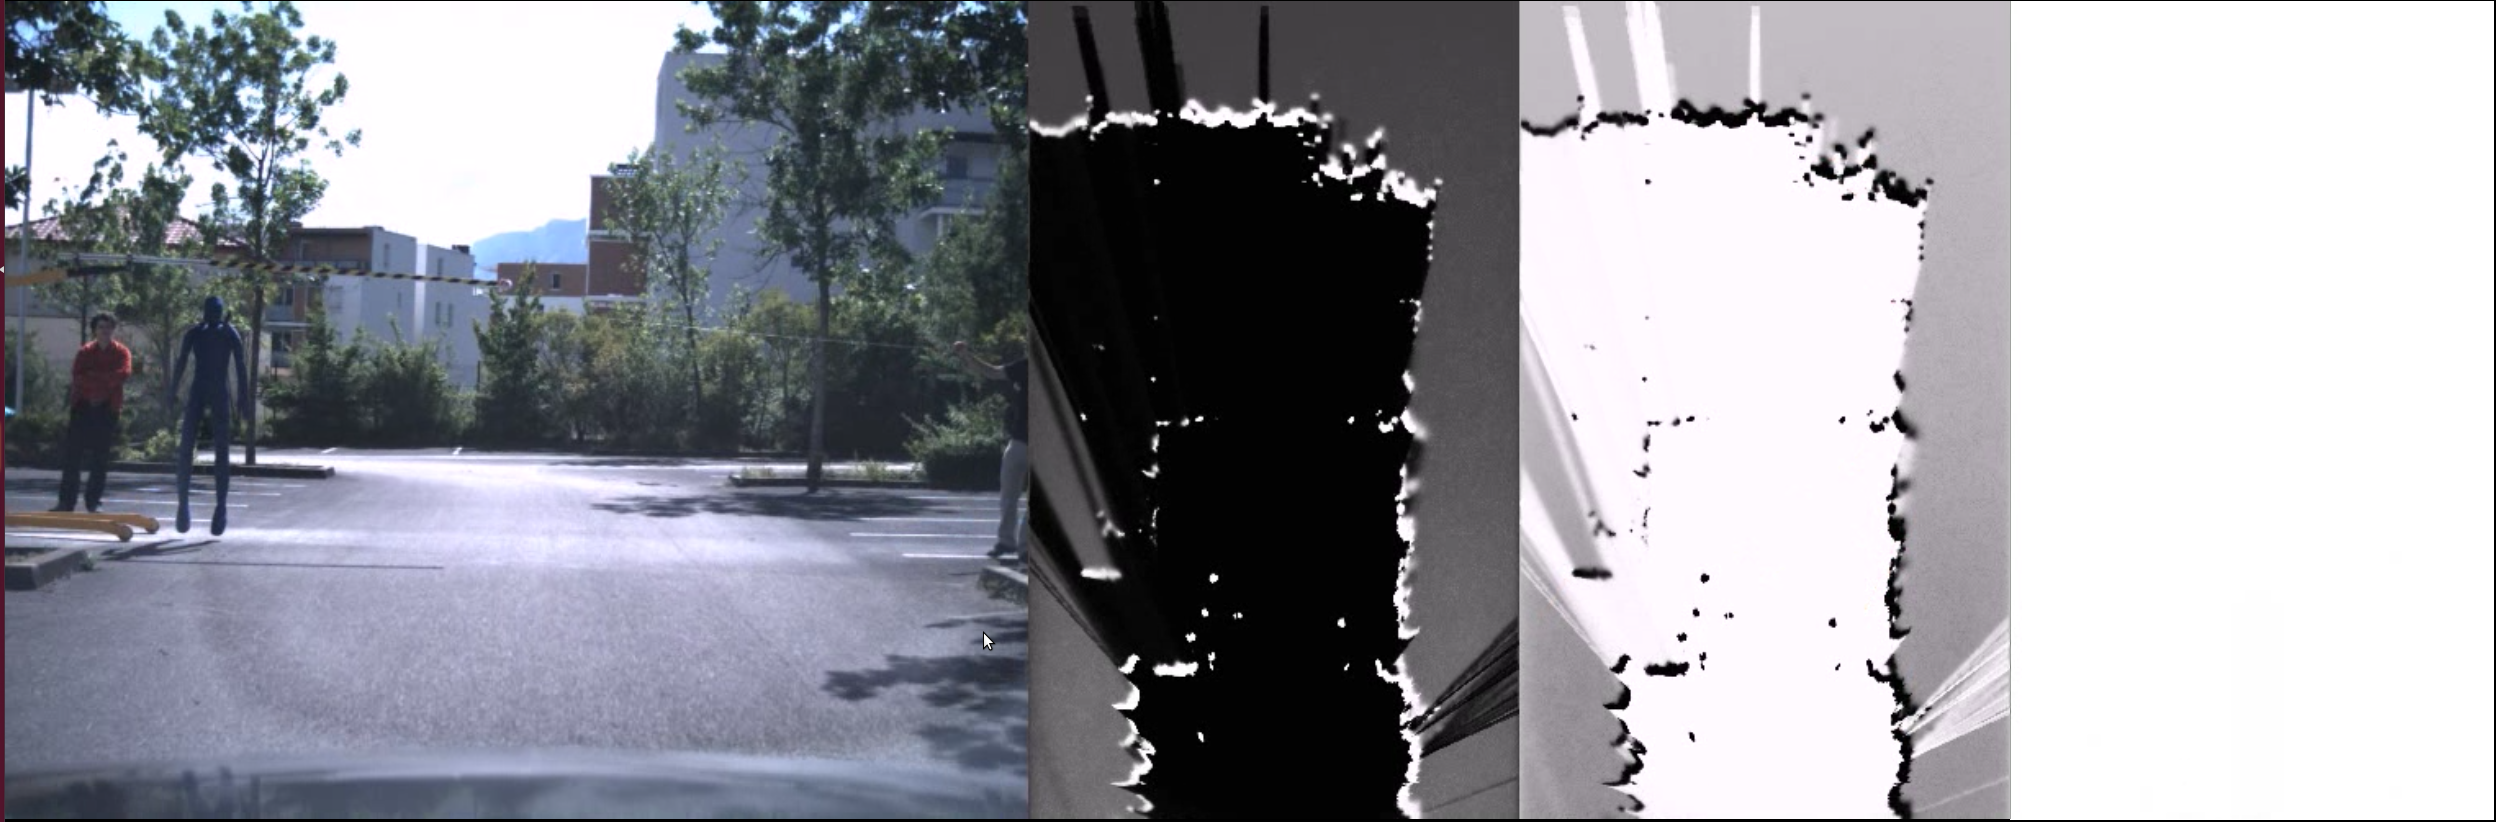
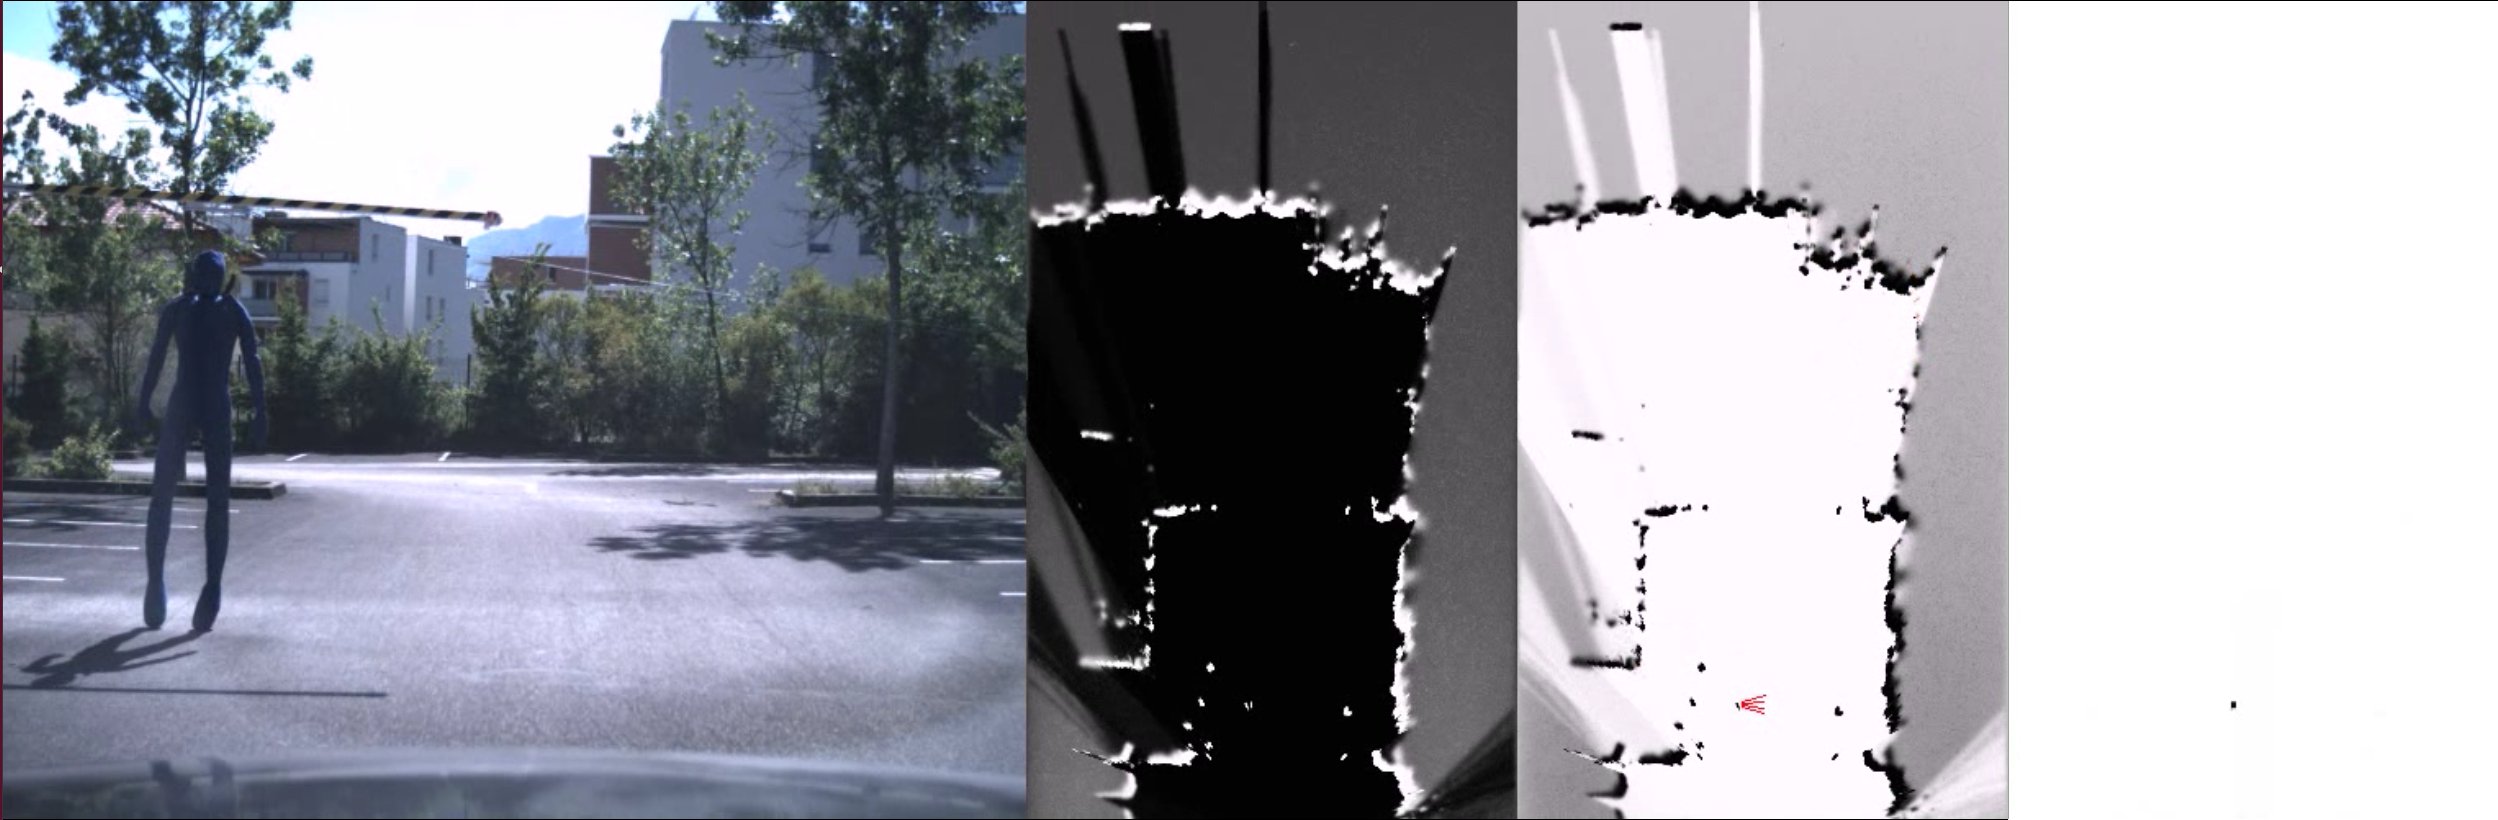
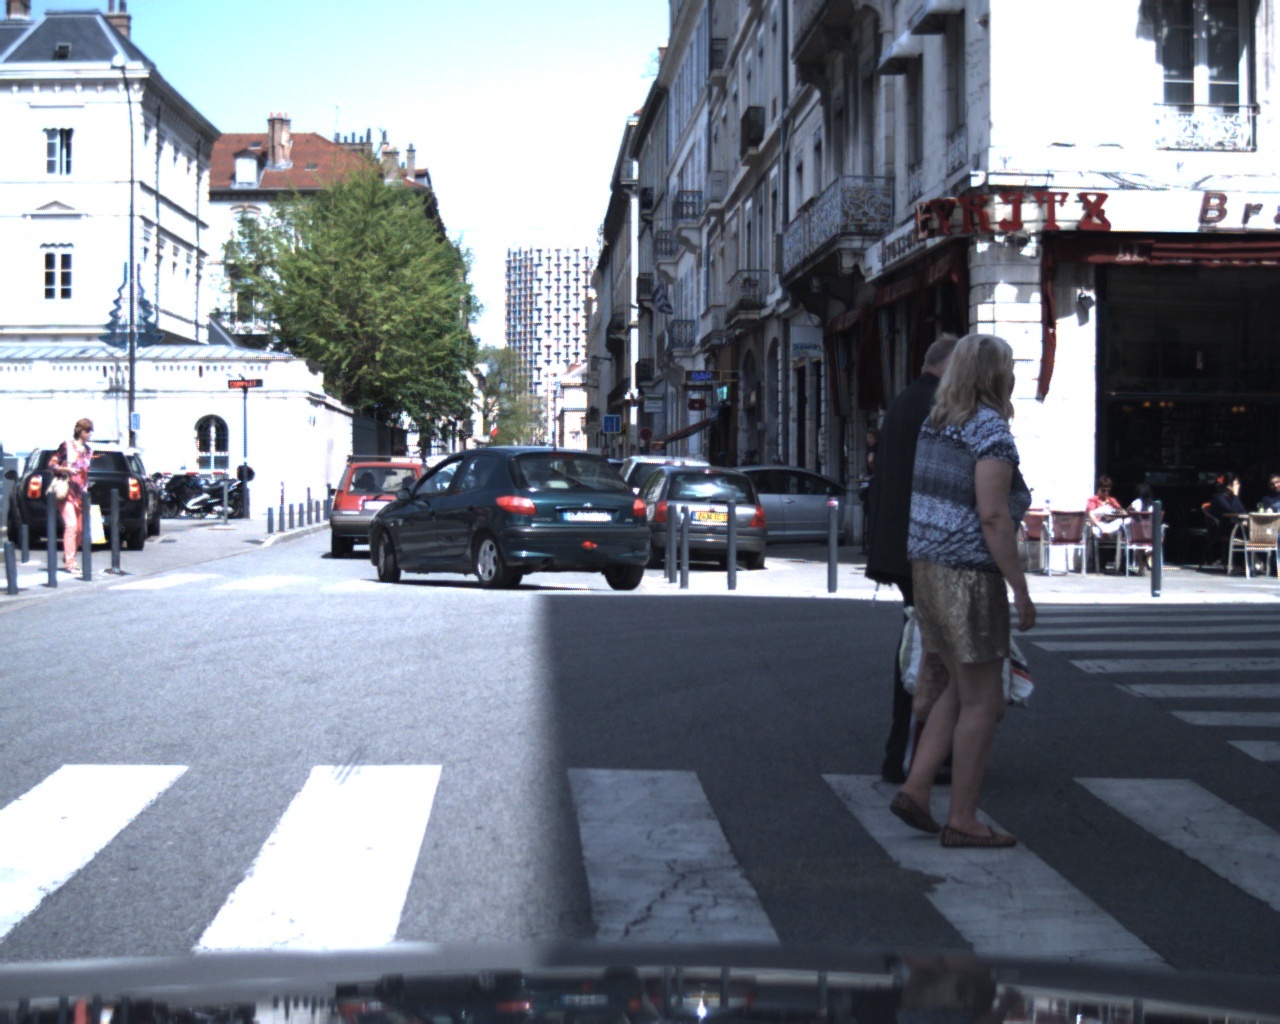
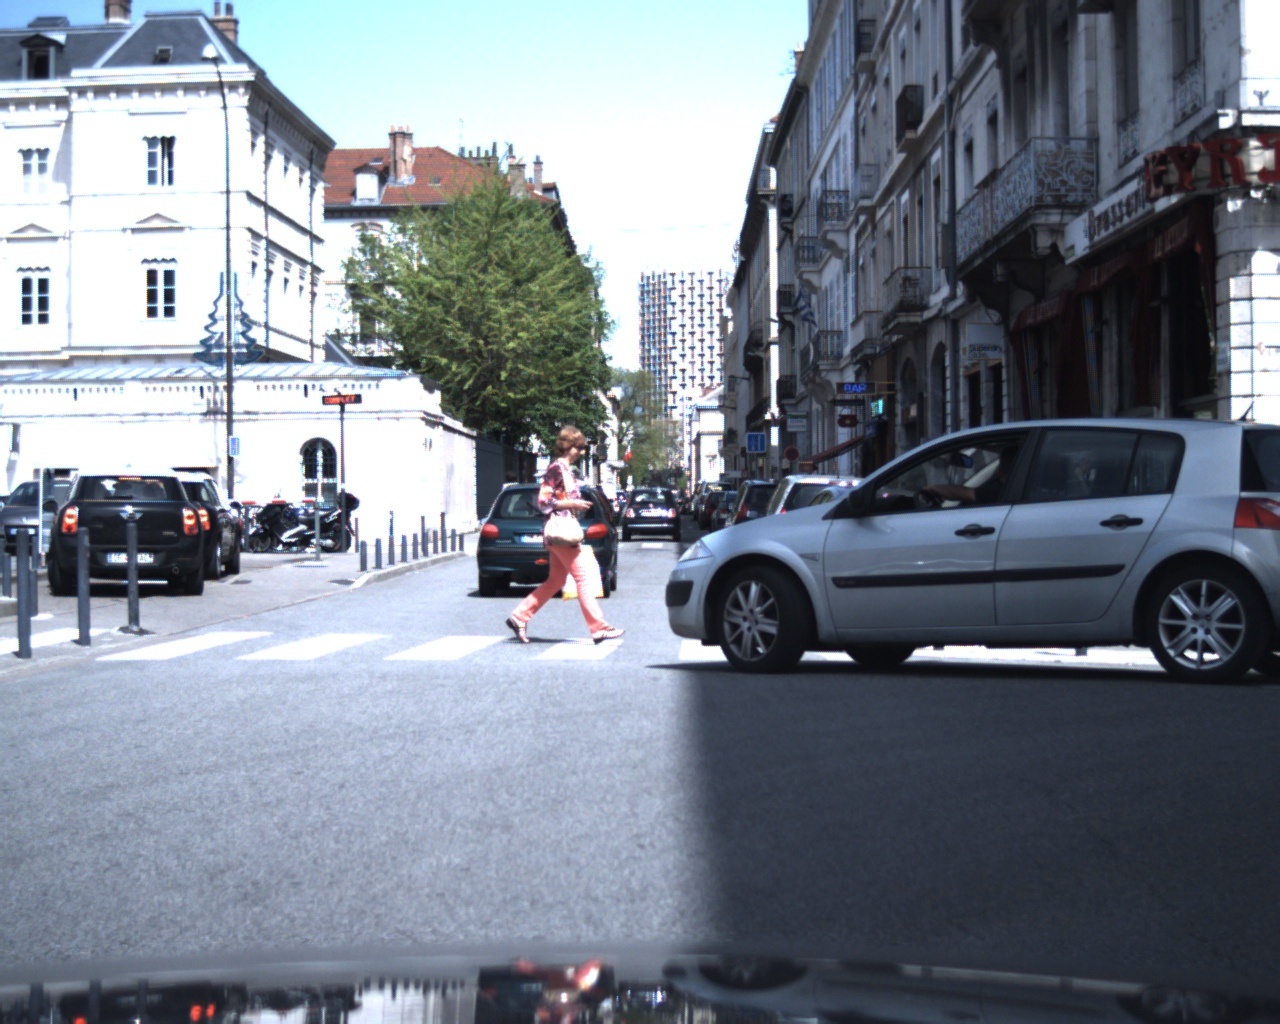
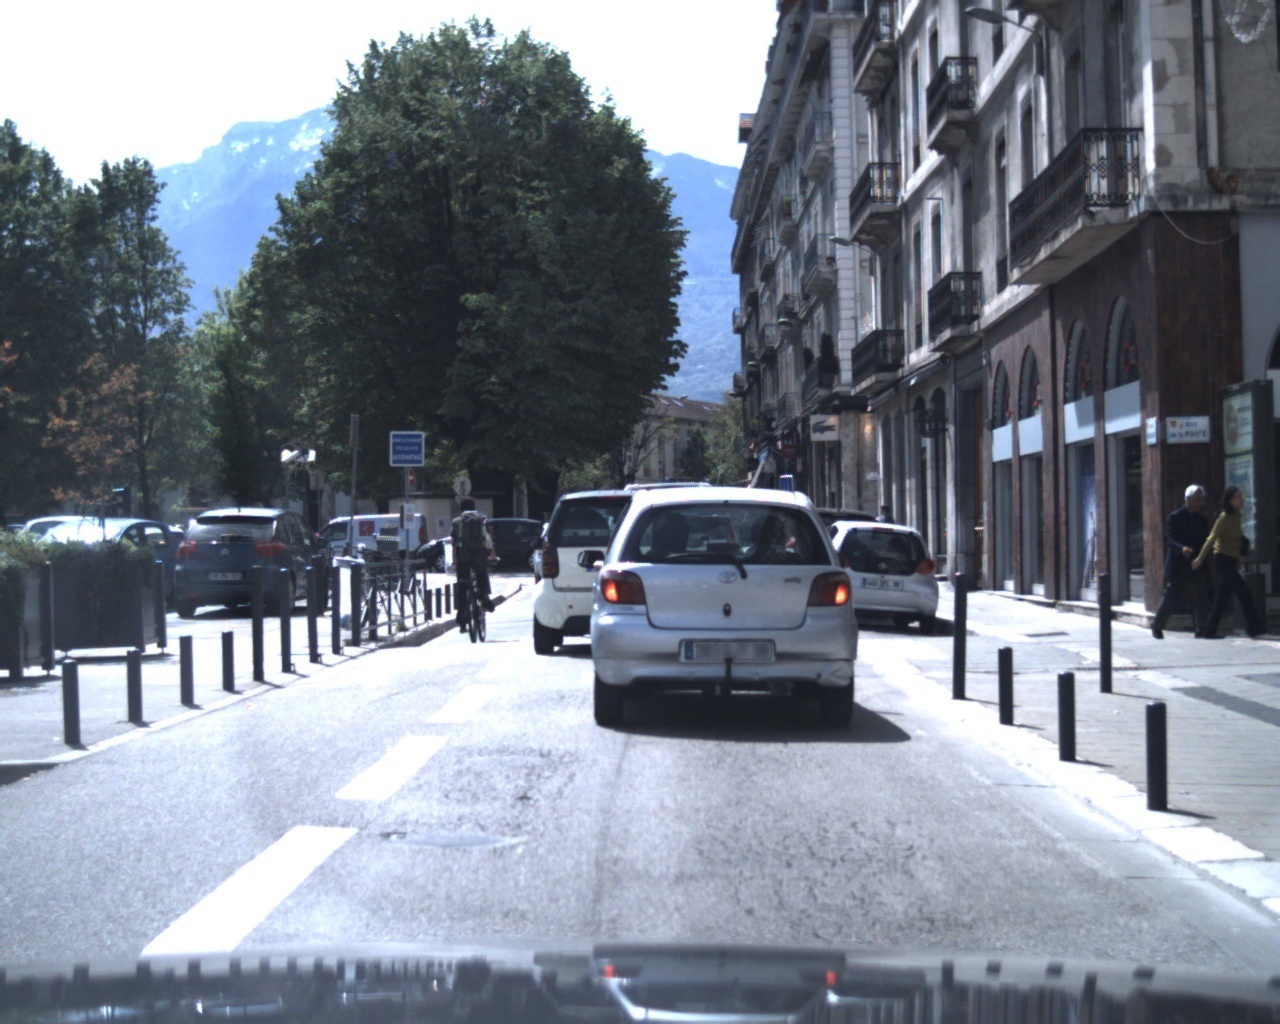
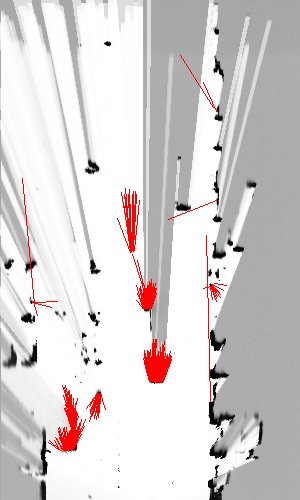
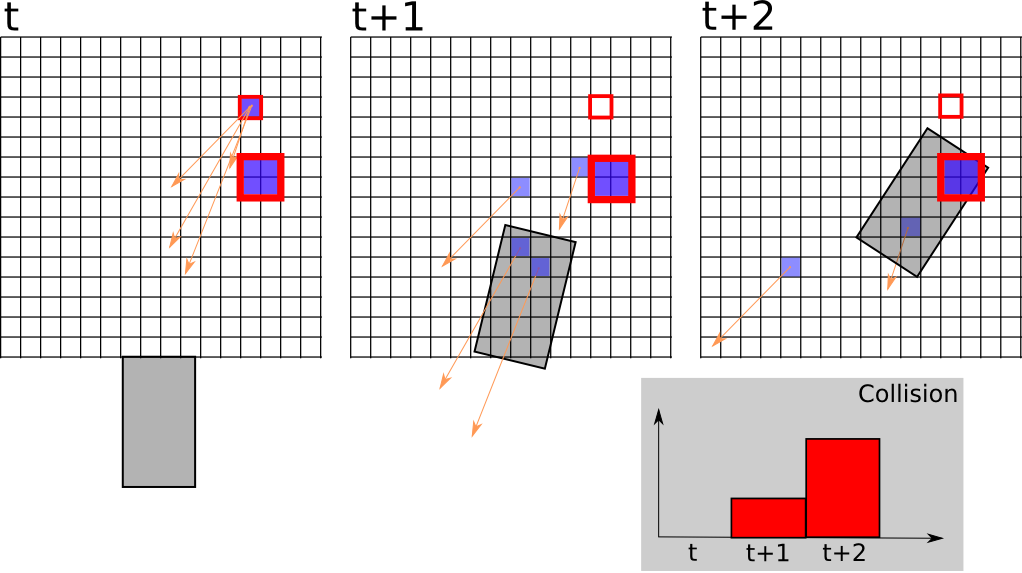
We developped a new grid-based approach for collision risk prediction [23] , based on the Hybrid-Sampling Bayesian Occupancy Filter framework. The idea is to compute an estimation of the Time To Contact (TTC) for each cell of the grid, instead of reasoning on objects. This strategy avoids to solve the difficult problem of multi-objects detection and tracking and provides a probabilistic estimation of the risk associated to each TTC value.
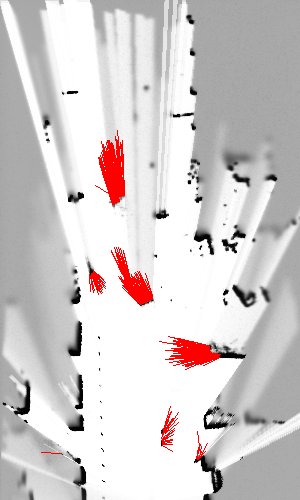
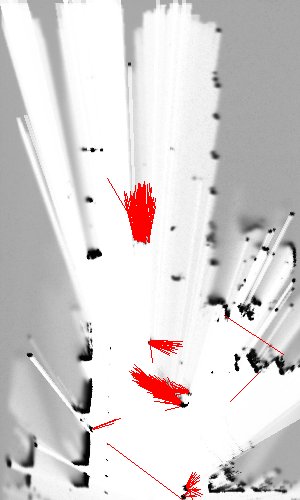
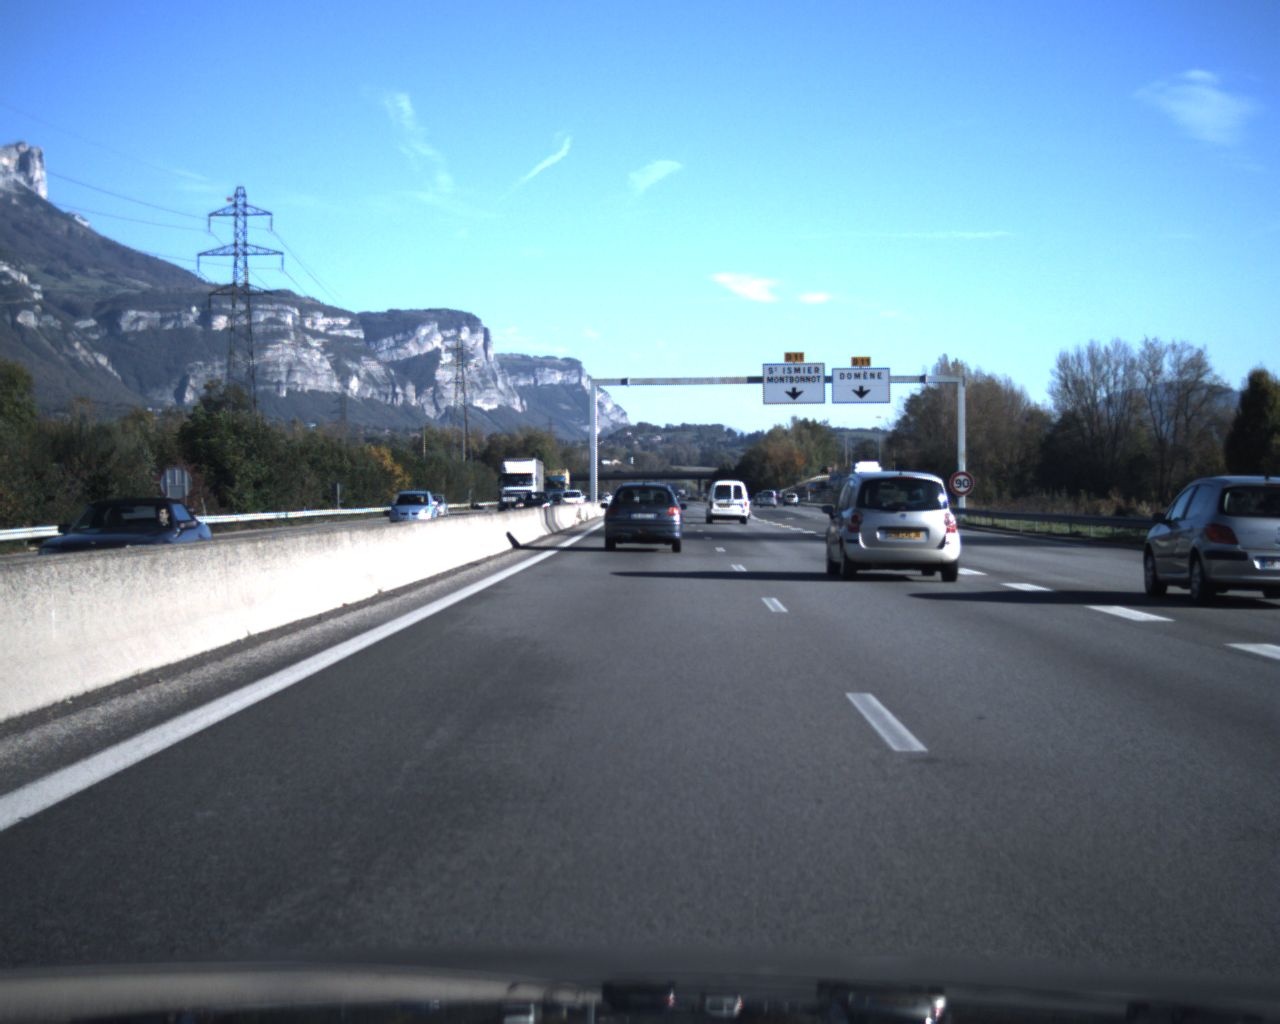
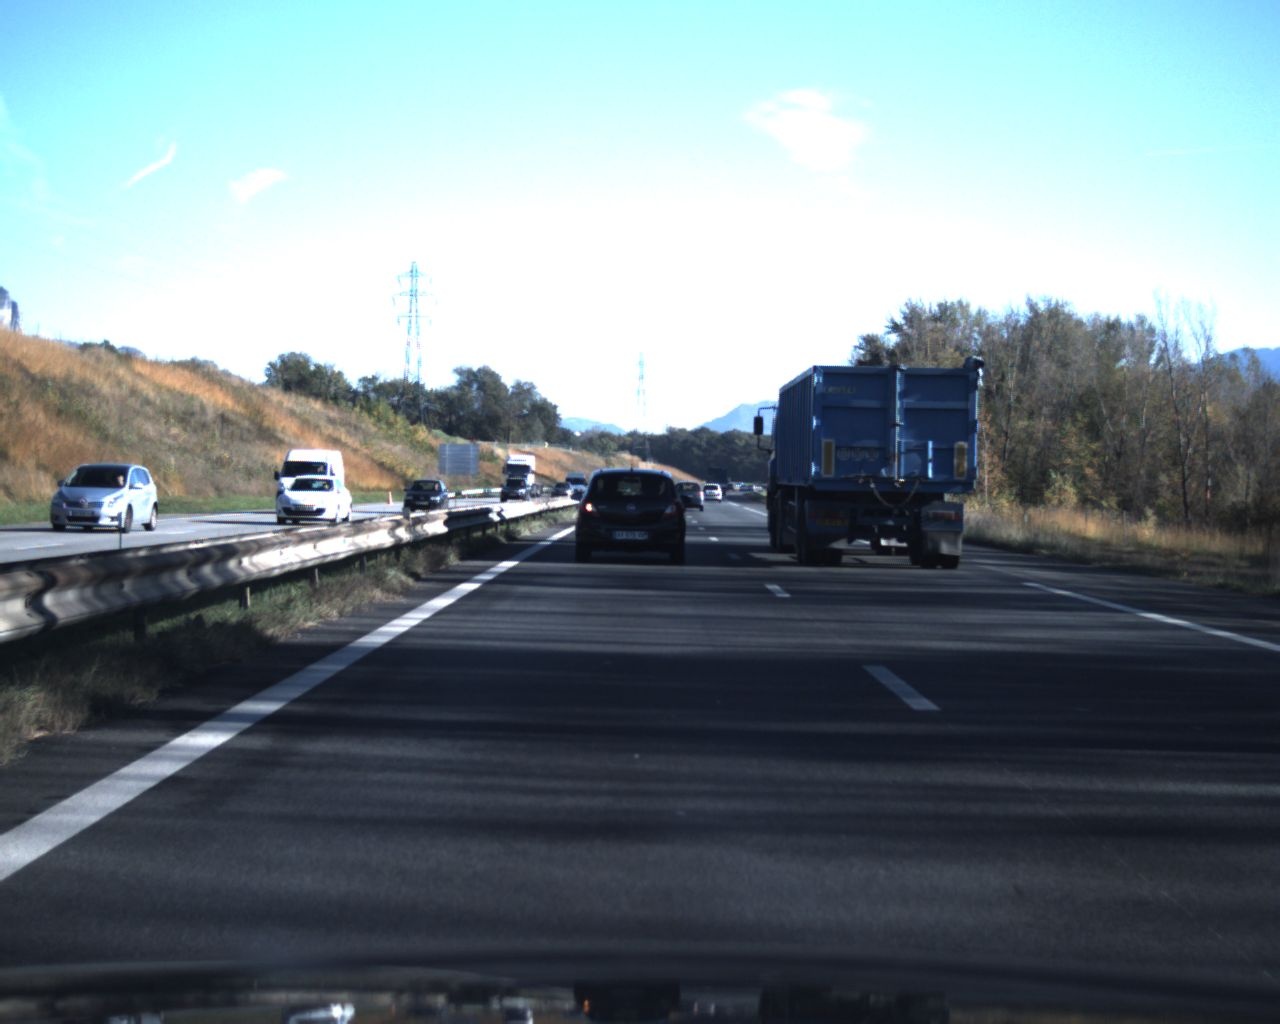
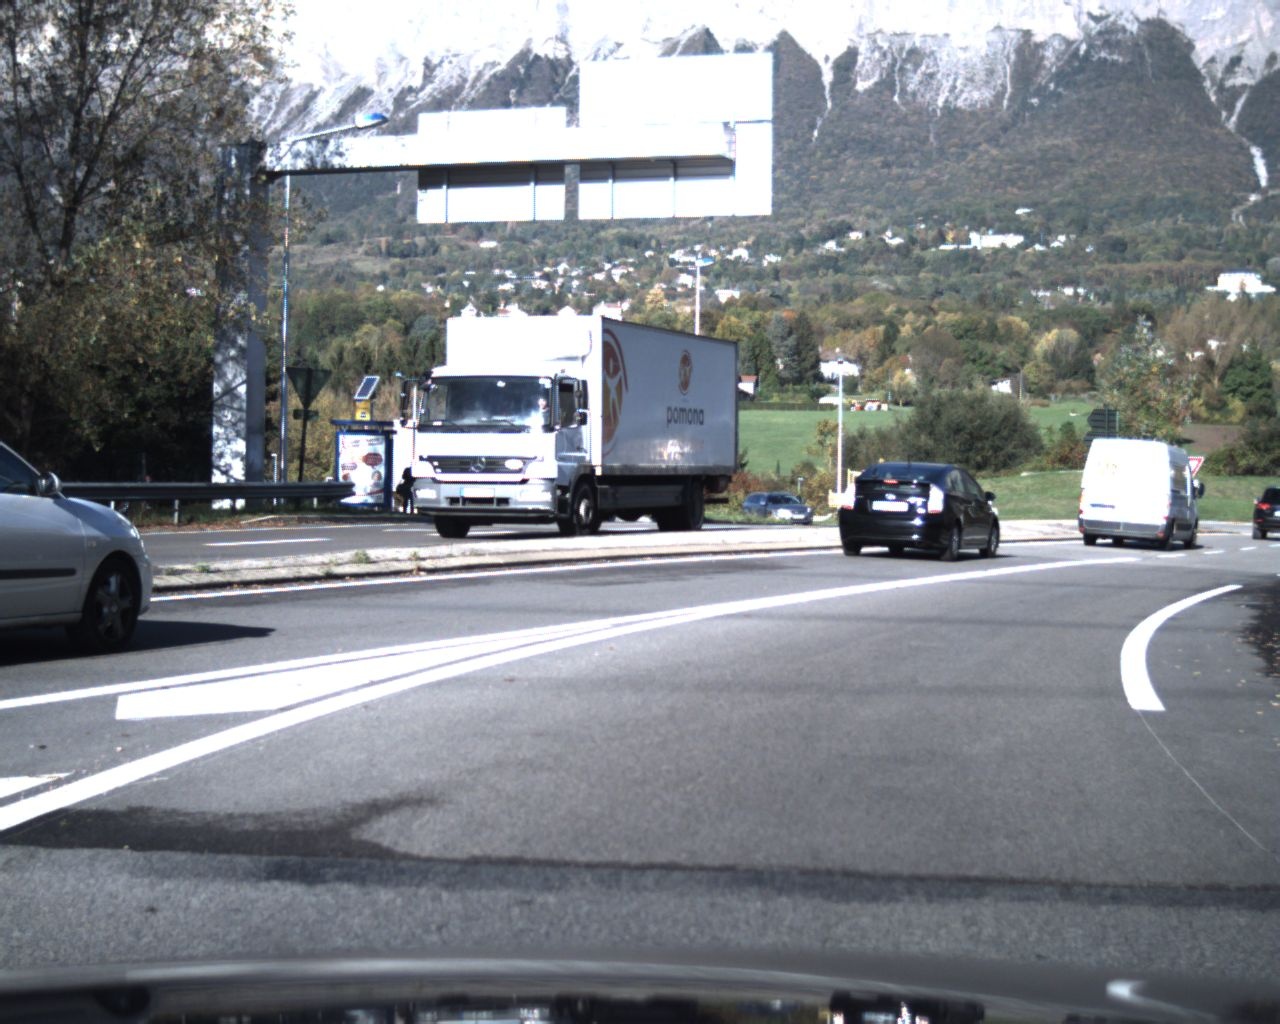
Using motion sensors embedded in the mobile robot (Inertial Measurement Unit, GPS, Wheel speed and steering sensor, visual odometry, etc.), the displacement of the grid between two updates is estimated. The full description of occupancy and dynamics of the scene given by the HSBOF is then used to assess collision risks in the future and even localize them in the grid. The risk evaluation consists in a short-term prediction of the scene configuration (figure 4 and of the robot position. This way a collision likelihood can be computed over time. Using those likelihoods, computed by cell and particle, an estimation of the risk over a period, and a localization of this risk in the grid are performed.
|
|
|