|
|

|

|
| e-Pub |
Section: New Results
Markov Chain for Axon Growth Modeling
Participants : Alejandro Mottini, Xavier Descombes, Florence Besse.
In this work we have defined a 2D discrete stochastic model for the simulation of axonal biogenesis [8] . The model is defined by a third order Markov Chain. The model considers two main processes: the growth process that models the elongation and shape of the neurites and the bifurcation process that models the generation of branches. The growth process depends, among other variables, on the external attraction field generated by a chemoattractant molecule secreted by the target area.
For the validation, we have fluorescently labeled single neurons within intact adult Drosophila fly brains, and have acquired 3D fluorescent confocal microscopy images of their axonal trees. Both normal neurons and neurons in which the function of the imp (mutant type 1) or profilin (mutant type 2) genes was inactivated were imaged. imp encodes a conserved RNA binding protein controlling subcellular mRNA transport and local protein synthesis, and is essential for axonal remodeling. profilin encodes a regulator of the actin cytoskeleton involved in axonal pathfinding. Mutations in these two conserved genes have been linked to neurological pathologies.
Each image stack has a resolution of and two channels. The morphology of single axonal trees is visible in the first channel and was manually segmented by an experienced biologist. The morphology of the overall neuronal structure in which axons are developing is visible in the second channel. In total, 53 images (18 normal, 21 type 1 mutant and 14 type 2 mutant) were used. In order to study the attraction field of the populations, all stacks were registered against the first image of the normal population. This was performed using the second channel of each image.
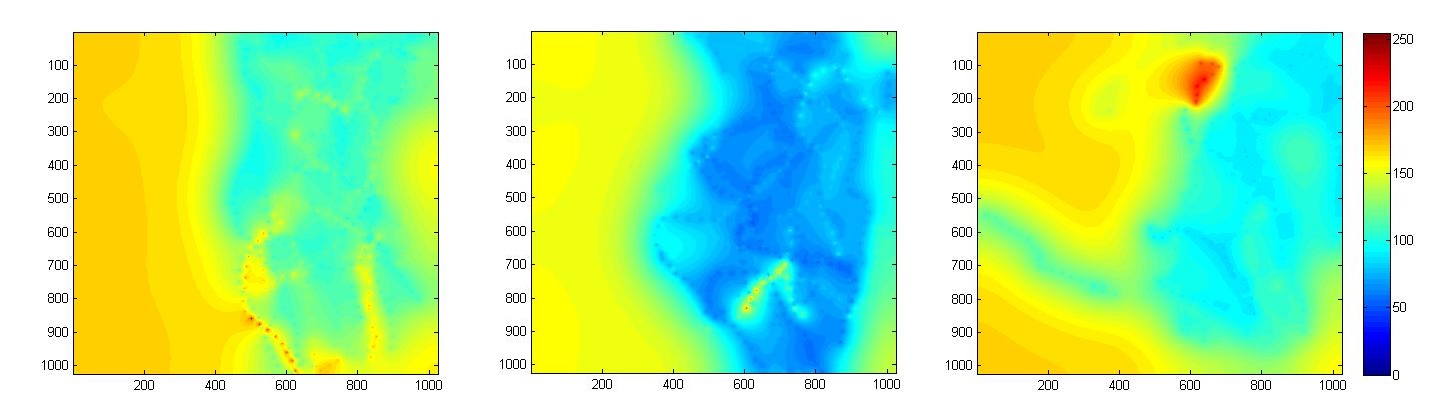
We then have estimated the model parameters to generate two fields for each population, a scalar field that represents the axon flexibility and a vector field that represents the attraction field. Since we obtain some estimates on a sparse set of points in the plane, we extrapolate the fields using a Gaussian Markov Random Field. By qualitatively analyzing the resulting images we have determined that there is no relevant difference on the attraction field between the three populations. We have observed that the field points towards the target area and that its norm is stronger at the starting point of the axons and weaker near the target area, which is consistent with biological expectations. The same procedure was used to analyze the difference on the scalar fields for each population (see Figure 4 ). In this case we can detect a significant difference between the populations.