|
|

|

|
| e-Pub |
Section: New Results
Interplay between functional connectivity and scale-free dynamics in intrinsic fMRI networks
Participant : Philippe Ciuciu [correspondant] .
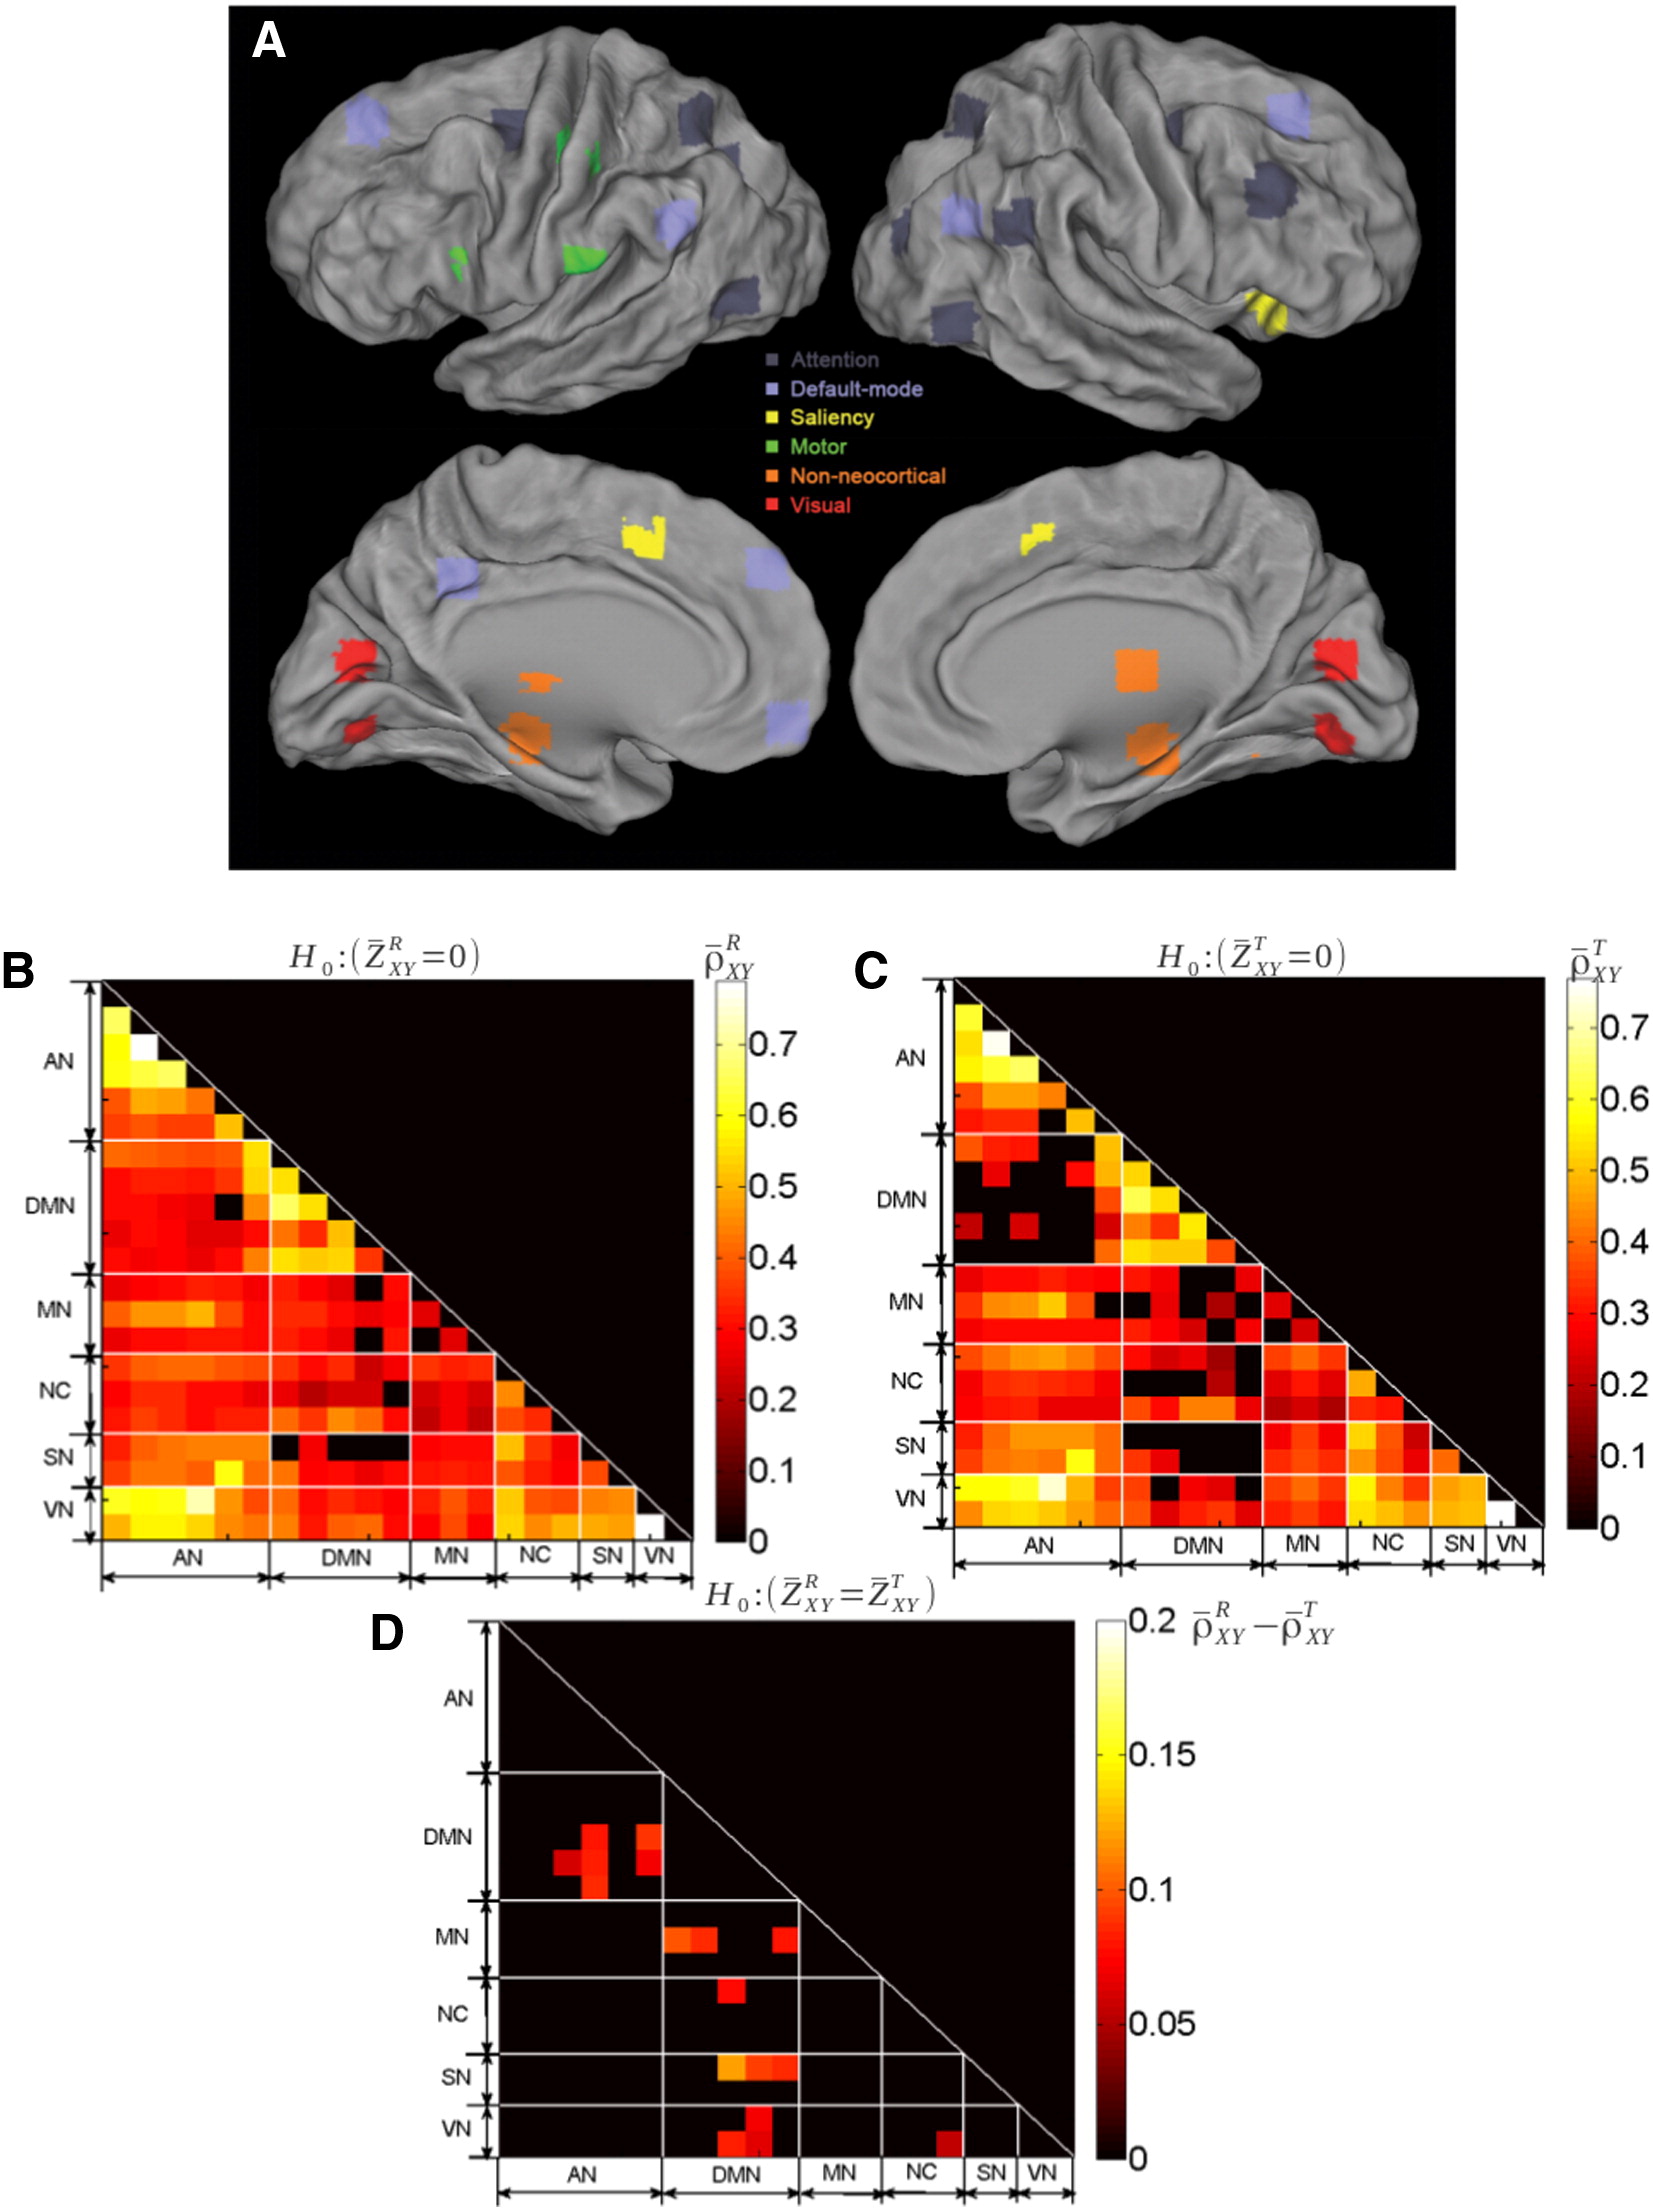
Studies employing functional connectivity-type analyses have established that spontaneous fluctuations in functional magnetic resonance imaging (fMRI) signals are organized within large-scale brain networks. Meanwhile, fMRI signals have been shown to exhibit 1/f-type power spectra – a hallmark of scale-free dynamics. We studied the interplay between functional connectivity and scale-free dynamics in fMRI signals, utilizing the fractal connectivity framework – a multivariate extension of the univariate fractional Gaussian noise model, which relies on a wavelet formulation for robust parameter estimation. We applied this framework to fMRI data acquired from healthy young adults at rest and performing a visual detection task. First, we found that scale-invariance existed beyond univariate dynamics, being present also in bivariate cross-temporal dynamics. Second, we observed that frequencies within the scale-free range do not contribute evenly to inter-regional connectivity, with a systematically stronger contribution of the lowest frequencies, both at rest and during task. Third, in addition to a decrease of the Hurst exponent and inter-regional correlations, task performance modified cross-temporal dynamics, inducing a larger contribution of the highest frequencies within the scale-free range to global correlation.
|
More details can be found in [16] .