|
|

|

|
| e-Pub |
Section: New Results
Walking Speed Detection on a Treadmill using an RGB-D camera : experimentations and results
Participants : Baptiste Fosty, François Brémond.
keywords: RGB-D camera analysis, walking speed, serious games
Within the context of the developement of serious games for people suffering from Alzheimer disease (Az@Game project), we have developed an algorithm to compute the walking speed of a person on a treadmill. The goal is to use this speed inside the game to control the displacement of the avatar, and then for the patient to perform some physical as well as cognitive tasks. For the evaluation of the accuracy of the algorithm, we collected a video data set of healthy people walking on a motorized treadmill.
Protocol. With the help of a specialist in the domain of physical activities, a protocol has been set up to cover the spectrum of the possible walking speeds and to prove the reproducibility of the results. This protocol consists in performing three times ten minutes of walking on the motorized treadmill, each attempt being itself divided in five times two minutes at the following speeds : 1.5 km/h, 2.5 km/h, 3.5 km/h, 4.5 km/h and 5.5 km/h. Participants, mostly people from the age of 18 to 60 without any physical disorder that could influence the gait, were asked to keep a natural gait and to follow the rotation of the treadmill.
Ground truth. The quantitative performances of the walking speed computation are evaluated by comparison with the speed of the walking person. The speed references are twofold :
-
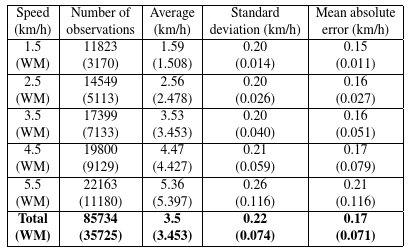
a theoretical value : the speed displayed by the treadmill, set up by the participant but imposed by the protocol (see Figure 12 , red graph),
-
a practical value : white marks have been painted on the treadmill to recompute the real speed of the rotation and so the walking speed (see Figure 12 , green and blue graphs).
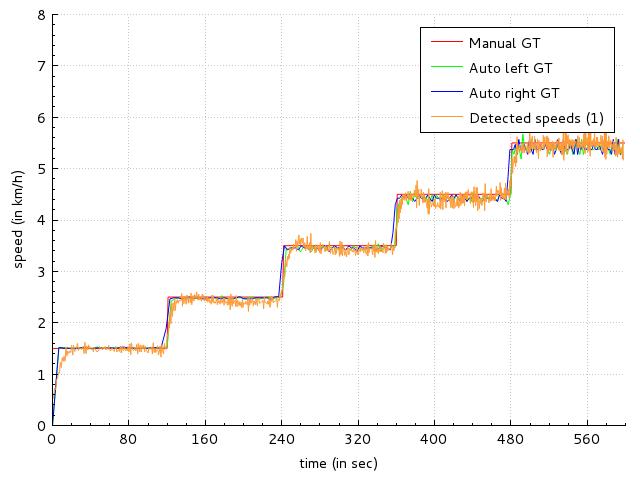
Results. The results presented herein are based on the videos of 36 participants who performed the protocol described above, with 17 males and 19 females, with an average age of 32.17.7 years, an average height of 171.19.1 cm and an average weight of 67.413.6 kg.
|
The table in figure 11 shows the statistical evaluation of the performances of the system. The average column shows that the accuracy of the system is better for the median speeds (around 4.5km/h). When the person is walking slower, the system overestimate the speed due to the wrongly detected steps whereas when faster, there is an underestimation because of missing the exact time when the distance between feet is maximum (framerate too low).
A paper reporting this work is actually under writing process.
|