|
|

|

|
| e-Pub |
Section: New Software and Platforms
autoMRI
Keywords: Magnetic Resonance Imaging (MRI) - functional MRI (fMRI) - Arterial Spin Labeling (ASL) - functional ASL (fASL) - Statistical Parametric Mapping (SPM) - Automation
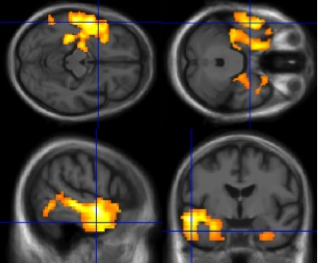
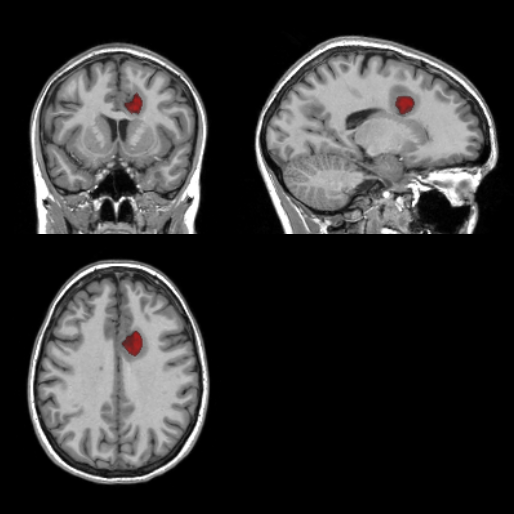
Scientific Description This software is highly configurable in order to fit to a wide range of needs. Pre-processing includes segmentation of anatomical data, as well as co-registration, spatial normalization and atlas building of all data types. The analysis pipelines perform either within-group analysis or between-group or one subject-versus-group comparison and produce statistical maps of regions with significant differences. These pipelines can be applied to structural data to exhibit patterns of atrophy or lesions, to ASL (both pulsed or pseudo-continuous sequences) or PET data to detect perfusion or metabolic abnormalities (see figure 3 , left), to relaxometry data to detect deviations from a template (see figure 3 , right), to functional data - either BOLD or ASL - to outline brain activations related to block or event-related paradigms. In addition to the standard General Linear Model approach, the ASL pipelines implement an a contrario approach and, for patient-specific perfusion study, an heteroscedastic variance model. Besides, the vascular pipeline processes 4D MRA data and enables accurate assessment of hemodynamic patterns.
Functional Description Based on MATLAB and the SPM8 toolbox, autoMRI provides complete pipelines to pre-process and analyze various types of images (anatomical, functional, perfusion, metabolic, relaxometry, vascular). A new version of the ASL post-processing part was developed in Python and Nipype, therefore not requiring the disponibility of Matlab licences.