<?xml version="1.0" encoding="utf-8"?>
<!DOCTYPE html PUBLIC "-//W3C//DTD XHTML 1.1 plus MathML 2.0 plus SVG 1.1//EN" "http://www.w3.org/2002/04/xhtml-math-svg/xhtml-math-svg.dtd">
<html xmlns="http://www.w3.org/1999/xhtml">
  <head>
    <meta http-equiv="Content-Type" content="application/xhtml+xml; charset=utf-8"/>
    <title>Project-Team:IBIS</title>
    <link rel="stylesheet" href="../static/css/raweb.css" type="text/css"/>
    <meta name="description" content="Research Program - Inference of gene regulatory networks from time-series data"/>
    <meta name="dc.title" content="Research Program - Inference of gene regulatory networks from time-series data"/>
    <meta name="dc.creator" content="Eugenio Cinquemani"/>
    <meta name="dc.creator" content="Johannes Geiselmann"/>
    <meta name="dc.creator" content="Hidde de Jong"/>
    <meta name="dc.creator" content="Cyril Dutrieux"/>
    <meta name="dc.creator" content="Stephan Lacour"/>
    <meta name="dc.creator" content="Yannick Martin"/>
    <meta name="dc.creator" content="Michel Page"/>
    <meta name="dc.creator" content="Corinne Pinel"/>
    <meta name="dc.creator" content="Delphine Ropers"/>
    <meta name="dc.subject" content=""/>
    <meta name="dc.publisher" content="INRIA"/>
    <meta name="dc.date" content="(SCHEME=ISO8601) 2016-01"/>
    <meta name="dc.type" content="Report"/>
    <meta name="dc.language" content="(SCHEME=ISO639-1) en"/>
    <meta name="projet" content="IBIS"/>
    <script type="text/javascript" src="https://raweb.inria.fr/rapportsactivite/RA2016/static/MathJax/MathJax.js?config=TeX-MML-AM_CHTML">
      <!--MathJax-->
    </script>
  </head>
  <body>
    <div class="tdmdiv">
      <div class="logo">
        <a href="http://www.inria.fr">
          <img style="align:bottom; border:none" src="../static/img/icons/logo_INRIA-coul.jpg" alt="Inria"/>
        </a>
      </div>
      <div class="TdmEntry">
        <div class="tdmentete">
          <a href="uid0.html">Project-Team Ibis</a>
        </div>
        <span>
          <a href="uid1.html">Members</a>
        </span>
      </div>
      <div class="TdmEntry">Overall Objectives<ul><li><a href="./uid3.html">Overview</a></li></ul></div>
      <div class="TdmEntry">Research Program<ul><li><a href="uid8.html&#10;&#9;&#9;  ">Analysis of qualitative dynamics of gene regulatory networks</a></li><li class="tdmActPage"><a href="uid10.html&#10;&#9;&#9;  ">Inference of gene regulatory networks from time-series data</a></li><li><a href="uid12.html&#10;&#9;&#9;  ">Analysis of integrated metabolic and gene regulatory networks</a></li><li><a href="uid14.html&#10;&#9;&#9;  ">Natural and engineered control of growth and gene expression</a></li></ul></div>
      <div class="TdmEntry">
        <a href="./uid17.html">Highlights of the Year</a>
      </div>
      <div class="TdmEntry">New Software and Platforms<ul><li><a href="uid19.html&#10;&#9;&#9;  ">Genetic Network Analyzer (GNA)</a></li><li><a href="uid24.html&#10;&#9;&#9;  ">WellFARE</a></li><li><a href="uid29.html&#10;&#9;&#9;  ">WellInverter</a></li><li><a href="uid34.html&#10;&#9;&#9;  ">WellReader</a></li></ul></div>
      <div class="TdmEntry">New Results<ul><li><a href="uid40.html&#10;&#9;&#9;  ">Qualitative modeling of gene regulatory networks in food-borne pathogens</a></li><li><a href="uid41.html&#10;&#9;&#9;  ">Analysis of fluorescent reporter gene data</a></li><li><a href="uid42.html&#10;&#9;&#9;  ">Models of carbon metabolism in bacteria</a></li><li><a href="uid43.html&#10;&#9;&#9;  ">Stochastic modeling and identification of gene regulatory networks in bacteria</a></li><li><a href="uid44.html&#10;&#9;&#9;  ">Growth control in bacteria and biotechnological applications</a></li></ul></div>
      <div class="TdmEntry">Bilateral Contracts and Grants with Industry<ul><li><a href="uid46.html&#10;&#9;&#9;  ">BGene</a></li><li><a href="uid47.html&#10;&#9;&#9;  ">Genostar</a></li></ul></div>
      <div class="TdmEntry">Partnerships and Cooperations<ul><li><a href="uid49.html&#10;&#9;&#9;  ">Regional Initiatives</a></li><li><a href="uid50.html&#10;&#9;&#9;  ">National Initiatives</a></li><li><a href="uid51.html&#10;&#9;&#9;  ">European Initiatives</a></li><li><a href="uid59.html&#10;&#9;&#9;  ">International Research Visitors</a></li></ul></div>
      <div class="TdmEntry">Dissemination<ul><li><a href="uid62.html&#10;&#9;&#9;  ">Research</a></li><li><a href="uid74.html&#10;&#9;&#9;  ">Teaching - Supervision - Committees</a></li><li><a href="uid96.html&#10;&#9;&#9;  ">Science education</a></li></ul></div>
      <div class="TdmEntry">
        <div>Bibliography</div>
      </div>
      <div class="TdmEntry">
        <ul>
          <li>
            <a id="tdmbibentmajor" href="bibliography.html">Major publications</a>
          </li>
          <li>
            <a id="tdmbibentyear" href="bibliography.html#year">Publications of the year</a>
          </li>
        </ul>
      </div>
    </div>
    <div id="main">
      <div class="mainentete">
        <div id="head_agauche">
          <small><a href="http://www.inria.fr">
	    
	    Inria
	  </a> | <a href="../index.html">
	    
	    Raweb 
	    2016</a> | <a href="http://www.inria.fr/en/teams/ibis">Presentation of the Project-Team IBIS</a> | <a href="https://team.inria.fr/ibis">IBIS Web Site
	  </a></small>
        </div>
        <div id="head_adroite">
          <table class="qrcode">
            <tr>
              <td>
                <a href="ibis.xml">
                  <img style="align:bottom; border:none" alt="XML" src="../static/img/icons/xml_motif.png"/>
                </a>
              </td>
              <td>
                <a href="ibis.pdf">
                  <img style="align:bottom; border:none" alt="PDF" src="IMG/qrcode-ibis-pdf.png"/>
                </a>
              </td>
              <td>
                <a href="../ibis/ibis.epub">
                  <img style="align:bottom; border:none" alt="e-pub" src="IMG/qrcode-ibis-epub.png"/>
                </a>
              </td>
            </tr>
            <tr>
              <td/>
              <td>PDF
</td>
              <td>e-Pub
</td>
            </tr>
          </table>
        </div>
      </div>
      <!--FIN du corps du module-->
      <br/>
      <div class="bottomNavigation">
        <div class="tail_aucentre">
          <a href="./uid8.html" accesskey="P"><img style="align:bottom; border:none" alt="previous" src="../static/img/icons/previous_motif.jpg"/> Previous | </a>
          <a href="./uid0.html" accesskey="U"><img style="align:bottom; border:none" alt="up" src="../static/img/icons/up_motif.jpg"/>  Home</a>
          <a href="./uid12.html" accesskey="N"> | Next <img style="align:bottom; border:none" alt="next" src="../static/img/icons/next_motif.jpg"/></a>
        </div>
        <br/>
      </div>
      <div id="textepage">
        <!--DEBUT2 du corps du module-->
        <h2>Section: 
      Research Program</h2>
        <h3 class="titre3">Inference of gene regulatory networks from time-series data</h3>
        <p class="participants"><span class="part">Participants</span> :
	Eugenio Cinquemani [Correspondent] , Johannes Geiselmann, Hidde de Jong, Cyril Dutrieux, Stephan Lacour, Yannick Martin, Michel Page, Corinne Pinel, Delphine Ropers.</p>
        <p>Measurements of the transcriptome of a bacterial cell by means of DNA microarrays, RNA sequencing, and other technologies have yielded huge amounts of data on the state of the transcriptional program in different growth conditions and genetic backgrounds, across different time-points in an experiment. The information on the time-varying state of the cell thus obtained has fueled the development of methods for inferring regulatory interactions between genes. In essence, these methods try to explain the observed variation in the activity of one gene in terms of the variation in activity of other genes. A large number of inference methods have been proposed in the literature and have been successful in a variety of applications, although a number of difficult problems remain.</p>
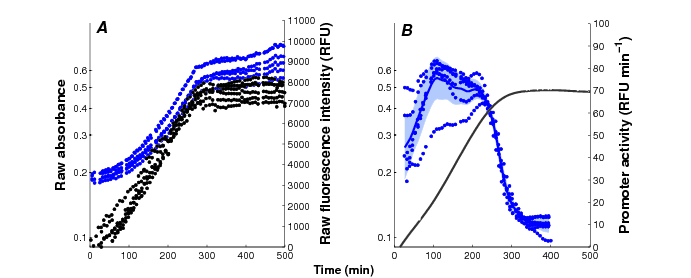
        <p>Current reporter gene technologies, based on Green Fluorescent Proteins (GFPs) and other fluorescent and luminescent reporter proteins, provide an excellent means to measure the activity of a gene <i>in vivo</i> and in real time (Figure <a title="Inference of gene regulatory networks from time-series data" href="./uid10.html#uid11">3</a>). The underlying principle of the technology is to fuse the promoter region and possibly (part of) the coding region of a gene of interest to a reporter gene. The expression of the reporter gene generates a visible signal (fluorescence or luminescence) that is easy to capture and reflects the expression of a gene of interest. The interest of the reporter systems is further enhanced when they are applied in mutant strains or combined with expression vectors that allow the controlled induction of any particular gene, or the degradation of its product, at a precise moment during the time-course of the experiment. This makes it possible to perturb the network dynamics in a variety of ways, thus obtaining precious information for network inference.</p>
        <div align="center" style="margin-top:10px">
          <a name="uid11">
            <!--...-->
          </a>
          <table title="" class="objectContainer">
            <caption align="bottom"><strong>Figure
	3. </strong>Monitoring of bacterial gene expression <i>in vivo</i> using fluorescent reporter genes (Stefan <i>et al.</i>, <i>PLoS Computational Biology</i>, 11(1):e1004028, 2015). The plots show the primary data obtained in a kinetic experiment with <i>E. coli</i> cells, focusing on the expression of the motility gene <i>tar</i> in a mutant background. <i>A:</i> Absorbance (<span class="math"><math xmlns="http://www.w3.org/1998/Math/MathML"><mo>•</mo></math></span>, black) and fluorescence (<span class="math"><math xmlns="http://www.w3.org/1998/Math/MathML"><mo>•</mo></math></span>, blue) data, corrected for background intensities, obtained with the <span class="math"><math xmlns="http://www.w3.org/1998/Math/MathML"><mi>Δ</mi></math></span><i>cpxR</i> strain transformed with the p<i>tar</i>-<i>gfp</i> reporter plasmid and grown in M9 with glucose. <i>B:</i> Activity of the <i>tar</i> promoter, computed from the primary data. The solid black line corresponds to the mean of 6 replicate absorbance measurements and the shaded blue region to the mean of the promoter activities <span class="math"><math xmlns="http://www.w3.org/1998/Math/MathML"><mo>±</mo></math></span> twice the standard error of the mean.</caption>
            <tr align="center">
              <td>
                <table>
                  <tr>
                    <td style="height:3px;" align="center">
                      <img alt="IMG/CpxRM9_FluoAbsmeanAbsPA_Tar.png" src="IMG/CpxRM9_FluoAbsmeanAbsPA_Tar.png"/>
                    </td>
                  </tr>
                </table>
              </td>
            </tr>
          </table>
        </div>
        <p>The specific niche of IBIS in the field of network inference has been the development and application of genome engineering techniques for constructing the reporter and perturbation systems described above, as well as the use of reporter gene data for the reconstruction of gene regulation functions. We have developed an
experimental pipeline that resolves most technical difficulties in the generation of reproducible time-series measurements on the population level. The pipeline comes with data analysis software that converts the
primary data into measurements of time-varying promoter activities (Sections <a title="WellReader" href="./uid34.html">5.4</a> and <a title="WellInverter" href="./uid29.html">5.3</a>). In addition, for measuring gene expression on the single-cell level by means of microfluidics and time-lapse fluorescence microscopy, we have established collaborations with groups in Grenoble and Paris. The data thus obtained can be exploited for the structural and parametric identification of gene regulatory networks, for which methods with a solid mathematical foundation are developed, in collaboration with colleagues at ETH Zürich and EPF Lausanne (Switzerland). The vertical integration of the network inference process, from the construction of the biological material to the data analysis and inference methods, has the advantage that it allows the experimental design to be precisely tuned to the identification requirements.</p>
      </div>
      <!--FIN du corps du module-->
      <br/>
      <div class="bottomNavigation">
        <div class="tail_aucentre">
          <a href="./uid8.html" accesskey="P"><img style="align:bottom; border:none" alt="previous" src="../static/img/icons/previous_motif.jpg"/> Previous | </a>
          <a href="./uid0.html" accesskey="U"><img style="align:bottom; border:none" alt="up" src="../static/img/icons/up_motif.jpg"/>  Home</a>
          <a href="./uid12.html" accesskey="N"> | Next <img style="align:bottom; border:none" alt="next" src="../static/img/icons/next_motif.jpg"/></a>
        </div>
        <br/>
      </div>
    </div>
  </body>
</html>