Section:
New Results
A projection algorithm for gradient waveforms design in Magnetic Resonance Imaging
Collecting the maximal amount of information in a given scanning time
is a major concern in Magnetic Resonance Imaging (MRI) to speed up
image acquisition. The hardware constraints (gradient magnitude, slew
rate, ...), physical distortions (e.g., off-resonance effects) and
sampling theorems (Shannon, compressed sensing) must be taken into
account simultaneously, which makes this problem extremely
challenging. To date, the main approach to design gradient waveform
has consisted of selecting an initial shape (e.g. spiral, radial
lines, ...) and then traversing it as fast as possible using optimal
control. In this paper, we propose an alternative solution which first
consists of defining a desired parameterization of the trajectory and
then of optimizing for minimal deviation of the sampling points within
gradient constraints. This method has various advantages. First, it
better preserves the density of the input curve which is critical in
sampling theory. Second, it allows to smooth high curvature areas
making the acquisition time shorter in some cases. Third, it can be
used both in the Shannon and CS sampling theories. Last, the optimized
trajectory is computed as the solution of an efficient iterative
algorithm based on convex programming. For piecewise linear
trajectories, as compared to optimal control reparameterization, our
approach generates a gain in scanning time of 10% in echo planar
imaging while improving image quality in terms of signal-to-noise
ratio (SNR) by more than 6 dB. We also investigate original
trajectories relying on traveling salesman problem solutions. In this
context, the sampling patterns obtained using the proposed projection
algorithm are shown to provide significantly better reconstructions
(more than 6 dB) while lasting the same scanning time.
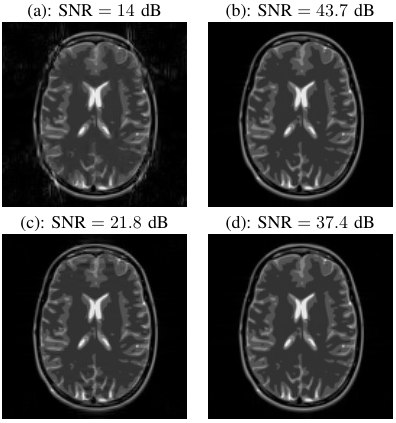
Figure
10. Reconstructed images from data collected along EPI-like
trajectories. (a)-(b): Reconstruction results from the optimally
reparameterized EPI readout. (c)-(d): Reconstructed results from
data collected using the projected EPI trajectories. See
[9] for more information.
|
|
See Fig. 10 for an illustration and
[9] for more information.