Section:
New Results
Cross-validation failure: small sample sizes lead to large error bars
Predictive models ground many state-of-the-art developments in
statistical brain image analysis: decoding, MVPA, searchlight, or
extraction of biomarkers. The principled approach to establish their
validity and usefulness is cross-validation, testing prediction on
unseen data. Here, we raise awareness on error bars of
cross-validation, which are often underestimated. Simple experiments
show that sample sizes of many neuroimaging studies inherently lead to
large error bars, eg for 100 samples. The standard error
across folds strongly underestimates them. These large error bars
compromise the reliability of conclusions drawn with predictive
models, such as biomarkers or methods developments where, unlike with
cognitive neuroimaging MVPA approaches, more samples cannot be
acquired by repeating the experiment across many subjects. Solutions
to increase sample size must be investigated, tackling possible
increases in heterogeneity of the data.
More information can be found in Fig. 8 in [33].
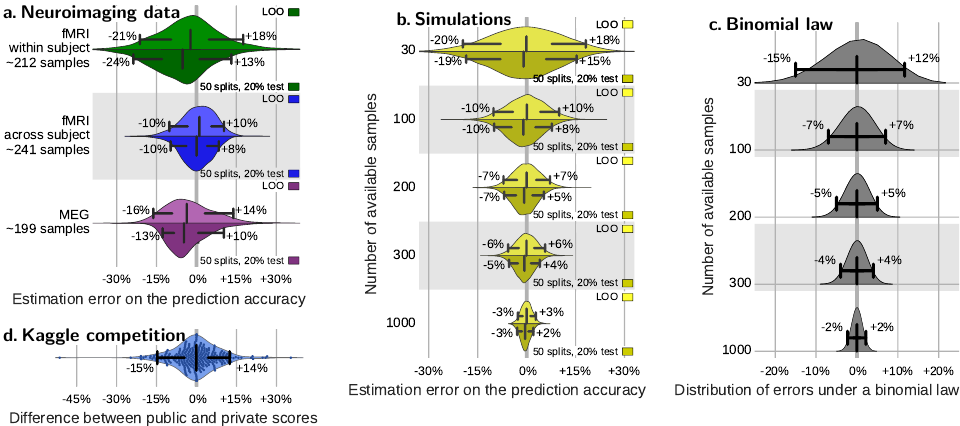
Figure
8. Cross-validation errors. a – Distribution of errors between
the prediction accuracy as assessed via cross-validation (average
across folds) and as measured on a large independent test set for
different types of neuroimaging data. b – Distribution of errors
between the prediction accuracy as assessed via cross-validation on
data of various sample sizes and as measured on 10 000 new data
points for simple simulations. c – Distribution of errors as given
by a binomial law: difference between the observed prediction error
and the population value of the error, p = 75%, for different
sample sizes. d – Discrepancies between private and public
score. Each dot represents the difference between the accuracy of a
method on the public test data and the private one. The scores are
retrieved from http://www.kaggle.com/c/mlsp-2014-mri, in which 144
subjects were used total, 86 for training predictive model, 30 for
the public test set, and 28 for the private test set. The bar and
whiskers indicate the median and the 5th and 95th
percentile. Measures on cross-validation (a and b) are reported for
two reasonable choices of cross-validation strategy: leave one out
(leave one run out or leave one subject out in data with multiple
runs or subjects), or 50-times repeated splitting of 20% of the
data.
|
|