|
|

|

|
| e-Pub |
Section: New Results
Vesicles trajectory detection and analysis
Participant : Xavier Descombes.
This work has been done in collaboration with Maximilian Furthauer and Thomas Juan from iBV.
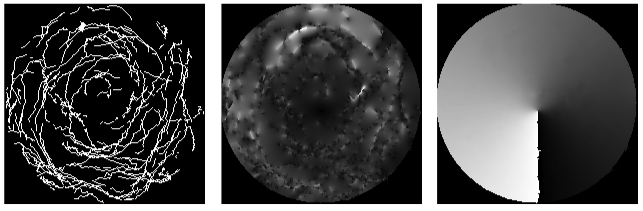
In many species, the left right asymetry of organs location is initiated in a ciliated cavity called Kupffer's vesicle in zebrafish. The cills beating induce a non symetrical flow in the cavity that can be studied by following the trajectory of exovesicles in the Kupffer's vesicle. The goal of this project is to automatically track these exovesicles and to perform a statistical analysis of theses trajectories in different conditions.
We consider 2D time sequences of images. To extract the vesicles from the time sequence we first remove the background by substracting a local time mean. We then detect the cell border using an active contour computed on the spatial derivative of the images. The vesicles are then simply detected using a threshold followed by a morphological opening to remove the noise. The trajectory are finally obtained using a morphological closing in time. We aim at statistically comparing populations. In order to aggregate trajectories from several samples, we project the datasets into the same space using a continuous transformation of each cell into a reference disk. We thus project all the obtained trajectories from a given population into this disk. We compute the speed vector on each time point of each detected trajectory. To obtain a dense representation of the norm and the orientation of the vector speed in the reference disk, we extrapolate the obtained vector speed to a regular lattice with a Gaussian Markov random field. Finally, we obtain two spatial maps of respectively the norm and the orientation of the speed 9 .