|
|

|

|
| e-Pub |
Section: New Results
Detection and characterization of mitochondrials networks
Participants : Kévin Giulietti, Xavier Descombes.
This work is made in collaboration with Frédéric Bost, Stephan Clavel, Aurélie Charazac, Celia Decondé le Butor (C3M).
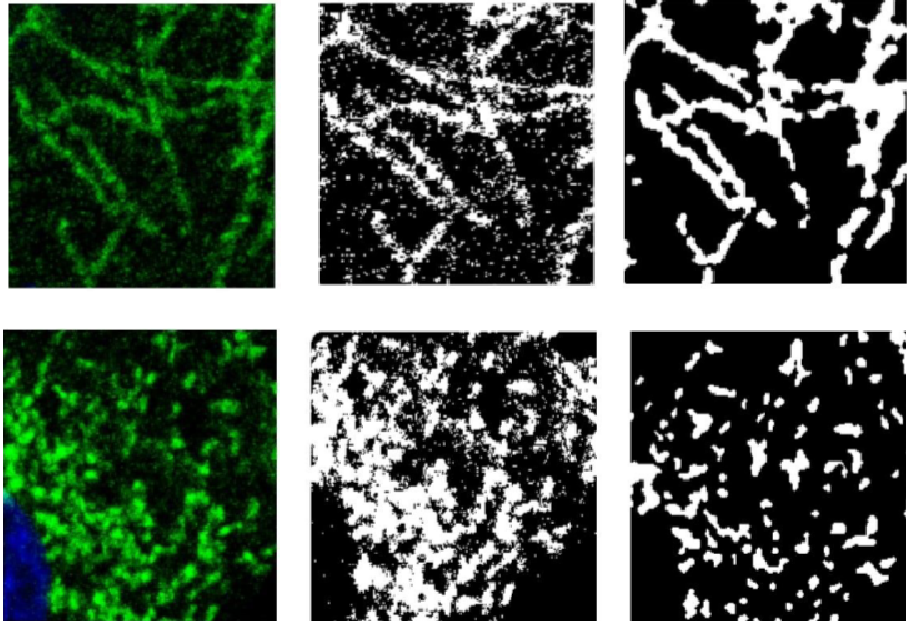
We consider in this project a high content microscopy based screening focused on the effects of endocrine disruptors on prostatic cancer cells metabolism. Specifically, we developed our automatic computational tool to detect and classify mitochondrial network morphology from microscopy acquired images. The first step consists in binarizing the image and the binary pattern representing the mitochondrial network is classified in a second step. To binarize the mitochondrial network we consider the different level sets in the original image. A score is computed on each connected component of the level set pyramid depending on the contrast between the component and the neighboring background and on a shape criteria. We thus select the best scored component considering a compromise between the component contrast and a shape prior. We then run a k-mean clustering on the set defined by all the mitochondrial component extracted from the whole database. The different estimated classes are typical mitochondrial network element such as filaments or blobs. An image is then classified based on its signature defined by the number of mitochondrial element detected for each of the pre-defined classes (see Figure5). This classification scheme provides a discrimination framework based on geometrical and topological mitochondrial network properties than can differentiate for example filamentous and aggregate networks. This tool will be used for automatically specifying the effect of endocrine disruptors.
|