|
|

|

|
| e-Pub |
Section: New Results
Renal cell carcinoma classification from histopathological images
Participants : Mohammed Lamine Benomar, Nilgoon Zarei, Eric Debreuve, Xavier Descombes.
This work is made in collaboration with Damien Ambrosetti (MD, Pasteur Hospital, Nice).
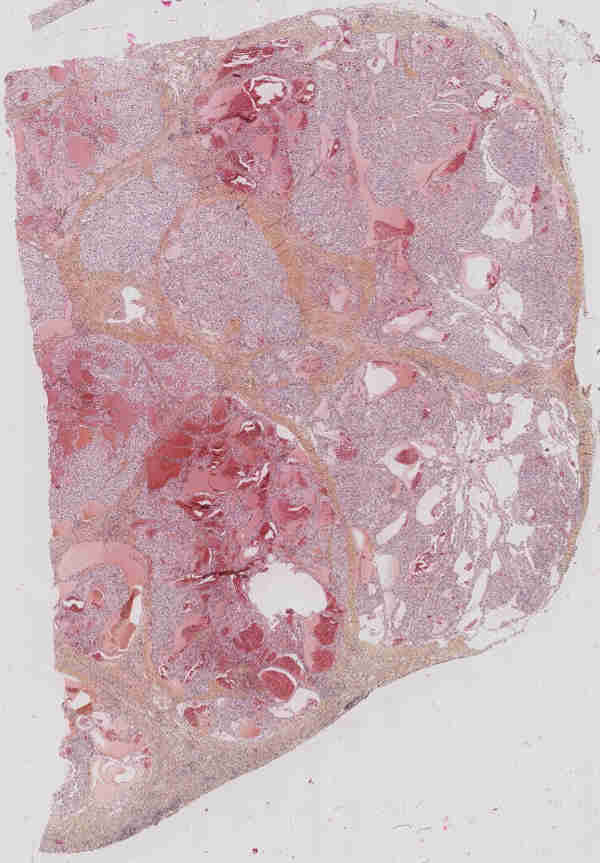
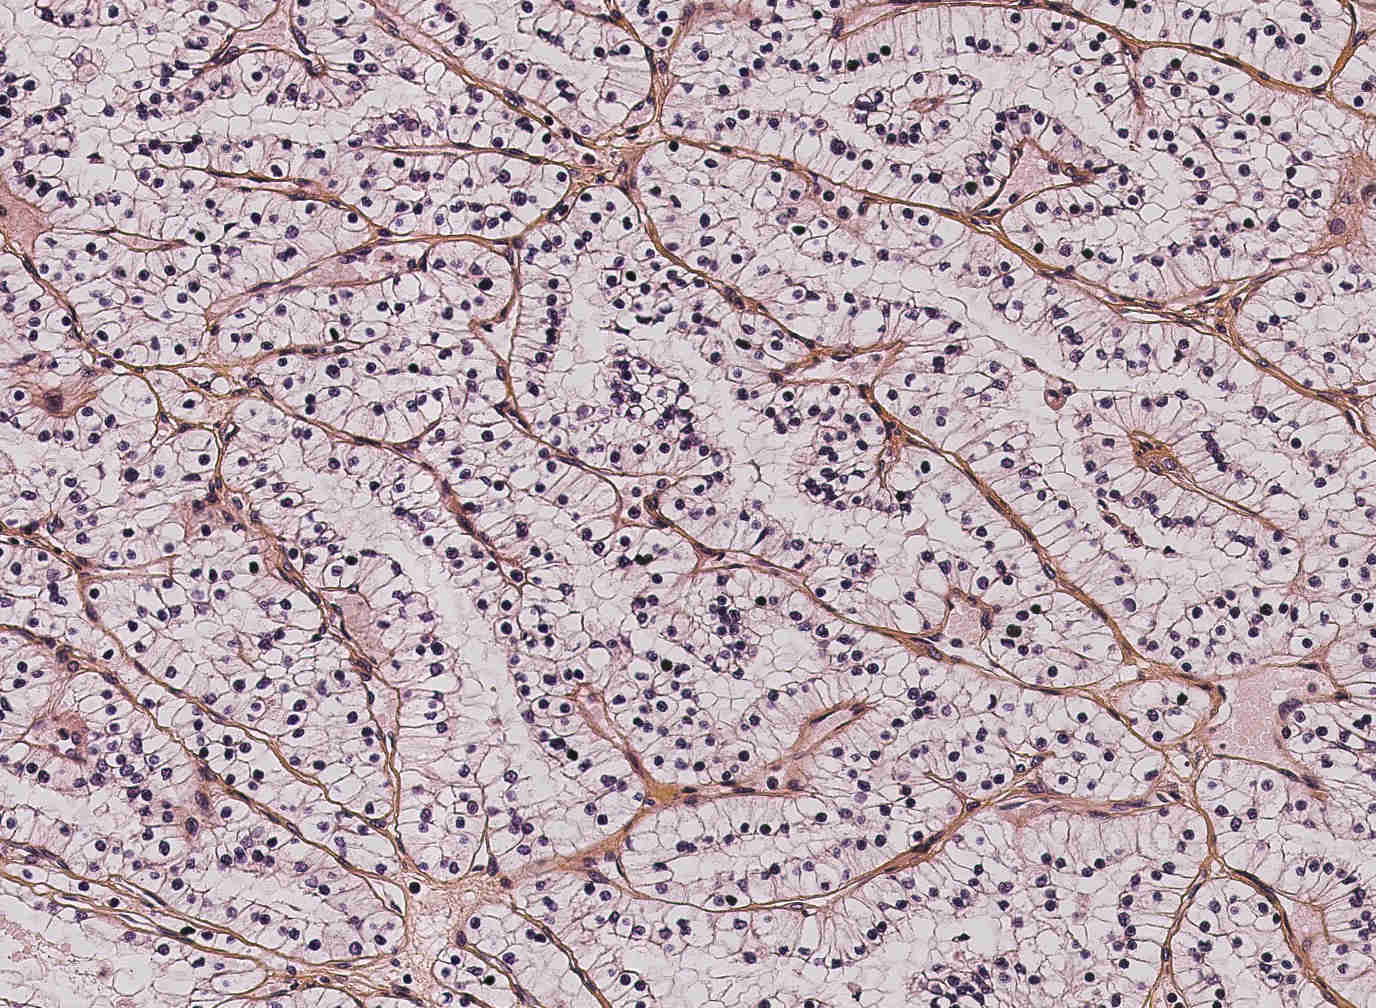
The renal cell carcinoma is the most frequent type of kidney cancer (between 90% and 95% of all cases). Twelve classes of carcinoma can be distinguished, among which the clear cell carcinoma (CCRCC) and the papillary carcinoma (PRCC) are the two most common ones (75% and 10% of the cases, respectively). After the carcinoma has been diagnosed, the tumor is ablated and prepared for histological examination (fixation, staining, slicing, observation with a microscope) (see Fig. 9).
|
Along with genetic tests and protein reactions, the histological study allows to classify and grade the tumor in order to make a prognosis and monitor the patient treatment. Clinically speaking, digital histology is a recent domain (routinely, histological slices are studied by MDs directly on the microscope). The classical works on digital histology deal with the automatic analysis of cells (size, density ...). However, one crucial factor for carcinoma classification is the structure of the vascular network. Coarsely, CCRCC is characterized by a "fishnet” structure while the PRCC has a tree-like structure.
In this context, we proposed to extract the vascular network from a given histological slice, compute features of the underlying graph structure, and classify the tumor into CCRCC or PRCC based on these features [24]. Then, we started to focus on performing a higher-level analysis of the vascular graphs. It can be noted that cells that are close to the vascular network naturally tend to align with it. Thus there might be specific “cell-vascular network” arrangements for each type of carcinoma. Our plan is to look for repeated subgraph patterns using pattern matching methods on labeled graphs, where a pattern would be a combination of (i) topological features from the graph, (ii) nearby cell features, and (iii) measures characterizing the coherence between nearby cells and the network (cell-to-network distances, cell density along the network, degree of alignment with the network...). There are chances that each carcinoma type exhibits a set of patterns that appear with a high frequency, therefore being characteristic of the given type. Such patterns would then represent discriminant features for carcinoma classification.