Section:
Scientific Foundations
Knowledge representation with constraint programming
Biological networks are built with data-driven approaches aiming at translating genomic information into a functional map. Most methods are based on a probabilistic framework which defines a probability distribution over the set of models. The reconstructed network is then defined as the most likely model given the data. In the last few years, our team has investigated an alternative perspective where each observation induces a set of constraints - related to the steady state response of the system dynamics - on the set of possible values in a network of fixed topology. The methods that we have developed complete the network with product states at the level of nodes and influence types at the level of edges, able to globally explain experimental data. In other words, the selection of relevant information in the model is no more performed by selecting the network with the highest score, but rather by exploring the complete space of models satisfying constraints on the possible dynamics supported by prior knowledge and observations. Common properties to all solutions are considered as a robust information about the system, as they are independent from the choice of a single solution to the optimization problem[6] .
Solving these computational issues requires addressing NP-hard qualitative (non-temporal) issues, based on a notion of causality. We have developed a long-term collaboration with Potsdam University in order to use a logical paradigm named Answer Set Programming [27] , [30] to solve these optimization issues. Applied on transcriptomic or cancer networks, our methods identified which regions of a large-scale network shall be corrected [1] , and proposed robust corrections [5] .
The results obtained so far suggest that this approach is compatible with efficiency; scale and expressivity needed by biological systems. Our goal is now to provide formal models of queries on biological networks with the focus of integrating dynamical information as explicit logical constraints in the modeling process. This would definitely introduce such logical paradigms as a powerful approach to build and query reconstructed biological systems, in complement to discriminative approaches.
Notice that our main issue is in the field of knowledge representation. More precisely, we do not wish to develop new solvers or grounders, a self-contained computational issue which is addressed by specialized teams such as our collaborator team in Potsdam. Our goal is rather to investigate whether progresses in the field of constraint logical programming, shown by the performance of ASP-solvers in several recent competitions, are now sufficient to address the complexity of optimization issues explored in systems biology.
Using these technologies requires to revisit and reformulate optimization problems at hand in order both to decrease the search space size in the grounding part of the process and to optimize the exploration of this search space in the solving part of the process. Concretely, getting logical encoding for the optimization problems forces to clarify the roles and dependencies between parameters involved in the problem. This opens the way to a refinement approach based on a fine investigation of the space of hypotheses in order to make it smaller and gain in the understanding of the system.
Figure
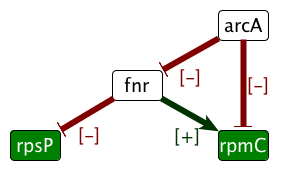
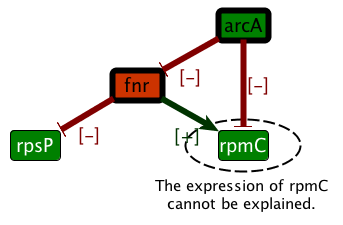
1. Excerpt from the ASP program identifying which expression of non-observed nodes (white nodes) are fixed by partial observations and rules derived from the system dynamics. The logical approach is flexible enough to model in a single framework network characteristics (products, interactions, partial information on signs of regulations and observations) and static rules about the effects of the dynamics of the system. Extensions of this framework include the exhaustive search for system repair or more constrained dynamical rules [6] , [5] . | |  | |  | | Step 1 . Regulation knowledge is represented as a signed oriented graph. Edge colors stand for regulatory effects (red/green inhibition or activation). Vertex colors stand for gene expression data (red/green under or over-expression). | | Step 2 . Integrity constraints on the whole colored graph come from the necessity to find a consistent explanation of the link between regulation and expression. | | Step 3 . The model allows both the prediction of values (e.g. for fnr in the figure) and the detection of contradictions (e.g. the expression level of rpmC is inconsistant with the regulation in the graph). |
|
| | Step 4 . Excerpt from the ASP program. |
|
| vertex(fnr). | 1{labelV(I ,+;-)}1 :- vertex(I). | receive(I,+) :- labelE(J,I,S), labelV(J,S). | | edge(fnr,rpsP). | labelV(I ,S) :- observedV(I,S). | receive(I,-) :- labelE(J,I,S), labelV(J,T), ST. | | observedE(fnr,rpsP,-). | 1{labelE(J,I,+;-)}1 :- edge(J,I). | :- labelV (I,S), not receive(I,S). | | observedV(rpsP,-). | labelE(J,I,S) :- observedE(J,I,S). | |
|


