

Section: Scientific Foundations
Analysis, simulation, and identification of bacterial regulatory networks
Participants : Sara Berthoumieux, Eugenio Cinquemani, Johannes Geiselmann, Nils Giordano, Hidde de Jong [Correspondent] , Michel Page, François Rechenmann, Delphine Ropers, Diana Stefan, Valentin Zulkower.
Computer simulation is a powerful tool for explaining the capability of bacteria to adapt to sudden changes in their environment in terms of structural features of the underlying regulatory network, such as interlocked positive and negative feedback loops. Moreover, computer simulation allows the prediction of unexpected or otherwise interesting phenomena that call for experimental verification. The use of simplified models of the stress response networks makes simulation easier in two respects. In the first place, model reduction restricts the class of models to a form that is usually easier to treat mathematically, in particular when quantitative information on the model parameters is absent or unreliable. Second, in situations where quantitative precision is necessary, the estimation of parameter values from available experimental data is easier to achieve when using models with a reduced number of parameters.
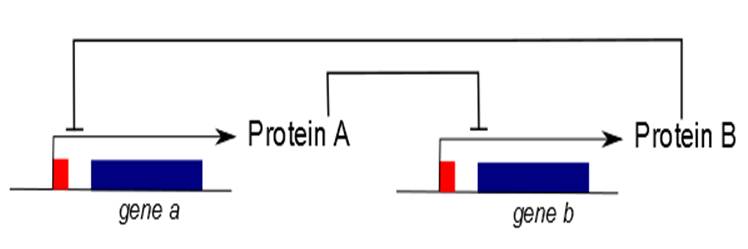
Over the past few years, we have developed in collaboration with the COMORE project-team a qualitative simulation method adapted to a class of piecewise-linear (PL) differential equation models of gene regulatory networks. The PL models, originally introduced by Leon Glass and Stuart Kauffman, provide a coarse-grained picture of the dynamics of gene regulatory networks. They associate a protein or mRNA concentration variable to each of the genes in the network, and capture the switch-like character of gene regulation by means of step functions that change their value at a threshold concentration of the proteins. The advantage of using PL models is that the qualitative dynamics of the high-dimensional systems are relatively simple to analyze, using inequality constraints on the parameters rather than exact numerical values. The qualitative dynamics of gene regulatory networks can be conveniently analyzed by means of discrete abstractions that transform the PL model into so-called state transition graphs.
|
The development and analysis of PL models of gene regulatory network has been implemented in the qualitative simulation tool Genetic Network Analyzer (GNA) (Section 5.1 ). GNA has been used for the analysis of several bacterial regulatory networks, such as the initiation of sporulation in B. subtilis, quorum sensing in P. aeruginosa, the onset of virulence in E. chrysanthemi, and environmental biodegradation by P. putida mt-2. GNA is currently distributed by the Genostar company, but remains freely available for academic research. The analysis of models of actual bacterial regulatory networks by means of GNA leads to large state transition graphs, which makes manual verification of properties of interest practically infeasible. This has motivated the coupling of GNA to formal verification tools, in particular model checkers that allow properties formulated in temporal logic to be verified on state transition graphs. This has been the subject of collaborations with the POP-ART and VASY project-teams at Inria Grenoble - Rhône-Alpes.
Recent advances in experimental techniques have led to approaches for measuring cellular processes in real-time on the molecular level, both in single cells and populations of bacteria (Section 3.3 ). The data sources that are becoming available by means of these techniques contain a wealth of information for the quantification of the interactions in the regulatory networks in the cell. This has stimulated a broadening of the methodological scope of IBIS, from qualitative to quantitative models, and from PL models to nonlinear ODE models and even stochastic models. The group has notably started to work on what is the bottleneck in the practical use of these models, the structural and parametric identification of bacterial regulatory networks from time-series data, in collaboration colleagues from INRA, the University of Pavia (Italy) and ETH Zürich (Switzerland). This raises difficult problems related to identifiability, measurement noise, heterogeneity of data sources, and the design of informative experiments that are becoming increasingly prominent in the systems biology literature.