Section: New Results
Learning spatiotemporal trajectories from manifold-valued longitudinal data
Participants : Jean-Baptiste Schiratti [Correspondant] , Stéphanie Allassonniere, Olivier Colliot, Stanley Durrleman.
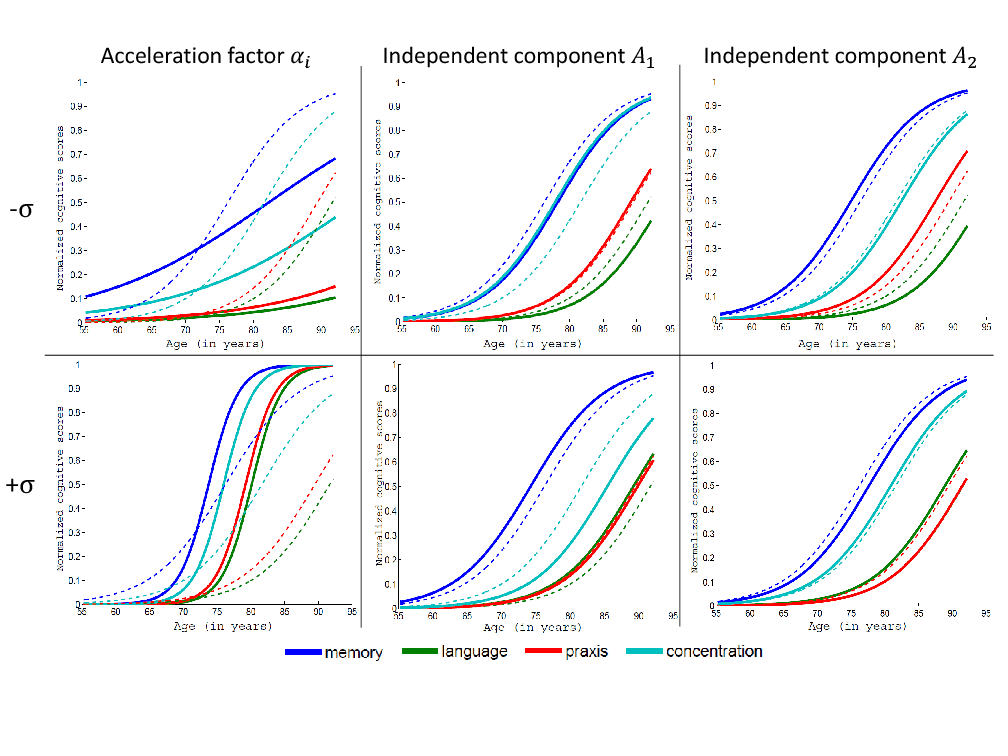
We propose a Bayesian mixed-effects model to learn typical scenarios of changes from longitudinal manifold-valued data, namely repeated measurements of the same objects or individuals at several points in time. The model allows the estimation of a group-average trajectory in the space of measurements. Random variations of this trajectory result from spatiotemporal transformations, which allow changes in the direction of the trajectory and in the pace at which trajectories are followed. The use of the tools of Riemannian geometry allows to derive a generic algorithm for any kind of data with smooth constraints, which lie therefore on a Riemannian manifold. Stochastic approximations of the Expectation-Maximization algorithm is used to estimate the model parameters in this highly non-linear setting.
The method is used to estimate a data-driven model of the progressive impairments of cognitive functions during the onset of Alzheimer's disease. Experimental results show that the model correctly put into correspondence the age at which each individual was diagnosed with the disease, thus validating the fact that it effectively estimated a normative scenario of disease progression. Random effects provide unique insights into the variations in the ordering and timing of the succession of cognitive impairments across different individuals.
More details in [30] and [31] .
|