
2024Activity reportProject-TeamBIVWAC
RNSR: 202424473B- Research center Inria Centre at the University of Bordeaux
- In partnership with:CNRS
- Team name: Building Immersive Visualizations for Welfare, Awareness, and Comprehension
- In collaboration with:Laboratoire Bordelais de Recherche en Informatique (LaBRI)
- Domain:Perception, Cognition and Interaction
- Theme:Interaction and visualization
Keywords
Computer Science and Digital Science
- A3.1. Data
- A5.1. Human-Computer Interaction
- A5.1.1. Engineering of interactive systems
- A5.1.2. Evaluation of interactive systems
- A5.1.6. Tangible interfaces
- A5.1.8. 3D User Interfaces
- A5.1.9. User and perceptual studies
- A5.2. Data visualization
- A5.6.1. Virtual reality
- A5.6.2. Augmented reality
Other Research Topics and Application Domains
- B2.1. Well being
- B3.1. Sustainable development
- B3.6. Ecology
- B9.1. Education
- B9.2. Art
- B9.3. Medias
- B9.5.3. Physics
- B9.6.1. Psychology
- B9.7. Knowledge dissemination
1 Team members, visitors, external collaborators
Research Scientists
- Martin Hachet [Team leader, INRIA, Senior Researcher]
- Benjamin Bach [INRIA, ISFP, from Feb 2024]
- Pierre Dragicevic [INRIA, Researcher]
- Yvonne Jansen [CNRS, Researcher]
Post-Doctoral Fellows
- Claudia Krogmeier [INRIA, Post-Doctoral Fellow, until Jul 2024]
- Leni Yang [INRIA, from Sep 2024]
PhD Students
- Ambre Assor [INRIA, until Mar 2024]
- Vincent Casamayou [UNIV BORDEAUX]
- Edwige Chauvergne [INRIA]
- Valentin Edelsbrunner [INRIA, from Oct 2024]
- Aymeric Ferron [INRIA]
- Morgane Koval [INRIA, until Mar 2024]
- Juliette Le Meudec [INRIA]
- Maudeline Marlier [SNCF, CIFRE]
- Leana Petiot [INRIA]
- Emma Tison [UNIV BORDEAUX]
Technical Staff
- Adrien Corn [INRIA, Engineer, from Feb 2024]
- Justin Dillmann [INRIA, Engineer, from Nov 2024]
- Thibaud Mornet- -Blanchet [INRIA, Engineer, from Dec 2024]
Interns and Apprentices
- Emilie Clement [UNIV BORDEAUX, from Feb 2024 until Aug 2024]
- Joshua Kan Yao [UNIV BORDEAUX, Intern, from Apr 2024 until Jun 2024]
- Maylis Lageste [SNCF, Intern, from May 2024 until Aug 2024]
- Nathan Salin [INRIA, Intern, from Apr 2024 until Aug 2024]
Administrative Assistant
- Anne-Lise Pernel [INRIA]
External Collaborator
- Arnaud Prouzeau [INRIA]
2 Overall objectives
Many data sets and real-world phenomena are difficult for non-experts to understand. As a result, there is often a distance between the knowledge and the audience, who may have difficulty in making correct inferences and acting accordingly. The overall objective of Bivwac is to bridge the gap between data and action by studying new tools and methods that can help practitioners to better explain data and phenomena in various domains. Our main motivation is to contribute to the dissemination of knowledge in our societies, which can lead to better informed decisions and actions.
For example, a lot of scientific data and predictive models are concerned with environmental issues. However, there are many misconceptions among the general public and it often is difficult to relate relevant information to peoples' everyday experiences. The same holds for mental health, where it can be difficult to develop a good understanding of disorders without experiencing what patients live every day. As a result, many misconceptions, fears, and stigmas tend to exclude part of the world’s population. In terms of general education, many complex topics, such as emerging scientific disciplines (e.g., quantum physics), are reasonably well understood by experts but are still beyond the reach of most students. Again, this is largely due to the abstract and complex nature of the underlying phenomena, which makes them difficult to access with current tools.
Bivwac explores how to make such complex data and phenomena more accessible, understandable, and impactful. Therefor, we focus on the design, implementation, and evaluation of immersive visualization experiences. Immersive visualization—visualization in augmented reality (AR), virtual reality (VR), large-wall displays, physicalizations and generally using any technology that brings users closer to the digital content offer promising ways to experience, understand, and explore data and complex phenomena. Yet, the design of such applications is under-researched. By identifying the factors that determine the success of immersive visualization experiences and by creating new tools that help to transfer and promote useful knowledge, we hope to contribute to moving the world towards a more sustainable and collectively desirable future, in line with the United Nations Sustainable Development Goals.
3 Research program
Bivwac's research and overall methodology can be described along three main directions (or pillars): devising theories and understanding domains, designing and implementing interventions and techniques, and surfacing empirical evidence through rigorous experimentation. These three pillars are equally important and tightly linked (Figure 1); although it will be possible to obtain intermediate results by focusing on each of the pillars independently, big advances will be possible only if we tackle the research challenges in a holistic manner. Hence, we adopt an iterative process with multiple back-and-forth actions between theory and observations, the creation of technology, and evaluations of the proposed methods. Such a process is a standard approach for research in HCI. The remainder of this section details each of these pillars and our respective methods.
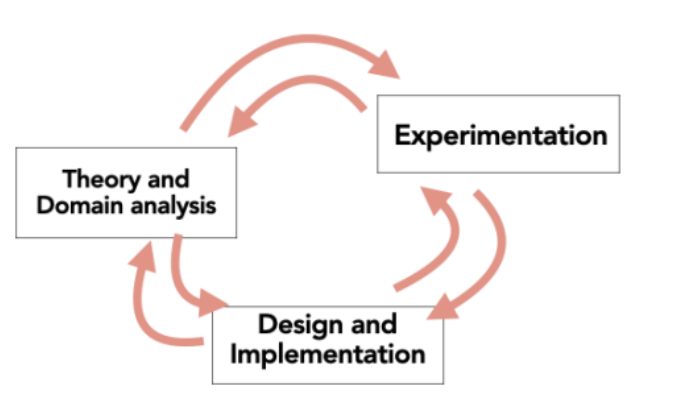
The figure shows the three pillars of our research program and their respective relationships: each one having some (undefined) relation with each other. The figure is a schema with three text boxes and the respective arrows connecting them in both directions.
3.1 Structured theory and domain analysis
This pillar consists in identifying and understanding the current state of knowledge, available data and practices, as well as the challenges that are linked to the application domains we target, for example, in the form of literature reviews in our scientific field, as well as related domains such as economy, environmental sciences, psychology and education. A multidisciplinary approach with colleagues in these domains will allow us to identify challenges and opportunities, which will result in the building of conceptual frameworks and research hypotheses.
For example, the goal in one of our PhD projects is to make quantum physics more accessible, and to encourage students to explore this strategic subject in more depth. To that end, we learn what quantum physics is, we discuss with teachers and students to identify the current barriers to understanding in a bottom-up approach, and we explore literature in education.
This theoretical pillar informs the other two pillars, but is also informed by them. Indeed, the tools we develop and the experiments we conduct will help us refine our theories, both by providing answers to our research questions and by revealing possibilities we have not considered before (e.g., new types of designs and new research questions).
3.2 Creative Design and implementation
This second pillar focuses on the effective creation of immersive visualization experiences, interventions, and techniques. Numerous ingredients contribute to the creation of such experiences. At a design level, it is fundamental to clearly identify what a given experience is expected to produce: elicitation of emotions, support for learning, enhanced collaboration between participants, and so on. This will lead to the emergence of ideas that we will seek to materialize through research prototypes. Concretely, brainstorming, ideation sessions, and focus groups are tools that will help us to stimulate, possibly with collaborators from other domains, the creation of (disruptive) ideas. This ideation process is often conducted directly with practitioners or citizens, as we are currently doing with students in psychology to create a tool dedicated to the lack of awareness in schizophrenia (see LiveIt project). Because we target technologies that may contribute to enhancing immersiveness, we will base our developments on unconventional input and output modalities that may go beyond the limits of current desktop systems.
Besides a focus on technolgy, we also explore new approaches making use of data storytelling, relatively young research field whose objective is to improve the understanding of data and phenomena by walking a viewer through the data or phenomenon gradually. Such approaches seem particularly well suited for the general objective we target in Bivwac, so we will take inspiration from this line of research as well as extend it, as it is still a nascent area with many unexplored opportunities and a lot of unanswered research questions.
For the design of interventions and techniques, we adpot an iterative process that moves us progressively from low-fidelity towards high-fidelity prototypes which will be tested during evaluation sessions (see Pillar 3). Where sensble, we put effort in making our tools and methods available, so other researchers can benefit from our know-how, and replicate our technological environments for their own research. Successful designs can also be used outside the lab, and in some cases, can potentially be transferred, as we did in the past in the Potioc Inria team.
3.3 Rigorous Experimentation
The third pillar concerns experimental work to evaluate our designs (Pillar 2) through experiments with users. This allows us to refine our prototypes and to compare them to the state of the art. This will also allow us to better understand the factors that impact the understanding or engagement of users for given information types and tasks. All members of Bivwac are highly familiar with such experimental work which is central to any HCI and visualization research. Designing solid and informative user experiments is a research challenge in itself, and a constant concern that will drive our research group.
Controlled lab experiments allow to assess low-level mechanisms such as the ability of the human visual system to perceive such or such stimuli among other distractive stimuli. Other kinds of lab experiments can assess the usability of a new system more broadly as well as the cognitive involved in its usage. Finally, we conduct higher level experiments to evaluate the extent at which a given system facilitates the understanding of abstract phenomena or to understand if participants change their behavior after having attended one of our immersive visualization experiences.
4 Application domains
Bivwac is interested in application domains where there exists data and knowledge that are difficult to comprehend by non-experts, and where better education is likely to bring positive societal consequences. We chose to focus on domains that we currently think are the most likely to contribute to building a sustainable and collectively desirable world as laid out by the United Nation as Sustainable Development Goals (SDG), since those tend to be the most meaningful and the most inspiring to us, as reflected by our choice of terms in the BIVWAC acronym: Welfare, Awareness, Comprehension. Our main application domains include:
4.1 Environment
Environmental issues are a key domain as rapid global action is required and any approach that may be able to mitigate the crisis deserves to be explored. We are looking at how to help practitioners better educate citizens, politicians, and decision makers for the promotion of pro-environmental decisions and actions as laid out by environmental sciences experts (e.g. IPPC) and government agencies such as ADEME. We consider data and phenomena at different levels; at a microscopic level we focus on specific problems (e.g. understanding the relative importance of carbon footprint for different meals); at a more macroscopic level where we try to convey a more global picture of available knowledge (e.g. better understanding the causes and consequences of global warming, the different levers of change, and the diverse implications of policies).
4.2 Education
We are interested in education in general, in particular when knowledge is difficult to transmit with standard methods and user interfaces. As an example, we have worked on the teaching of wave optics for several years, and we have built a new interactive tool that goes beyond the limits of current teaching approaches. We continue and extend this work in various areas, including quantum physics and collaborative learning, as well as education for visualization and data literacy.
4.3 Global Welfare
Global welfare can be broken down into several directions of research. We have started exploring how immersive AR visualizations can help people better understand what schizophrenia is, with the final goal of reducing stigma. Other research directions relate to humanitarian visualizations where we want to study how immersive visualization experiences can be used to help reduce global suffering.
For these application domains, the challenge is to engage people in a process of learning, to promote a comprehensive understanding of poorly-understood phenomena, to encourage discussions and reflections between citizens or, potentially, to favor a real change in people’s behaviors. This differs from what is generally studied in more traditional contexts where productivity is often a target (optimize completion time, minimize error rate).
5 Social and environmental responsibility
Bivwac was created with the motivation of contributing to the major challenges linked to environmental and social issues, as detailed in Section 2. The team's objectives align with multiple of the United Nations Sustainable Development Goals (SDGs). Examples of projects that are directely related are Live-It8.2 (Welfare), ARWAV8.7, Dana8.10, Edo, visualization atlases 8.11 (Environmental impact), or ICARE8.6 and HOBIT8.1 (Education).
BIVWAC is one of the signatories of Charte d’engagement « Labos en transitions » des structures de recherche du site universitaire de Bordeaux et de leurs établissements de rattachement.
We also co-organized workshop at Vis 2024 dedicated to Visualization for Climate Action and Sustainability Viz4ClimateAndSustainability.
6 Highlights of the year
Photo of the Bivwac stand at the IHM 2024 demo night.
- The Bivwac team was officially created on 1st January 2024.
- On March 27th 2024, in order to advertise the new team to the French research community, the team members held a large Bivwac stand at the main national conference on human-computer interaction (IHM '24), with 10 demos: link.
- On May 27th 2024, we held the team launching ceremony at Inria BSO, again with several demos: link.
- Benjamin Bach defended his HDR on 13th December 2024: “One Visualization at a Time: Forms, Tools, and Skills for Big-Data Visual Exploration and Communication”.
7 New software, platforms, open data
7.1 New software
7.1.1 ARwavs
-
Name:
Augmented Reality Waste Accumulation Visualizations
-
Keywords:
Unity 3D, Augmented reality, Immersive experience, Visualization
-
Scientific Description:
Augmented-reality waste accumulation visualizations (ARwavs) are literal representations of waste data embedded in users' familiar environment – they represent a new class of visualizations, which we introduced in an academic paper (https://hal.science/hal-04399489v1). This software is a set of examples of ARwavs written in Unity, which we first implemented on Hololens and then ported to Meta Quest 3. They were demonstrated at several events and used in a controlled study.
-
Functional Description:
Concrete and interactive visualization experience in augmented reality. Initially developed for HoloLens 2 then ported to Meta Quest 3.
-
Release Contributions:
Meta Quest 3 version developed under Unity
- URL:
-
Contact:
Martin Hachet
7.1.2 Tulibee
-
Name:
Unity-Otree Bridge
-
Keywords:
Unity 3D, Otree, Augmented reality, Server
-
Scientific Description:
Tool for experts wishing to set up collaborative experiences requiring a game engine.
-
Functional Description:
Bridge allowing data to be exchanged between an Otree server and projects running under Unity. The goal is to be able to set up multiplayer experiences whose data is stored on a server. The project includes a common-pool resource experience in VR running with Meta Quest 3 and serving as a proof of concept.
-
Release Contributions:
Initial release
- URL:
-
Contact:
Adrien Corn
7.1.3 SHIRE
-
Name:
Simulation of Hobit for an Interactive and Remote Experience
-
Keywords:
Unity 3D, Optics, Education
-
Functional Description:
SHIRE is the desktop version of the HOBIT platform. It allows building experiments in wave optics and quantum physics. With this pedagogical tool, student can prepare or continue practical work at home. SHIRE can also be used in a collaborative mode, where several instances of the software are connected.
-
Contact:
Vincent Casamayou
-
Participants:
Vincent Casamayou, Justin Dillmann, Martin Hachet, Bruno Bousquet, Lionel Canioni
7.1.4 Dana
-
Name:
Dana - Proxy visualization to communicate three planetary boundaries
-
Keywords:
Data visualization, Unity 3D
-
Functional Description:
Dana is a desktop software tool allowing users to enter different eating habits and test their degree of sustainability in terms of greenhouse gas emissions, freshwater use and land use. By controlling the elapsed time in the simulation, users can observe changes on a digital mini-world acting like a proxy visualization.
-
Release Contributions:
First version of the software.
- URL:
-
Contact:
Martin Hachet
7.1.5 Vistorian
-
Name:
Vistorian—Interactive Visualizations for Dynamic and Multivariate Networks. Free, online, and open source.
-
Keywords:
Geo-visualization, Data visualization, Graph visualization, Network analysis
-
Functional Description:
User can upload network data and use a range of interactive data visualiztions. Main features include: a) wide range of different interactive network visualizations: node link diagrams, timelines, matrices, maps, etc. b) side-by-side view and parallel use of any of these visualizations. c) a geocoding service that obtains geographic locations from placenames in your dataset.
- URL:
-
Contact:
Benjamin Bach
7.1.6 NetPanorama
-
Name:
NetPanorama—A Declarative Grammar for Interactive Network Visualization
-
Keywords:
Data visualization, Network analysis
-
Functional Description:
NetPanorama is a domain-specific language and declarative grammar for interactive network visualization design that supports multivariate, temporal, and geographic networks. NetPanorama allows users to specify network visualizations as combinations of primitives and building blocks. These support network creation and transformation, including computing metrics, orderings, seriations and layouts, visual encodings, including glyphs, faceting, and label visibility, and interaction for exploration and modifying styling. This approach allows the creation of a range of visualizations including many types of node-link diagrams, adjacency matrices using diverse cell encodings and node orderings, arc diagrams, PivotGraph, small multiples, time-arcs, geographic map visualizations, and hybrid techniques such as NodeTrix. NetPanorama aims to remove the need to use multiple libraries for analysis, wrangling, and visualization. Consequently, NetPanorama supports the agile development of applications for visual exploration of networks and data-driven storytelling. Documentation, source code, further examples, and an interactive online editor can be found online: https://netpanorama.netlify.app/.
- URL:
-
Contact:
Benjamin Bach
-
Partner:
University of Edinburgh
7.2 Open data
Research material shared on the Open Science Framework (OSF) platform:
- https://osf.io/v4yxs/ – Data, analysis scripts, and preregistration for the paper Augmented-Reality Waste Accumulation Visualizations, co-authored by Ambre Assor , Martin Hachet , Arnaud Prouzeau and Pierre Dragicevic5.
- https://osf.io/gs4fy/ – Data from a literature analysis for the paper The Many Ways of Being Transparent in Human-Computer Interaction Research, co-authored by Yvonne Jansen and Pierre Dragicevic27.
- https://osf.io/rftxn/ – Data from a qualitative study for the paper Animating Hypothetical Trips to Communicate Space-Based Temporal Uncertainty on Digital Maps, co-authored by Yvonne Jansen and Morgane Koval8.
- https://osf.io/cvum9/ – Preregistration for the paper Animated Transitions for Abstract and Concrete Immersive Visualizations: A Design Space and Experiment, co-authored by Ambre Assor , Martin Hachet , Arnaud Prouzeau and Pierre Dragicevic24.
- https://osf.io/gscpv/ – Data, analysis scripts, and preregistration for the paper The Effect of Augmented Reality on Involuntary Autobiographical Memory, co-authored by Léana Petiot and Pierre Dragicevic (in press, just accepted).
8 New results
8.1 Teaching wave optics and quantum physics
Participants: Vincent Casamayou, Justin Dillmann, Nathan Salin, Martin Hachet.
External collaborators: Bruno Bousquet [Univ. Bordeaux], Lionel Canioni [Univ. Bordeaux], Jean-Paul Guillet [Univ. Bordeaux].
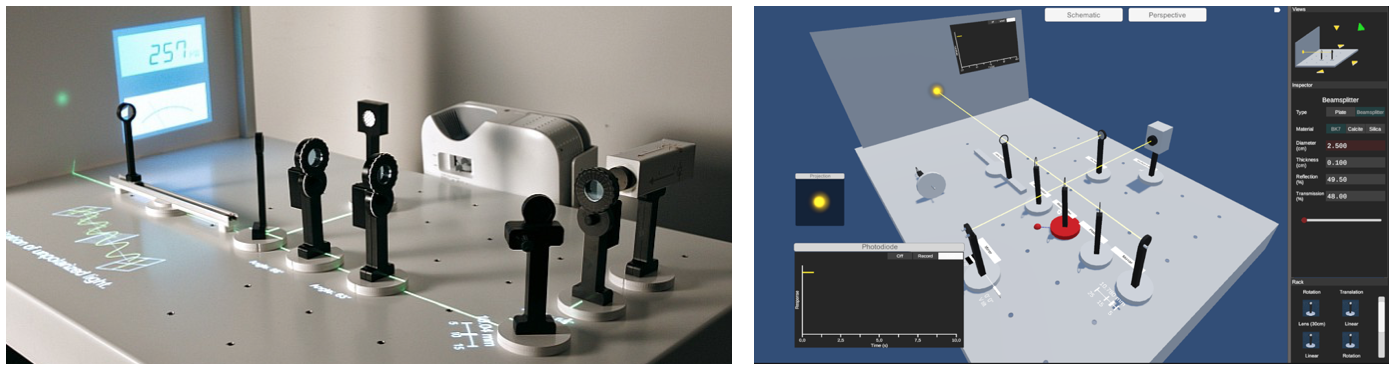
A view of HOBIT
Following the work related to HOBIT that we stared during the peroiod of our previous project-team (Potioc), we have continued developing new pedagogical tools to teach wave optics and quantum physics.
In particular, we published a journal paper 6 dedicated to the HOBIT table (Figure 2 - left). We also continued our developements with the desktop version of the table, SHIRE illustrated in Figure 2 -right. These new developements are currently evaluated by teachers and students, and should result in a dedicated publication.
In addition, we have worked on a network solution that allows connecting several instances of SHIRE / HOBIT. This opens the door to collaborative practical work, from distant locations.
8.2 Leveraging Augmented Reality for Understanding Schizophrenia
Participants: Claudia Krogmeier, Emma Tison, Justin Dillmann, Arnaud Prouzeau, Martin Hachet.
External collaborators: Antoinette Prouteau [Univ. Bordeaux].
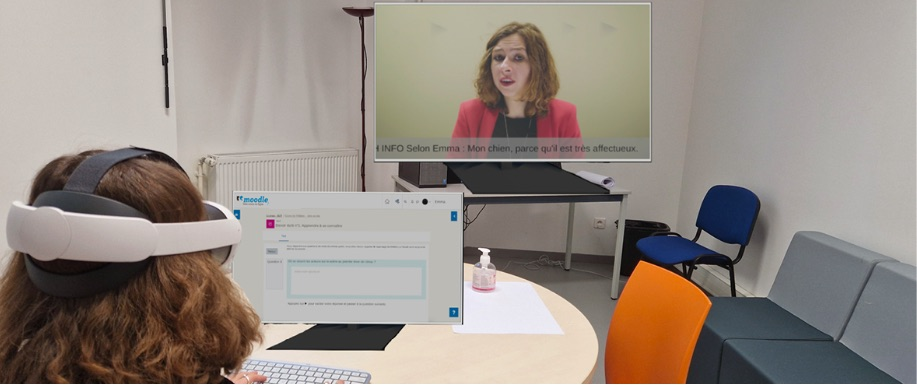
A particpant completes a desktop task while experiencing symptoms of schizophrenia in AR
Schizophrenia is a serious mental health disorder which may include symptoms such as hallucinations, delusions, and disorganized behavior. In addition to experiencing a diverse symptomatology, individuals with schizophrenia suffer from significant stigmatization which can interfere with effective treatment of the disorder among other issues 7. As a primary source of stigmatization comes from healthcare professionals, we were motivated to explore new ways in which to educate healthcare students about the symptoms of schizophrenia. Despite its potential to immerse users in new experiences within a real environment, little research concerning the use of augmented reality (AR) to simulate schizophrenia exists. Part of the project Live-It, we designed a tool using recommendations from prior work as well as inspiration from lived experiences to educate mental health students about schizophrenia (see Figure 4). The simulation uses the video passthrough capabilities of the Meta Quest 3 headset to simulate delusions, auditory hallucinations and additional symptomatology. Using thematic analysis, we evaluated our simulation with nineteen students and eighteen experts in healthcare to understand its ability to engage users and reliably represent symptoms of the disorder, as well as to determine how best to improve upon the design before the tool is widely deployed in mental health curricula. Our findings suggest that participants better understood symptoms of schizophrenia after experiencing the simulation, highlighting the potential of Live-It to be used as an educational tool. We present our design, provide a detailed analysis of our findings, and underline next steps in the development of our tool 1531.
8.3 Preparing Users to Embody their Avatars in VR
Participants: Martin Hachet.
External collaborators: Adélaïde Genay [University of Melbourne], Erika Kimura [Nara Institute of Science and Technology], Anatole Lécuyer [Inria - SEAMLESS],, Yutaro Hirao [Nara Institute of Science and Technology], Monica Perusquia-Hernandez [Nara Institute of Science and Technology], Hideaki Uchiyama [Nara Institute of Science and Technology],, Kiyoshi Kiyokawa [Nara Institute of Science and Technology].
Establishing a strong connection between users and their avatars in virtual reality poses an enduring challenge. Despite technical advancements, some users resist their avatars, while others seamlessly accept them as replacements for their bodies. We investigate the feasibility of pre-conditioning users to embrace their avatars prior to immersion. To do so, we propose a user preparation protocol involving three stages: first, users receive information about their avatar's identity, capabilities, and appearance. Next, they engage in a mental imagery exercise, envisioning themselves as their avatar. Finally, they physically impersonate their avatar's character through an acting exercise. Testing this protocol involved a study with 48 participants embodying an avatar representing the Hulk, with and without preparation. We could not find significant effects of the user preparation on the sense of embodiment, Proteus effects, or affective bond. This prompts further discussion on how users can be primed to accept their avatars as their own bodies, an idea introduced for the first time in this work. More details in the related paper 13.
8.4 Tangible interfaces for Railroad Traffic Monitoring
Participants: Maudeline Marlier, Maylis Lageste, Martin Hachet, Arnaud Prouzeau.
External collaborators: Olivier Gladin [Inria - SED Saclay],, Nicolas Renoir [SNCF].
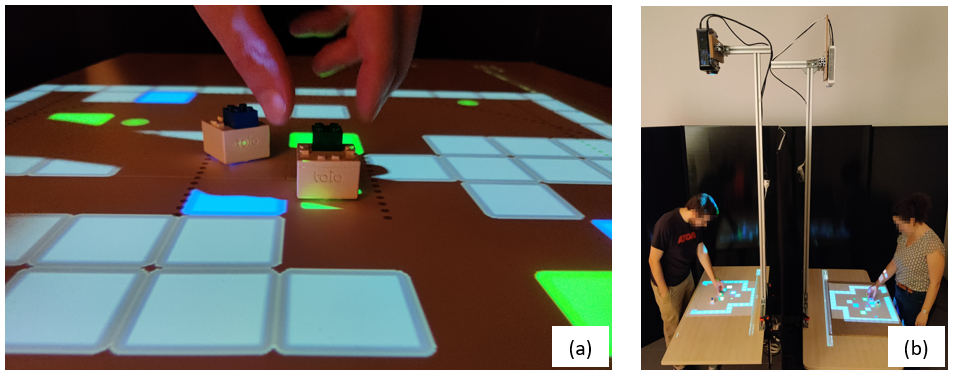
Two photos. On the left, a close-up photo of the prototype with the game projected and two tangible objects on the table. A hand is grabbing one of the objects. On the right, two people are conducting the experiment. They are face-to-face, each behind their own table, with a black element separating them so they cannot see each other. Above each table, a projector is fixed and projects a game. Both people seem to be playing the game.
Maudeline Marlier started her PhD in March 2022 at Potioc on a Cifre contract with the SNCF on the use of tangible interaction in railroad traffic monitoring control rooms. These control rooms are considered as high-stakes mixed-focus collaborative environments. Maintaining awareness of others' actions, in this type of environment, is crucial for effective teamwork. This is particularly true in case of crisis, where operators with different expertise need to collaborate to make critical decisions. In a first project, already started in 2023, We investigate the use of actuated tangible tokens on a tabletop to visualise and collaboratively explore different solutions to resolve incidents in railway control centres. We published these results at the ACM TEI 2024 conference 17.
In a second project, we focused on remote collaborative situations. For instance when 2 operators collaborate from two different control rooms, replicating the physical presence and visibility of co-workers' actions on a shared workspace becomes significantly more challenging. In this work, we explore the use of actuated tangible objects to enhance group awareness in synchronous remote collaboration, as they have the potential to better replicate the physical presence cues inherent in colocated settings. We conducted two user studies: the first assessed the detectability of actuated tangible objects compared to visual-only feedback during a cognitively demanding task, showing that tangibles were significantly more noticeable. The second study focused on collaborative problem-solving, testing if tangible feedback allowed users to perceive their partner’s actions and location without requiring focused attention. Qualitative findings suggest that tangibles can offer a more embodied and effective approach to maintaining awareness in remote collaborative environments. This work has been subimitted to the CHI 2025 conference.
8.5 Zoomable Empathetic Visualizations
Participants: Edwige Chauvergne, Martin Hachet, Arnaud Prouzeau, Pierre Dragicevic.
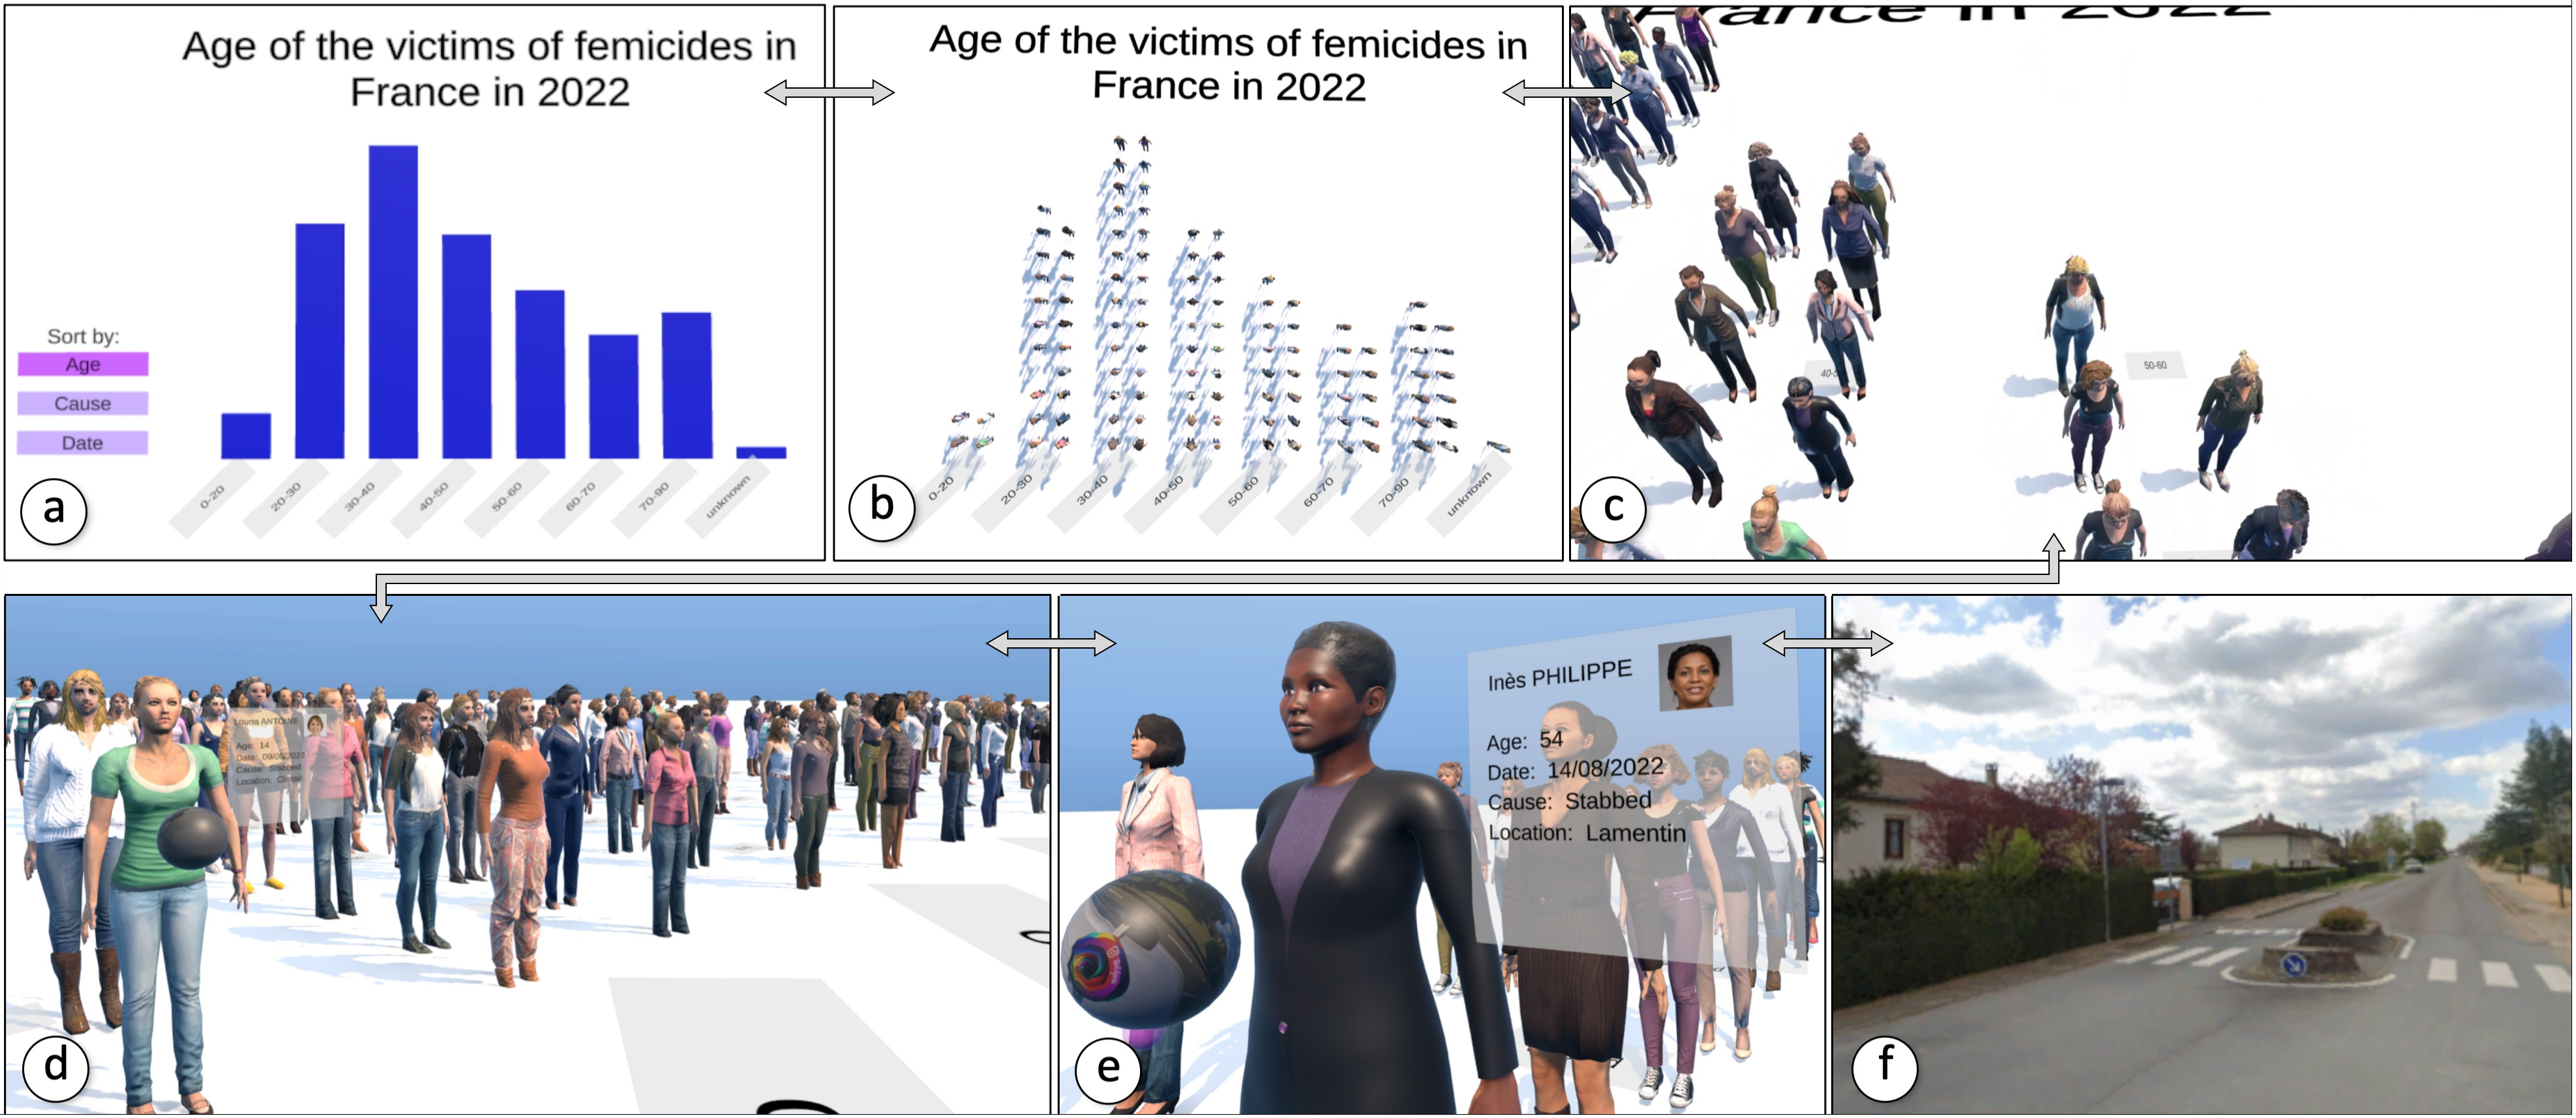
The figure is composed of six screenshots of the femicide use case. Figure 1.a depicts a bar chart titled "Age of the victims of femicides in France in 2022". On the left of the bar chart, there are three buttons to sort the data by age, cause or date. The bar chart is divided into eight categories (0-20, 20-30, 30-40, 40-50, 50-60, 60-70, 70-90, unknown). There is no ordinate. Here is the order of categories from the highest bar to the lowest: 30-40 > 20-30 > 40-50 > 50-60 > 70-90 > 60-70 > 0-20 > unknown. Figure 1.b: It is the same bar chart but the bars are made of individual avatars. Here are the number of avatars per bar: 0-20=4; 20-30=21; 30-40=28; 40-50=20; 50-60=15; 60-70=11; 70-90=13; unknown=1. Figure 1.c: It is a screenshot of the bar chart getting bigger and tipping over to the horizontal position. Figure 1.d: It is a screenshot from the user's view walking among the avatar. Avatars are the same size as the user. The closest avatar has a floating sphere in front of it and a floating panel on its right. Figure 1.e: It is a closest view of an avatar. On the floating sphere, we can see a picture of the Google Street View and the panel has a photo of the victim and the following information on it:"Inès PHILIPPE; Age: 54; Date: 14/08/2022; Cause: Stabbed; Location: Lamentin". Figure 1.f: It is a screenshot of a 360° google street view (the location of the femicide). It is a suburban area with middle-class houses.
Data visualization is a powerful tool for conveying statistical information, but when representing populations, it tends to hide individuals. In this work, we introduce zoomable empathetic visualizations (ZEVs), interactive experiences allowing users to smoothly navigate between abstract statistical visualizations and more qualitative, relatable representations focused on individuals. We present three use cases of ZEVs: visualizations of femicide victims, bicycle accidents, and conditions in farmed animal facilities. We then report on a qualitative user study that highlights opportunities for deeper understanding and emotional engagement, while pointing to areas for improvement and further refinement. The study also identifies general challenges, such as determining what is appropriate to show. In summary, ZEVs point toward new approaches for revealing the individuals behind the data. See 22
8.6 Immersive and Collaborative Practical Activities for Education
Participants: Juliette Le Meudec, Arnaud Prouzeau.
External collaborators: Anastasia Bezerianos [EPI ILDA - Inria Saclay].
Collaboration is widely recognized as a powerful way to foster student learning by boosting critical thinking, motivation, and understanding. However, effective teamwork requires conditions such as clear communication, shared resources, and socio-emotional cues—factors that can be difficult to replicate in Virtual Reality (VR). Nonetheless, VR offers unique advantages by allowing flexible workspaces and the possibility to combine face-to-face-style communication with customizable interaction modes. In this work, we explore the use of VR for practical activities and focused particularly on Collaborative Problem-Solving (CPS) tasks. In a first study, using a CPS we designed 16, we examined the effects of three VR workspace configurations on dyadic collaboration: (1) hearing and seeing a partner while sharing educational objects, (2) hearing and seeing a partner with no sharing, and (3) hearing only with no sharing. We are currently analysing the results and prepare a paper to be submitted at the conference ISMAR.
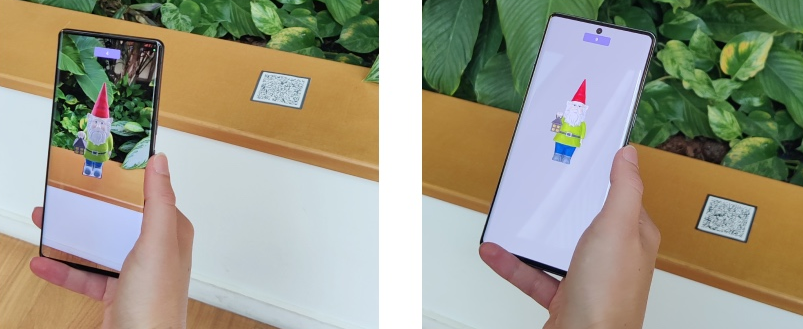
8.7 Augmented-Reality Waste Accumulation Visualizations (2024 update)
Participants: Ambre Assor, Pierre Dragicevic, Arnaud Prouzeau, Martin Hachet.
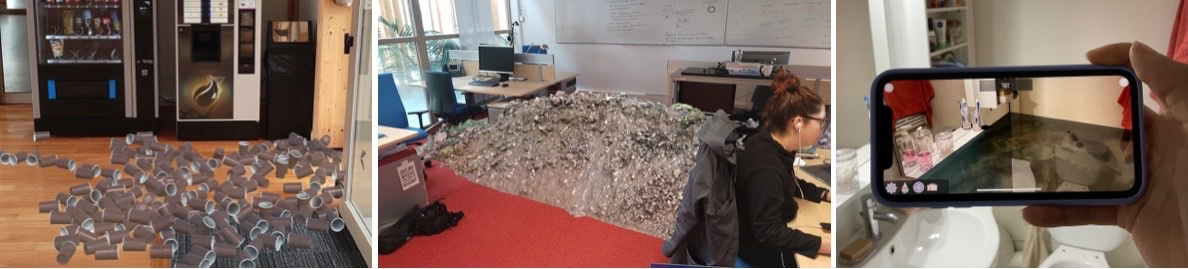
Virtual objects displayed in the real world.
The negative impact humans have on the environment is partly caused by thoughtless consumption leading to unnecessary waste. A likely contributing factor is the relative invisibility of waste: waste produced by individuals is either out of their sight or quickly taken away. Nevertheless, waste disposal systems sometimes break down, creating natural information displays of waste production that can have educational value. We take inspiration from such natural displays and introduce a class of situated visualizations we call Augmented-Reality Waste Accumulation Visualizations or ARwavs, which are literal representations of waste data embedded in users' familiar environment. We implemented examples of ARwavs (see Figure 7) and demonstrated them in feedback sessions with experts in pro-environmental behavior, and during a large tech exhibition event. We discuss general design principles and trade-offs for ARwavs. Finally, we conducted a study suggesting that ARwavs yield stronger emotional responses than non-immersive waste accumulation visualizations and plain numbers. This work was published in the ACM Journal on Computing and Sustainable Societies 5 and demonstrated during multiple events.
8.8 Designing Animated Transitions between Abstract and Concrete Immersive Visualizations
Participants: Ambre Assor, Martin Hachet, Arnaud Prouzeau, Pierre Dragicevic.
External collaborators: Michael McGuffin [ETS Montréal].
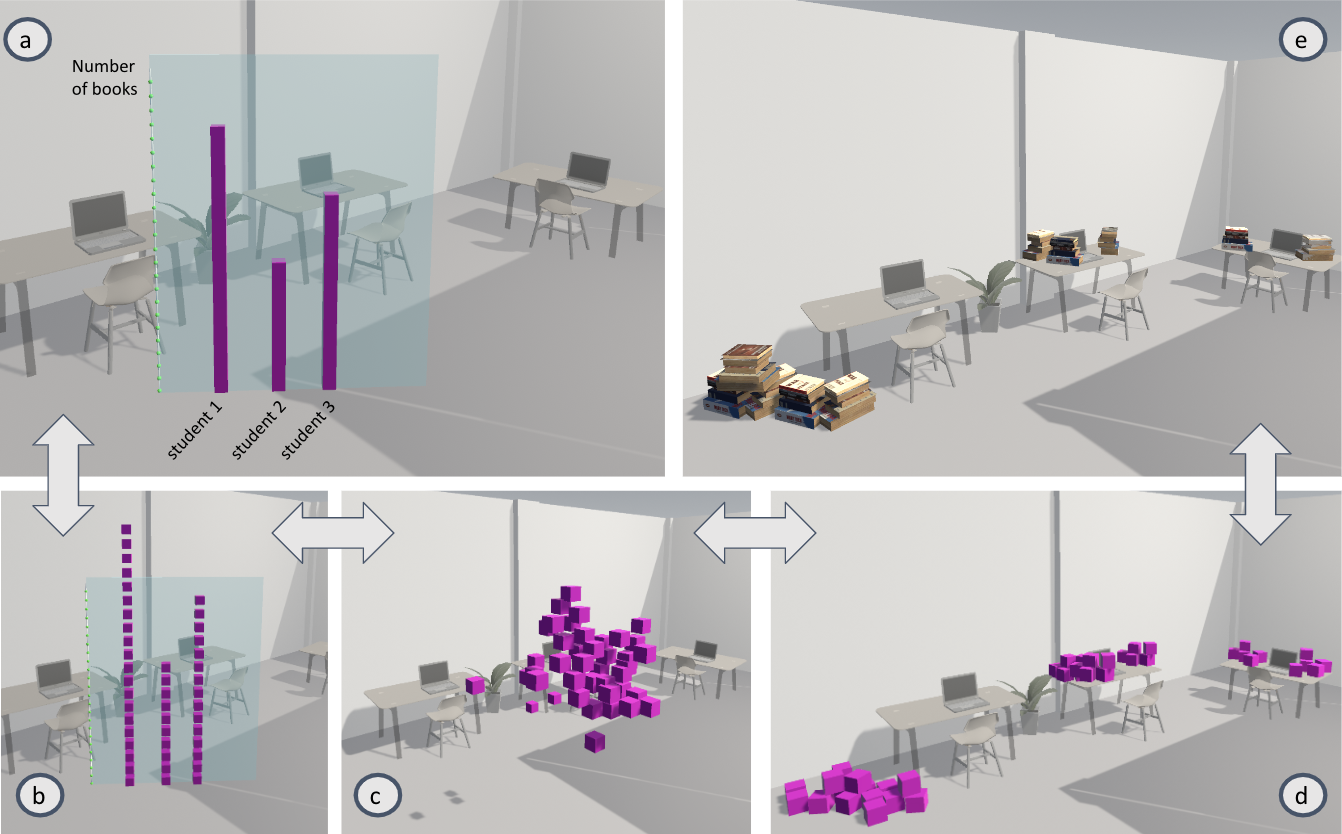
Animated transition between an abstract and a concrete visualization.
While data visualizations are typically abstract, there is a growing body of work around concrete visualizations, which use familiar objects to convey data (e.g., see sec:arwavs). Concrete visualizations can complement abstract ones, especially in immersive analytics, but it is unclear how to design smoothly animated transitions between these two kinds of representations. In collaboration with ETS Montréal, we investigated a design space of abstract and concrete visualizations, where animated transitions are pathways through the design space. We considered different ways to design animated transitions by staging and ordering the transformations along these axes. In a preregistered experiment conducted in virtual reality with 16 participants, we compared four types of animated transitions and found quantitative and qualitative evidence of the superiority of a specific staging approach over the simultaneous application of all transformations. This work has been published as a pre-print 24 and is currently under review at the ACM ToCHI journal.
8.9 The Effect of Augmented Reality on Involuntary Autobiographical Memory
Participants: Léana Petiot, Pierre Dragicevic.
External collaborators: Hélène Sauzéon [Inria Flowers].
Experiment stimuli
We know little about the impact of augmented reality (AR) on human cognition, particularly regarding involuntary autobiographical memory (IAM). IAMs are spontaneous recollections of personal events, ubiquitous in daily life but under-researched in both psychology and human-computer interaction. We examined the potential opportunities and risks of replacing conventional displays with AR to increase the likelihood of IAMs. We then conducted a study investigating whether stimuli displayed on the same mobile device using video-see-through AR are more likely to resurface than those shown with a simple 3D viewer. We found that AR elicits approximately twice as many IAMs in controlled settings with immediate re-exposure to contextual cues, but no measurable effect was found in everyday settings with delayed re-exposure. Therefore, AR can enhance IAMs, but its effects may be modest and short-lived in most cases. Nevertheless, future studies could reveal stronger effects of AR in other settings. This work has just been accepted to the ACM CHI conference and will be presented on April 2025. Supplementary material is available at OSF.
8.10 Exploring an Interactive Mini-World as a Proxy to Communicate Three Planetary Boundaries
Participants: Aymeric Ferron, Martin Hachet, Yvonne Jansen.
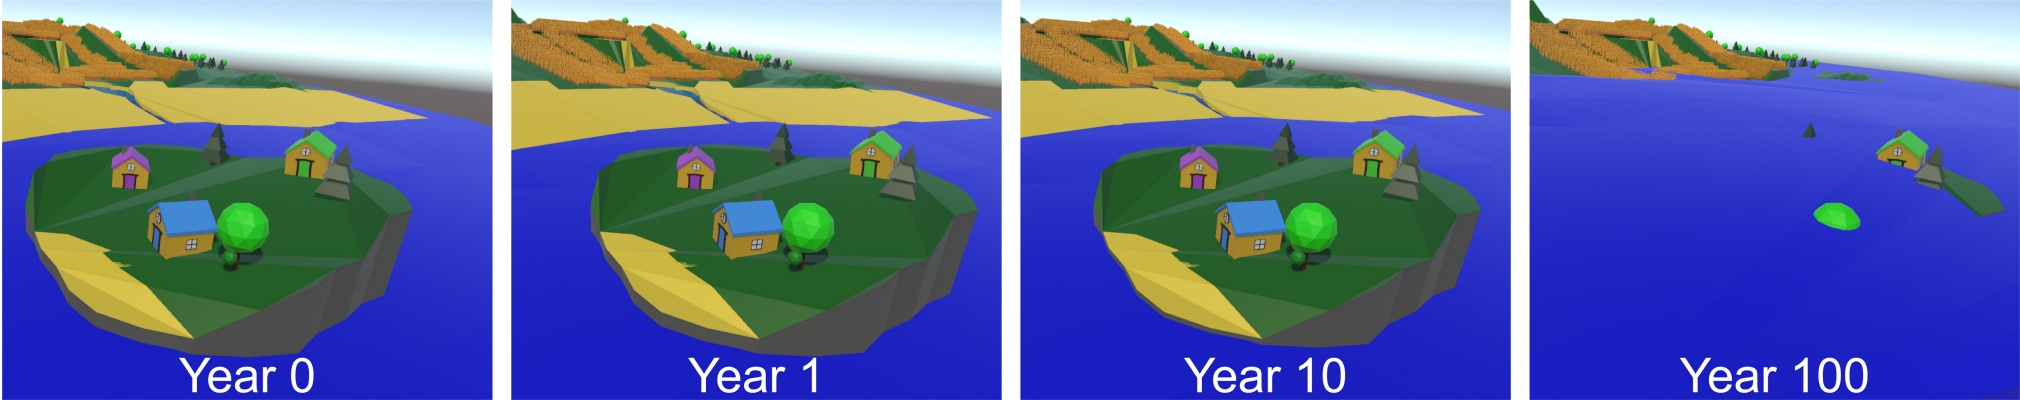
Exploranation to illustrate the equilibrium of carbon emissions through water levels
It can be difficult to extrapolate how decisions made in our daily lives impact the environment in the long term. While rich data and many calculator tools are freely available, comparing how different choices add up over time remains a complex and tedious task. In this work, we focused on the specific case of dietary habits and explore how long-term consequences of different dietary choices may be communicated using a mini-world as a proxy, where decisions of one person affect the entire mini-world. We focused on three planetary boundaries: climate change, global freshwater use and land system change. We gathered insights on strengths and shortcomings of our prototype from interviews conducted with three experts who tested it. The results suggest that the mini-world has potential for facilitating the comparison of environmental consequences linked to dietary habits. At the same time, numerous improvements have also been proposed. This work was accepted and presented at the AFIHM IHM conference in April 2024 12, accompanied by a demonstration during the demo night. presented on April 2025. An interactive prototype can be explored on this website.
8.11 Communicatig complex data and topics to wide audiences.
Participants: Benjamin Bach.
External collaborators: Jinrui Wang [University of Edinburgh], Xinhuan Shu [Newcastle University], Uta Hinrichs [University of Edinburgh].
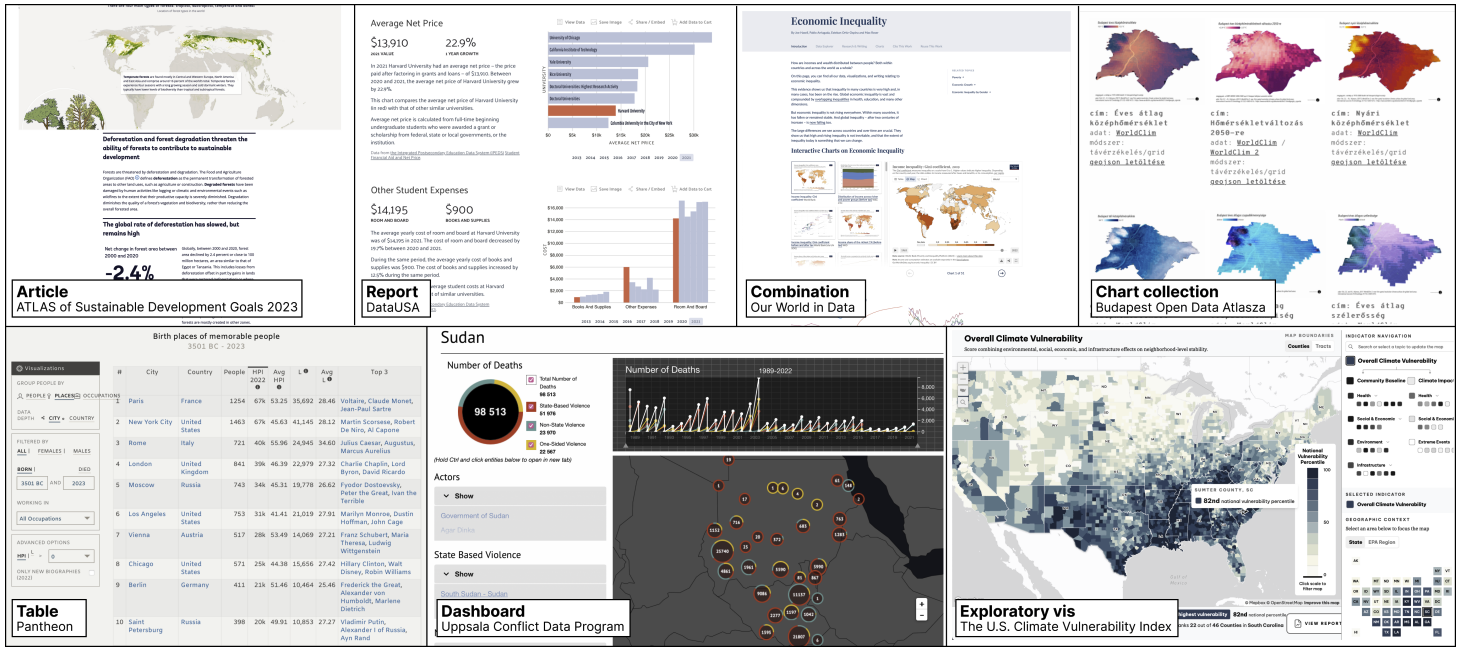
Examples of page types found across the atlas: dashboards, articles, automatically generated reports, etc.
This project defines, analyzes, and discusses the emerging genre of visualization atlases 21. In this project, we witness an increase in web-based, data-driven initiatives that call themselves “atlases” while explaining complex, contemporary issues through data and visualizations: climate change, sustainability, AI, or cultural discoveries. To understand how this emerging genre—alongside dashboards, data comics, or interactive visualization interfaces—can help make complex data sets understandable to wide audiences, we conducted a systematic analysis of 33 visualization atlases and semi-structured interviews with eight visualization atlas creators. Based on those results, we contribute (1) a definition of a visualization atlas as a compendium of (web) pages aimed at explaining and supporting exploration of data about a dedicated topic through data, visualizations and narration. (2) a set of design patterns of 8 design dimensions, (3) insights into the atlas creation from interviews and (4) the definition of 5 visualization atlas genres. We found that visualization atlases are unique in the way they combine i) exploratory visualization, ii) narrative elements from data-driven storytelling and iii) structured navigation mechanisms. They target a wide range of audiences with different levels of domain knowledge, acting as tools for study, communication, and discovery. We conclude with a discussion of current design practices and emerging questions around the ethics and potential real-world impact of visualization atlases, aimed to inform the design and study of visualization atlases.
8.12 Fostering visualization literacy through interactive and automatic approaches
Participants: Benjamin Bach.
External collaborators: Xinhuan Shu [Newcastle University], Alexis Pister [University of Edinburgh], Junxiu Yang [Zhejiang University], Fanny Chevalier [University of Toronto].
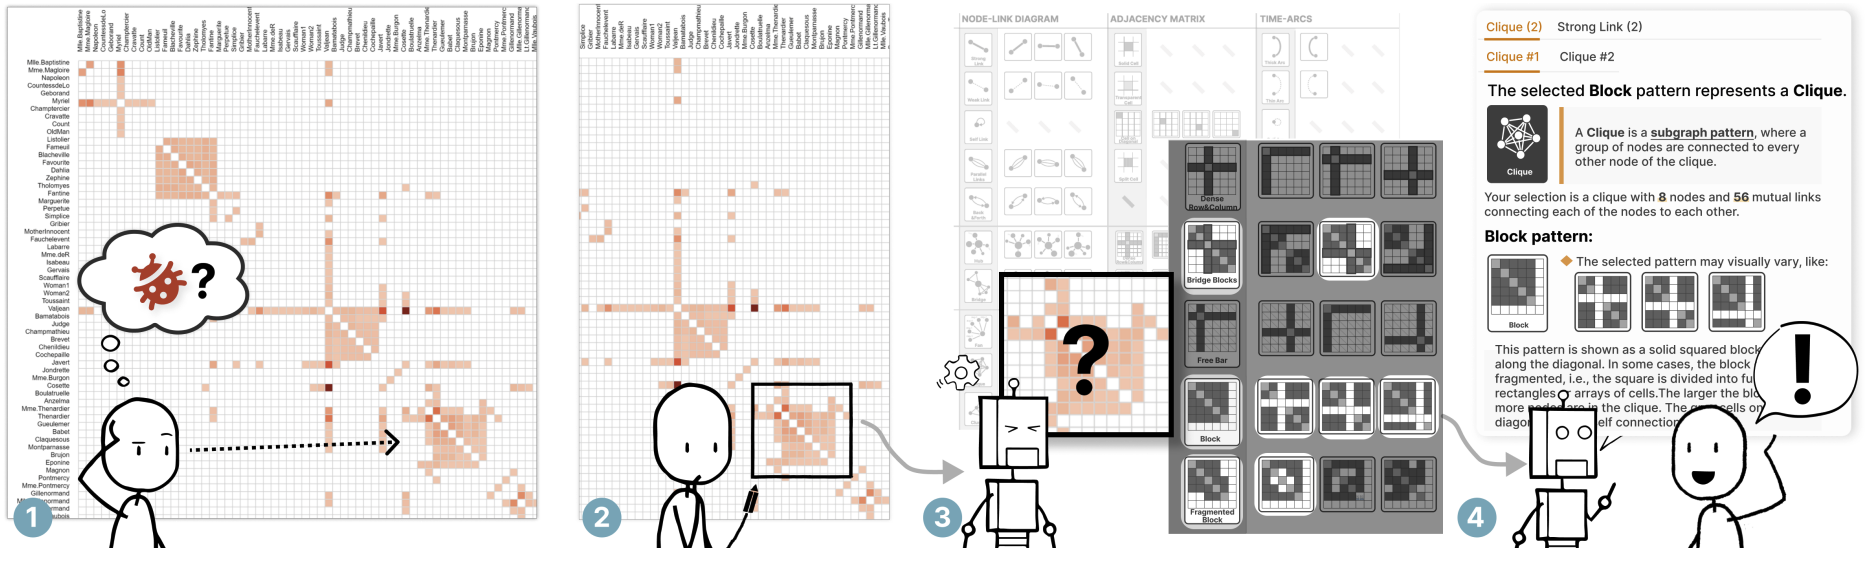
Figure exlpaining the general workflow of our pattern explainer tool: 1) Looking at the visualization, a user spots a visual pattern of interest, e.g. a “bug”-looking pattern in the matrix. To inquire about whether this pattern is meaningful, the user 2) selects the area. 3) Pattern Explainer then automatically mines the selection, against a dictionary of network motifs, and 4) provides the user with explanations of what underlying network patterns the visual pattern reveals.
While atlase are good in presenting and explaining data, there remains huge challenges in helping people to understand the visualizations themselves and follow the main insights. In one example, this project designs and investigates an interactive technique to explain visual patterns in network visualizations to analysts who do not understand these visualizations and who are learning to read them 20. Learning a visualization requires mastering its visual grammar and decoding information presented through visual marks, graphical encodings, and spatial configurations. To help people learn network visualization designs and extract meaningful information, we introduce the concept of interactive pattern explanation that allows viewers to select an arbitrary area in a visualization, then automatically mines the underlying data patterns, and explains both visual and data patterns present in the viewer’s selection. In a qualitative and a quantitative user study with a total of 32 participants, we compare interactive pattern explanations to textual-only and visual-only (cheatsheets) explanations. Our results show that interactive explanations increase learning of i) unfamiliar visualizations, ii) patterns in network science, and iii) the respective network terminology. These early findings inform reserch questions and simlar interactive techniques for data types other than networks.
8.13 Collaborative storytelling and understanding of complex topics
Participants: Benjamin Bach.
External collaborators: Tobias Kauer [University of Edinburgh], Derya Akbaba [Linköping University], Marian Dörk [Potsdam University of Applied Sciences].
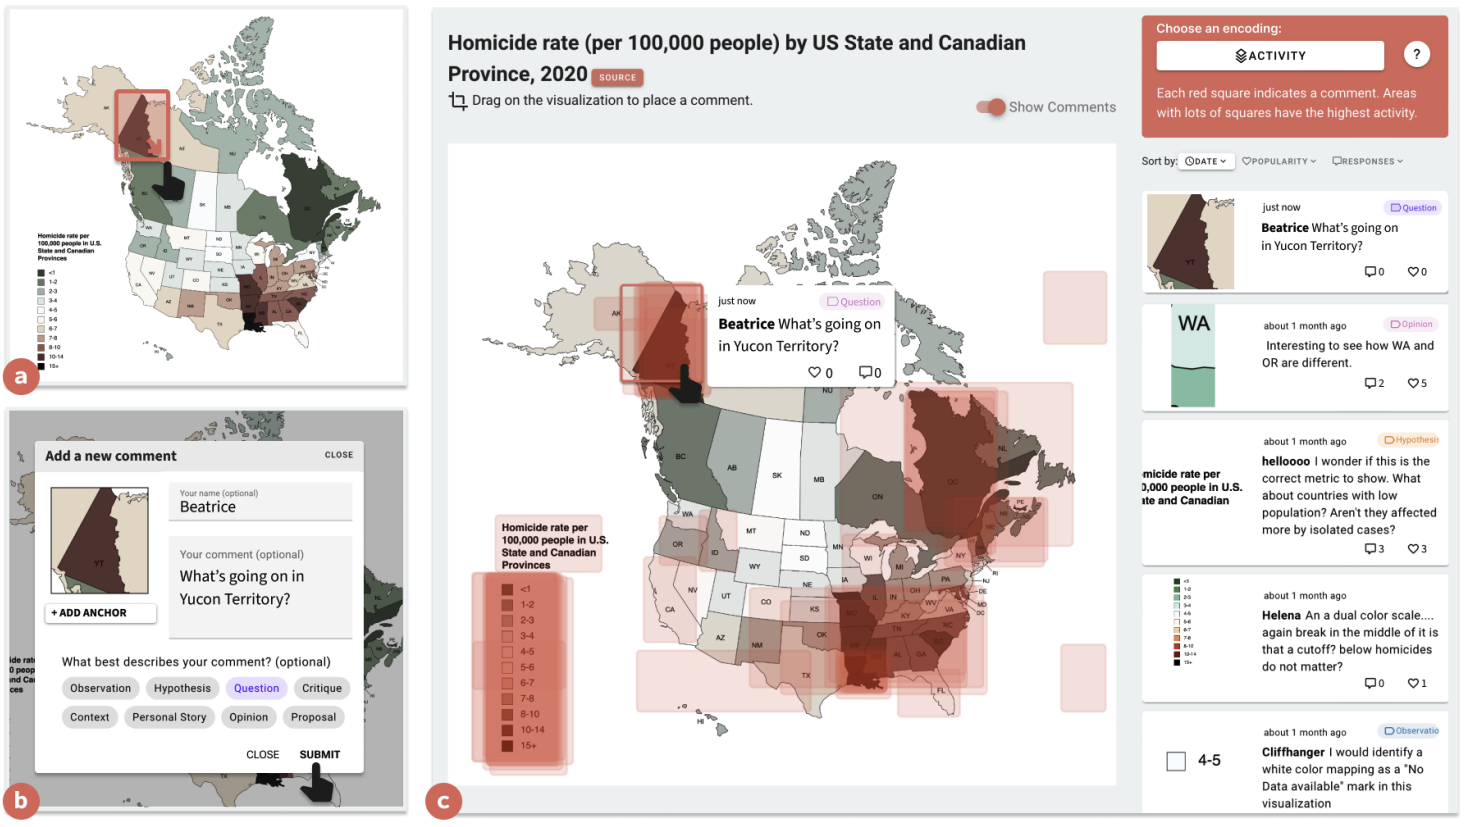
Figure showing the user interface of our tool: it shows a map visualization with annotations left by users. Each annotation is represented as a red semi-transparent box overlayed on the map. The position of these boxes frames the information relevant for the comment / the information the comment refers to.
Eventually, we are looking for means to involve and entice an audience to discuss and share insights about data—through the visualization. For example, we present discursive patinas, a technique to visualize discussions onto data visualizations, inspired by how people leave traces in the physical world 14. While data visualizations are widely discussed in online communities and social media, comments tend to be displayed separately from the visualization and we lack ways to relate these discussions back to the content of the visualization, e.g., to situate comments, explain visual patterns, or question assumptions. In our visualization annotation interface, users can designate areas within the visualization. Discursive patinas are made of overlaid visual marks (anchors), attached to textual comments with category labels, likes, and replies. By coloring and styling the anchors, a meta visualization emerges, showing what and where people comment and annotate the visualization. These patinas show regions of heavy discussions, recent commenting activity, and the distribution of questions, suggestions, or personal stories. We ran workshops with 90 students, domain experts, and visualization researchers to study how people use anchors to discuss visualizations and how patinas influence people’s understanding of the discussion. Our results show that discursive patinas improve the ability to navigate discussions and guide people to comments that help understand, contextualize, or scrutinize the visualization. We discuss the potential of anchors and patinas to support discursive engagements, including critical readings of visualizations, design feedback, and feminist approaches to data visualization.
8.14 Exploring Public Engagement with Scientific Information through Serious Game Design Workshops
Participants: Emilie Clément, Yvonne Jansen, Benjamin Bach.
External collaborators: Raphaëlle Bats [URFIST - Univ. Bordeaux], Mathilde Garnier [URFIST - Univ. Bordeaux].
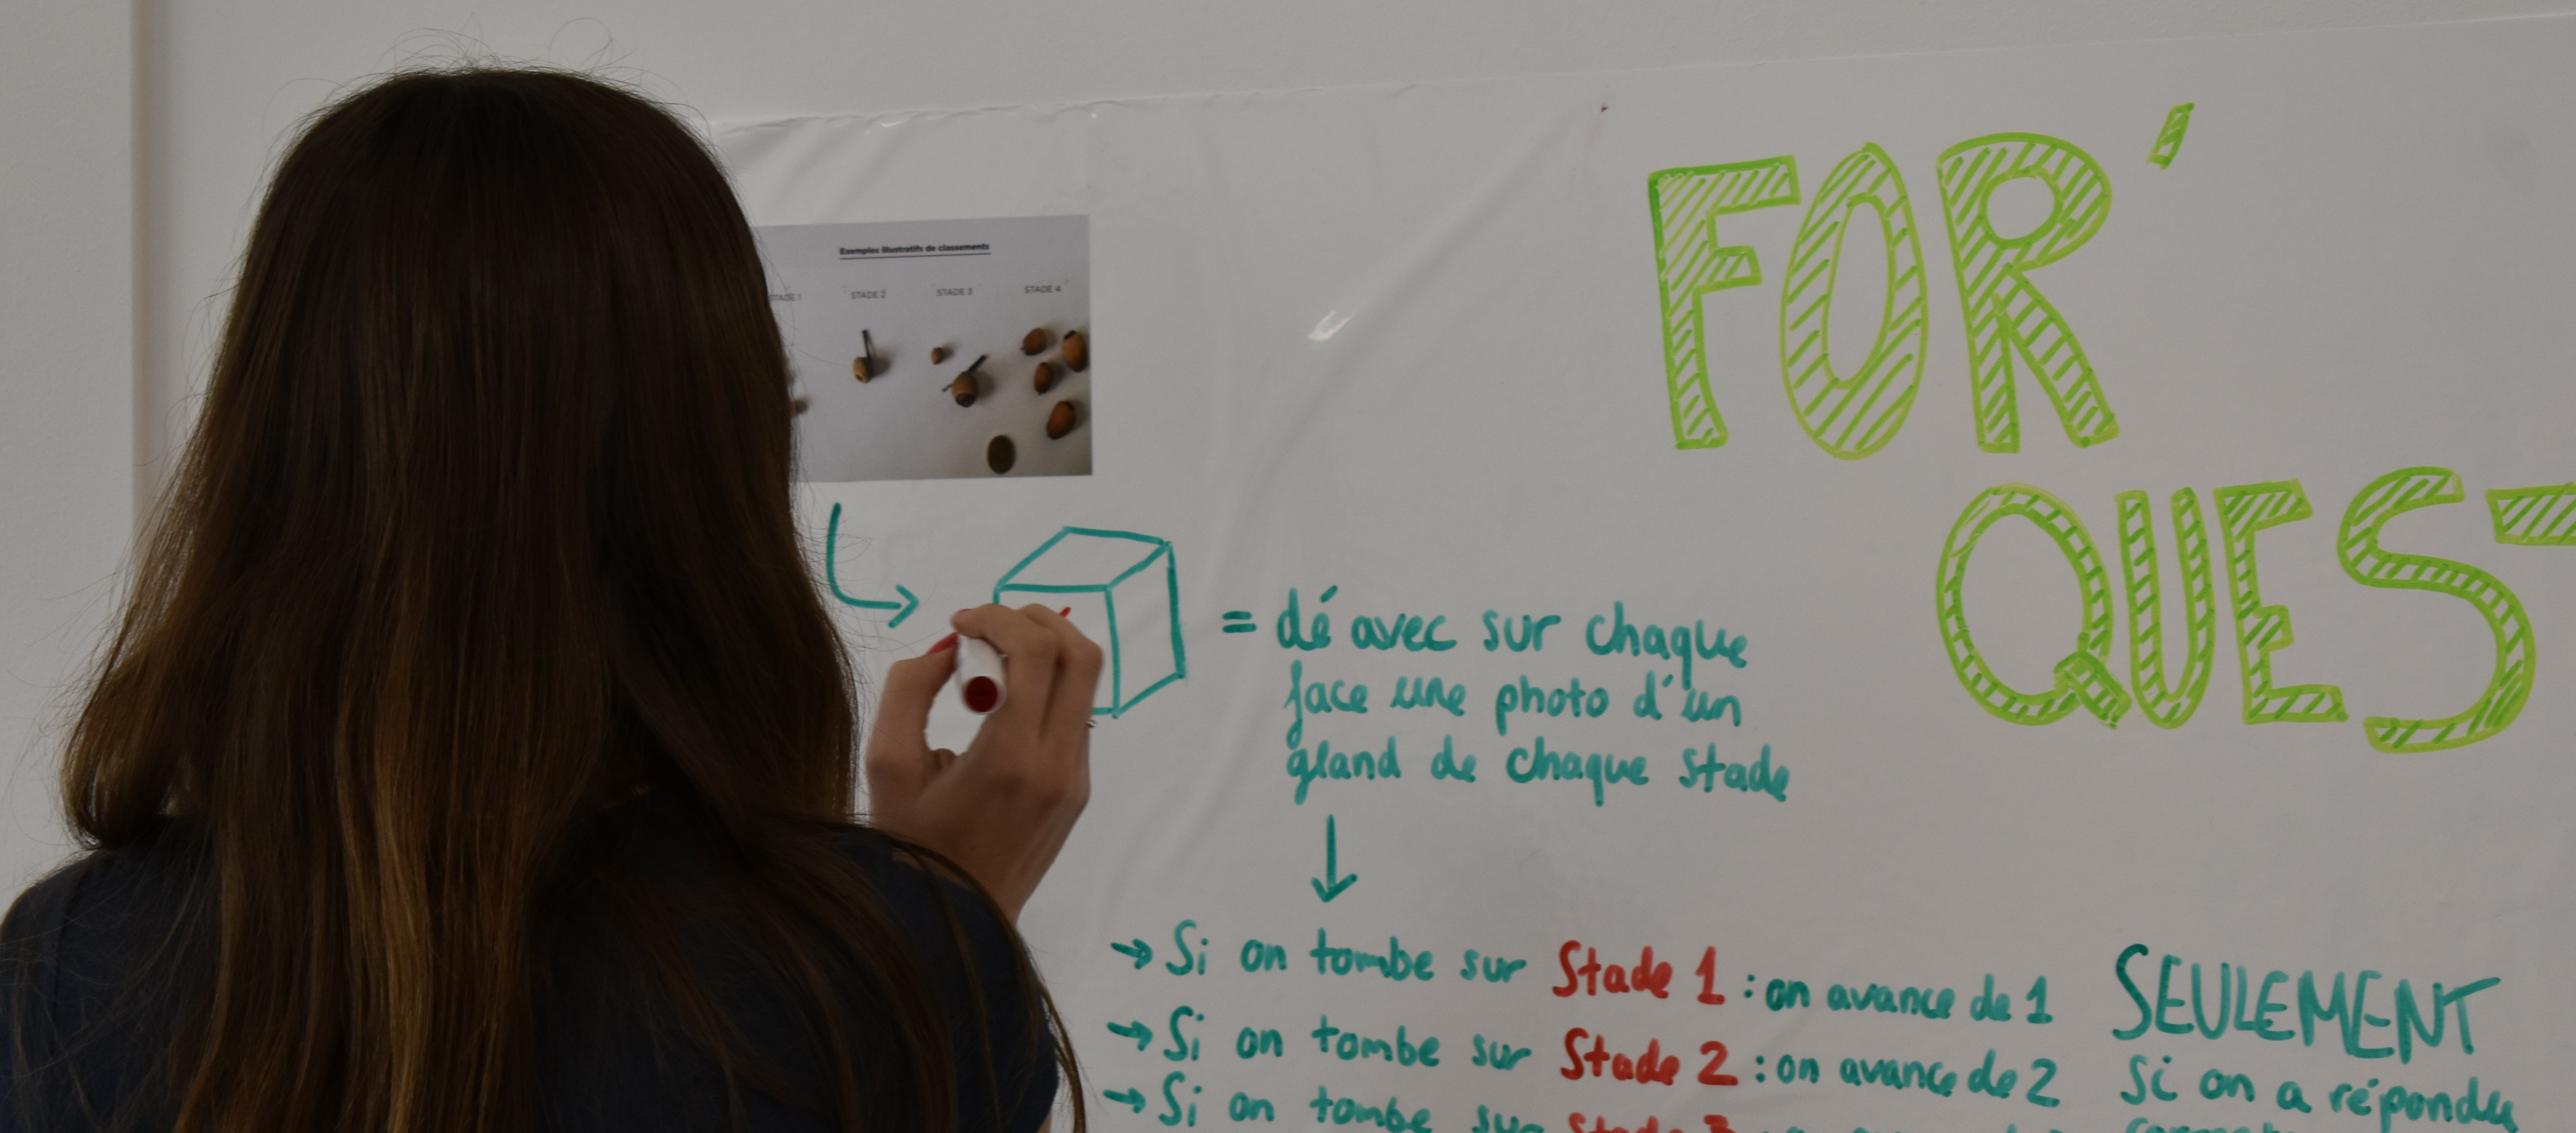
A person draws on a whiteboard
In the context of the Ecodoc project, we explored the use of Serious Game Design Workshops as a tool for engaging citizens in the dissemination of scientific knowledge to the public. Using research data on forest ecosystems and their dynamics, we ran four workshops which sought to bridge the gap between complex environmental information and public understanding. During these workshops, a total of 88 participants – all non-experts concerning forest ecosystems – created storyboards for 20 diverse game concepts which to varying degrees integrated scientific content into different types of gameplay. A preliminary analysis of the produced game concepts suggest that our workshops were able to foster creativity, enhance environmental education, and promote public engagement with scientific knowledge. However, challenges such as variability in participants' prior knowledge and workshop materials affected outcomes. We published a poster publication at TEI’25 28, in which we discuss future refinements and suggest methods to improve the educational and communicative potential of serious games workshops for scientific dissemination.
8.15 Animated Hypothetical Trips to Communicate Space-Based Temporal Uncertainty on Digital Maps
Participants: Morgane Koval, Yvonne Jansen.
External collaborators: Fanny Chévalier [University of Toronto].
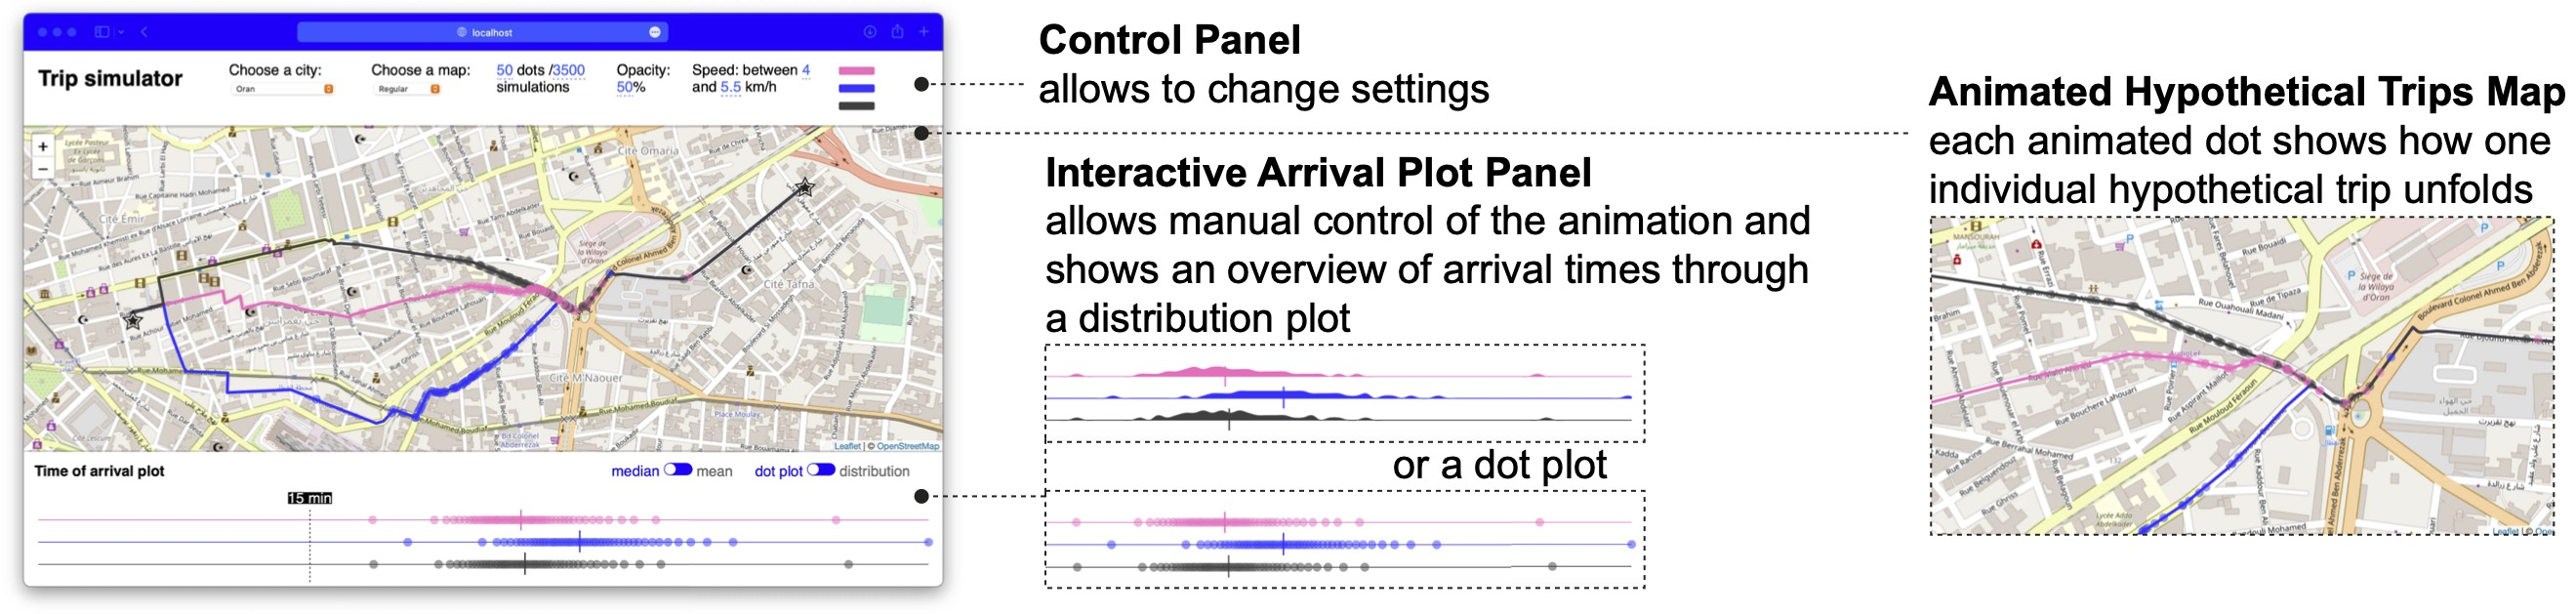
Overlaid uncertainty visualization on a map
In this work, we explored a novel approach to communicating plausible space-based temporal variability of travel durations. Digital maps most often only convey single numerical values as the estimated duration for a path and this piece of information does not account for the multiple scenarios hidden behind this point estimate, nor for the temporal uncertainty along the route (e.g., the likelihood of being slowed down at an intersection). We explored conveying this uncertainty by animating hypothetical trips onto maps in the form of moving dots along one or more paths. We conducted a study with 16 participants and observed that they were able to correctly extract and infer simple information from our uncertainty visualizations but that identifying moving dots’ changes in speed is a more complex task. We discuss design challenges and implications for future visualizations of space-based temporal uncertainty. This work was published in the journal TVCG 8 and presented at the PacificVIS conference in April 2024, where it received an honorable mention award. An interactive prototype can be explored on this website.
9 Bilateral contracts and grants with industry
9.1 Bilateral contracts with industry
SNCF - Cifre:
Participants: Maudeline Marlier, Arnaud Prouzeau, Martin Hachet.
- Duration: 2022-2025
- Local coordinator: Arnaud Prouzeau et Martin Hachet
- This collaboration with SNCF is around the PhD thesis (Cifre) of Maudeline Marlier. The objective is to rethink railway control rooms with interactive tabletop projections.
10 Partnerships and cooperations
10.1 National initiatives
ANR Project BeAware
:
Participants: Martin Hachet, Yvonne Jansen, Pierre Dragicevic, Arnaud Prouzeau, Fabien Lotte, Aymeric Ferron, Ambre Assor.
- Duration: 2023-2026
- Partners: CIRED, ESSEC
- Coordinator: Martin Hachet
- BeAware explores how augmented reality (AR) systems can reduce the spatial and temporal distance between people’s choices and their environmental impact. We design interactive visualizations that integrate concrete environmental consequences (e.g. waste accumulation, rare earth mining) directly into people’s surroundings. This interdisciplinary research will be informed and validated by incentivized and controlled behavioral economics experiments based on game-theoretical models, and be guided by real environmental data and scenarios
- website: BeAware
ANR Project EMBER
:
Participants: Pierre Dragicevic, Martin Hachet, Yvonne Jansen, Arnaud Prouzeau, Eugénie Brasier, Adrien Corn.
- Duration: 2020-2054
- Partners: Inria/AVIZ, Sorbonne Université
- Coordinator: Pierre Dragicevic
- The goal of the project is to study how embedding data into the physical world can help people to get insights into their own data. While the vast majority of data analysis and visualization takes place on desktop computers located far from the objects or locations the data refers to, in situated and embedded data visualizations, the data is directly visualized near the physical space, object, or person it refers to. This project has been extended to August 2025.
- website: Ember
ANR JCJC ICARE
:
Participants: Arnaud Prouzeau, Martin Hachet, Yvonne Jansen, Juliette Le Meudec.
- Duration: 2023-2026
- Partners: Inria/ILDa, Monash University, Queensland University
- Coordinator: Arnaud Prouzeau
- In this project, we explore the use of immersive technologies for collaborative learning. First in fully virtual reality environments and then in heterogeneous ones which include different types of devices (e.g. AR/VR, wall displays, desktops), we will design interaction techniques to improve how people collaborate in practical learning activities.
- website: ICARE
10.2 Regional initiatives
AeX Inria Live-It
:
Participants: Arnaud Prouzeau, Martin Hachet, Emma Tison, Claudia Krogmeier, Justin Dillmann.
- Duration: 2022-2024
- Partners: Université de Bordeaux - NeuroPsychology
- Coordinator: Arnaud Prouzeau and Martin Hachet
- In collaboration with colleagues in neuropsychology (Antoinette Prouteau), we are exploring how augmented reality can help to better explain schizophrenia and fight against stigmatization. This project is directly linked to Emma Tison's PhD thesis.
- website: LiveIt
AeX I-Am
:
Participants: Pierre Dragicevic, Leana Petiot.
- Duration: 2023-2026
- Partners: Flower team, Université de Bordeaux - Psychology
- Coordinator: Pierre Dragicevic and Hélène Sauzéon
- Title: The influence of augmented reality on autobiographical memory: a study of involuntary and false memories. Abstract: Although the Metaverse quickly raised a number of questions about its potential benefits and dangers for humans, augmented reality (AR) has made its way into our lives without raising such questions. The present program proposes to initiate this questioning by evaluating the impact of AR on our autobiographical memory, i.e. the memory that characterizes the "self" of each of us, by investigating the human and technical factors conducive to or, on the contrary, protective of memory biases.
- website: I-am
ECODOC
:
Participants: Martin Hachet, Yvonne Jansen, Emilie Clément, Benjamin Bach.
- Duration: 2023-2026
- Partners:
- URFIST
- INRAE
- Biogeco
- Centre Emile Durkheim
- Coordinator: Raphaëlle Bats
- Ecodoc is an applied research project that aims to design ways of promoting dialogue between scientific knowledge and other knowledge that can inform decision-making in the context of transition and adaptation.
- website: ECODOC
11 Dissemination
11.1 Promoting scientific activities
11.1.1 Scientific events: organisation
General chair, scientific chair
- TEI 2025 - General Chair (Yvonne Jansen )
Member of the organizing committees
- TEI 2025 - Local Chairs (Martin Hachet and Anne-Lise Pernel )
- TEI 2025 - Demo Chairs (Pierre Dragicevic and Arnaud Prouzeau )
- TEI 2025 - Hybrid Chair (Vincent Casamayou )
- "Para.CHI.Paris'24" (Aymeric Ferron )
- "RJC 2024 - Workshop JCJC" (Aymeric Ferron )
- "2024 IEEE VIS Workshop on Data Storytelling in an Era of Generative AI (GEN4DS) " (Leni Yang )
Student volonteers
- "IHM 2024" (Maudeline Marlier , Aymeric Ferron )
- “24th Prospectives en Cognition - CogGames” (Léana Petiot )
11.1.2 Scientific events: selection
Chair of conference program committees
- IEEE VIS 2024, Area Program Chair (Pierre Dragicevic )
Member of the conference program committees
- JIT 2024 (Martin Hachet )
- VIS 2024 - (Benjamin Bach )
- CHI 2025 - (Benjamin Bach )
- IEEE PacificVis 2025 Papers (Journal Track) (Leni Yang )
Reviewer
The members of Bivwac have participated to reviewing activities for conferences including ACM CHI (papers, LBW, case studies), VRST, EuroVis, ISMAR, Vis, Vis4Climate (IEEE Vis workshop), IEEE VR Doctoral Consortium, JIT, ACM TEI.
11.1.3 Journal
Member of the editorial boards
- ACM Transactions on Computer-Human Interaction (TOCHI) (Yvonne Jansen )
- Journal of Visualization and Interaction (JoVI) (Yvonne Jansen )
- Journal of Perceptual Imaging (JPI) (Pierre Dragicevic )
- Springer Human–Computer Interaction Series (HCIS) (Pierre Dragicevic )
- Journal of Visualization and Interaction (JoVI) advisory board (Pierre Dragicevic )
Reviewer - reviewing activities
The members of Bivwac have participated to reviewing activities for journals including IEEE TVCG, JPI, Psychological Science.
11.1.4 Invited talks
- Talk on SIGCHI Paris Chapter "Communicate data insights engagingly and immersively with visual data storytelling" (Leni ) Yang)
11.1.5 Research administration
- President "Commission Emplois de Recherche Inria Bordeaux" (Martin Hachet )
- Member of "Mission Jeunes Chercheurs" Inria (Martin Hachet )
- Member of the scientific council of LaBRI (Aymeric Ferron )
- Member of the council of the EDMI doctoral school (Martin Hachet and Aymeric Ferron )
- Member of the governing board of AFIHM, the French association for HCI research (link) (Aymeric Ferron )
- Co-leader of the Young Researchers Working Group of AFIHM, the French association for HCI research (link) (Aymeric Ferron )
- Elected Secretary of the AFoDIB, the association of computer science PhD students in Bordeaux (link) (Aymeric Ferron )
- Elected Secretary of AscoErgo, the association of cognitive science in Bordeaux (link) (Léana Petiot )
- Member of the Comité d'Éthique de la Recherche Université de Bordeaux (Pierre Dragicevic )
11.2 Teaching - Supervision - Juries
Master
- Master: Réalité Virtuelle, 12h eqTD, M2 Cognitive science, Université de Bordeaux (Martin Hachet )
- Master: Réalité virtuelle,interaction et applications à la santé, 5h eqTD, M1 Sciences Cognitives et Ergonomie, Université de Bordeaux (Léana Petiot )
- Master: Méthode clinique basée sur la complémentarité, 6h eqTD, M1 Neuropsychologie clinique, Université de Bordeaux (Emma Tison )
- Master: Supervision mémoire, 2 étudiant.e.s, 11h eqTD, M1 Neuropsychologie clinique, Université de Bordeaux (Emma Tison )
- Master: Recherche Scientifique, 3h eqTD, 3A ENSC, (Maudeline Marlier )
- Master: Réalités Virtuelles et Augmentées, 12h eqTD, M2 Image et Son, Université de Bordeaux (Vincent Casamayou )
- Master: Système de Gestion de Base de Données, 20h eqTD, 2A Filière Informatique, ENSEIRB-MATMECA (Bordeaux INP) (Aymeric Ferron )
- Master: Ergonomie Cognitive, 11h eqTD, M1 Sciences Cognitives et Ergonomie, Université de Bordeaux (Léana Petiot )
Supervision of Master projects
- Projet Informatique Individuel, 2 étudiant.e.s, 10h eqTD, 2A ENSC, (Maudeline Marlier )
- Projet de Fin d'Année, 6 étudiant.e.s, 7h eqTD, 2A ENSEIRB, (Maudeline Marlier )
- Projet de Fin d'Année, 4 étudiant.e.s,, 12h eqTD, M2 Image et Son, Université de Bordeaux (Juliette Le MeudecVincent Casamayou )
- Projet de Programmation, 6 étudiant.e.s, 10h eqTD, M1 Informatique, Université de Bordeaux (Aymeric Ferron )
Undergraduate
- Licence: Démarche de l'entretien et méthode de l'évaluation, 24h eqTD, L3 Psychologie, Université de Bordeaux (Emma Tison )
- Licence: Psychologie clinique et psychopathologie, 16h eqTD, L1 Psychologie, Université de Bordeaux (Emma Tison )
- Licence: Évaluation et certification des compétences numériques pour tous, 12h eqTD, Licence Pro Médiateur de santé pairs, Université de Bordeaux (Emma Tison )
- Licence: Méthode Scientifique, 20h eqTD, Licence 1 Informatique, Université de Bordeaux (Juliette Le Meudec )
- Licence: Epistémologie des Sciences, 8h eqTD, Licence 3 MIASHS, Université de Bordeaux (Juliette Le Meudec )
- Licence: Projet d'algorithmique et de programmation, 24h, 1A Filière Informatique, ENSEIRB-MATMECA (Bordeaux INP) (Aymeric Ferron )
- Licence: Découverte de la Recherche Scientifique, 2h, Licence 3 Informatique, Université de Bordeaux (Aymeric Ferron )
11.2.1 Supervision
PhD students supervision
- Edwige Chauvergne (Arnaud Prouzeau and Martin Hachet )
- Maudeline Marlier (Arnaud Prouzeau and Martin Hachet )
- Vincent Casamayou (Martin Hachet )
- Emma Tison (Martin Hachet )
- Juliette Le Meudec (Arnaud Prouzeau and Martin Hachet )
- Aymeric Ferron (Yvonne Jansen , Martin Hachet and Pierre Dragicevic )
- Valentin Edelsbrunner (Benjamin Bach )
- Sarah Schöttler (Benjamin Bach and Uta Hinrichs [University of Edinburgh])
- Tobias Kauer (Benjamin Bach and Marian Dörk [Potsdam University of Applied Sciences])
- Jinrui Wang (Benjamin Bach and Uta Hinrichs [University of Edinburgh])
- Mashael AlKadi (Benjamin Bach and Dragan Gasevic [Monash University])
- Lucy Havens (Benjamin Bach and Beatrix Alex [University of Edinburgh])
- Magdalena Boucher (Benjamin Bach and Wolfgang Aigner [University of Applied Sciences St. Pölten])
- Sarah Dunn (Benjamin Bach and Areti Manataki [University of St. Andrews])
- Rea Michalopoulou (Benjamin Bach and Joanne Williams [University of Edinburgh])
- Léana Petiot (Pierre Dragicevic )
Postdocs
- Claudia Krogmeier (Arnaud Prouzeau and Martin Hachet )
- Xinhuan Shu (Benjamin Bach )
- Leni Yang (Yvonne Jansen and Pierre Dragicevic )
Master students
- Emilie Clement (Yvonne Jansen and Martin Hachet )
- Joshua (Kan Yao) (Léana Petiot and Pierre Dragicevic )
11.2.2 Juries
PhD Jury
- Erwann Landais - 10 Dec. - President (Martin Hachet )
- Camille Truong Lallié - 5 Mar. - Rapporteur (Pierre Dragicevic )
HDR Juries
- Romain Giot - 8 Feb. - Examinateur (Pierre Dragicevic )
Suivi de thèse
- Pierre Vaslin (Pierre Dragicevic )
- Clément Truillet (Pierre Dragicevic )
- Panagiotis Tsiapkolis (Pierre )
- Erwan Normand (Martin Hachet )
- Marie-Sarah Desvaux (Martin Hachet )
11.3 Popularization
11.3.1 Productions (articles, videos, podcasts, serious games, ...)
- "Réalité virtuelle et santé mentale : exit le divan, place au casque ?" The Conversation (Emma Tison )
- "Des étudiants en santé dans la peau d’une personne ayant une schizophrénie, grâce à un casque de réalité augmentée", 20 minutes (Emma Tison )
- "Ma Thèse en 180 secondes : Immersion dans les troubles du spectre schizophrénique au moyen de la réalité augmentée". Communication orale pour “MT180, Finale de l’Université de Bordeaux”, Bordeaux, France link (Emma Tison )
- "Ma Thèse en 180 secondes : "Conception et mise en œuvre d’outils interactifs physico-numériques pour l’apprentissage de la physique quantique". Communication orale pour “MT180, Demi-Finale de l’Université de Bordeaux”, Bordeaux, France link (Vincent Casamayou )
- "Une minute avec...Aymeric Ferron" (link) (Aymeric Ferron )
11.3.2 Participation in Live events
- "Expériences de visualisation immersives" - Faire parler la Data, parler avec la Data - June 18 (Martin Hachet )
- "Décoder le monde au travers d’expériences interactives et immersives" - Echelles célestes sur le campus - Oct 22 (Martin Hachet )
- "Déstigmatiser la formation en santé mentale : utilisation de la réalité augmentée", Communication orale et atelier, 5 et 6 décembre 2024, Congrès Psy'Novons, Paris, France (Emma Tison )
- "Déstigmatiser la formation en santé mentale : utilisation de la réalité augmentée", Communication orale et démonstration, 18 novembre 2024, Journée régionale du C2RP, Bruges, France. (Emma Tison )
- "Déstigmatiser la formation en santé mentale : utilisation de la réalité augmentée", 15 novembre 2024, Journées Scientifiques de la Fedrha « Le handicap mental à tous les âges de la vie : vivre avec et l’accompagner », Bordeaux, France (Emma Tison )
- "Circuit scientifique : MT180", for pupils from 14 to 17, 10th of october (Emma Tison )
- "Nuit de la recherche 2024 : MT180", 27th of september, Cap Sciences, Bordeaux, France (Emma Tison , Vincent Casamayou )
- "MT180 SNCF", December 2024, Saint-Denis, France (Maudeline Marlier )
- "Nuit de la recherche 2024 : Speed Searching", for pupils aged from 11 to 14, 26th of september 2024, Cap Sciences, Bordeaux, France (Emma Tison )
- "Stand Laboratoires et démonstration", April 2024, Forum des Sciences Cognitives, Paris, France (Emma Tison )
- "Les Petits Débrouillards", October 2024, Bordeaux, France (Juliette Le Meudec , Vincent Casamayou , Aymeric Ferron , Adrien Corn )
- "Têtes Chercheuses", December 2024, Blaye, France (Juliette Le Meudec )
- "24th Prospectives en Cognition", November 2024, Bordeaux, France (Maudeline Marlier , Léana petiot )
- jury member for "Journée des stagiaire SNCF", July 2024, Saint-Denis, France (Maudeline Marlier )
- "Un scientifique, une classe : chiche !", 4 sessions d'une heure, October 2024, Saint Vincent de Tyrosse, France (Aymeric Ferron , Vincent Casamayou )
- "Les 24h de l'innovation pour la planète", April 2024, Biarritz, France (link), (Aymeric Ferron )
- Yvonne Jansen and Pierre Dragicevic maintain and update the list of physical visualizations and related artefacts (link), with 200+ visits per day.
- Comic on the Ember ANR Project (Pierre Dragicevic and Martin Hachet , together with Alice Decarpigny and Julien Joliclerc).
11.3.3 Others science outreach relevant activities
- "Echelles Celestes sur le Campus " exhibition (Martin Hachet )
12 Scientific production
12.1 Major publications
- 1 articleAugmented-Reality Waste Accumulation Visualizations.ACM Journal on Computing and Sustainable Societies211January 2024, 1-29HALDOI
- 2 articleAnimating Hypothetical Trips to Communicate Space-Based Temporal Uncertainty on Digital Maps.IEEE Transactions on Visualization and Computer GraphicsApril 2024, 1-11In press. HALDOI
- 3 inproceedingsLeveraging Augmented Reality for Understanding Schizophrenia -Design and Evaluation of a Dedicated Educational Tool.ISMAR 2024 - IEEE International Symposium on Mixed and Augmented RealitySeattle, United StatesOctober 2024HAL
- 4 inproceedingsExploring Interactions with Tangible and Actuated Tokens on a Shared Tabletop for Railway Traffic Management Control Centres.TEI 2025 - 19th International Conference on Tangible, Embedded, and Embodied InteractionTalence, France2025HALDOI
12.2 Publications of the year
International journals
International peer-reviewed conferences
Doctoral dissertations and habilitation theses
Reports & preprints
Other scientific publications