

Section: New Results
Scientific Visualization and scientific computing
Participants : Samuel Hornus, Bruno Jobard, Bruno Lévy, Romain Merland, Vincent Nivoliers, Jeanne Pellerin, Nicolas Ray, Dmitry Sokolov, Rhaleb Zayer.
|
|
-
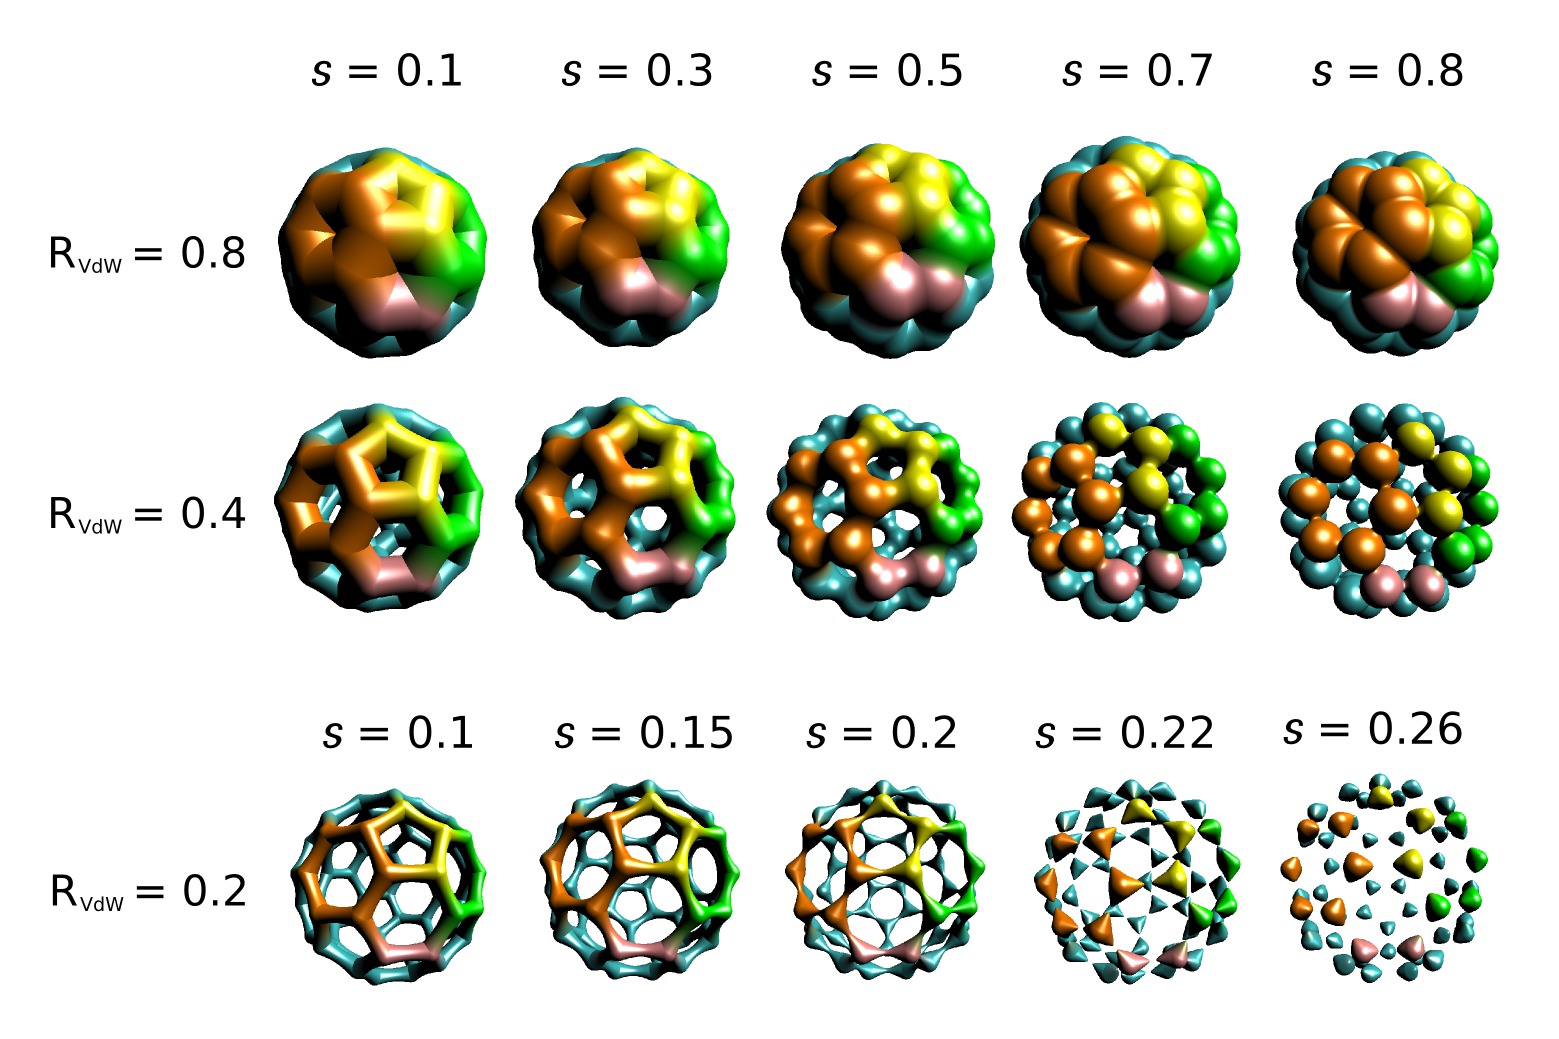
Molecular visualization: We continued the development of our Micromegas software, and developed several improvements [13] , [14] (see Figure 7 ).
-
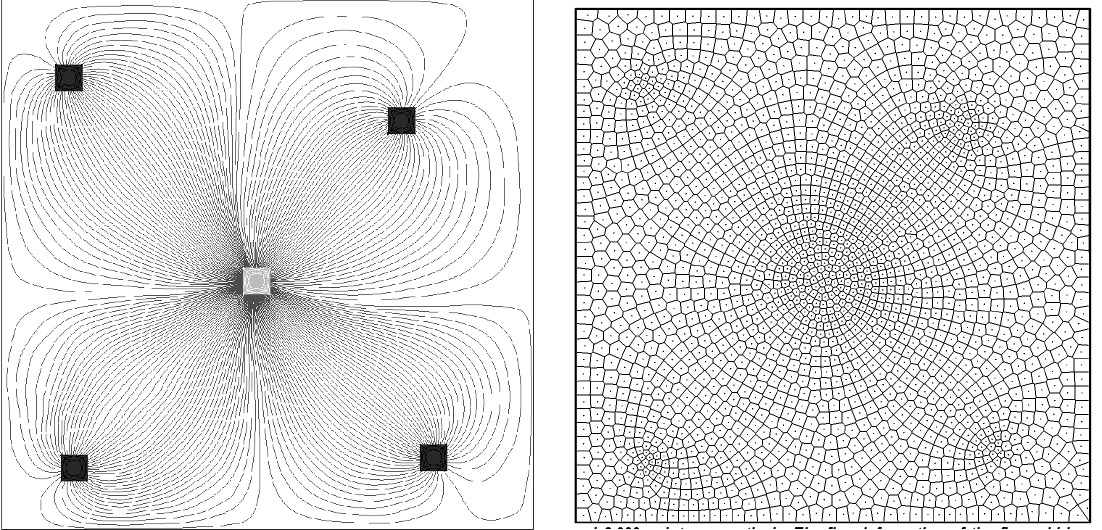
Geo-Modeling and geo-visualization: In the frame of our partnership with the Gocad consortium, we developped an evaluation of multi-valued data depiction techniques [22] . We also developed several meshing tools dedicated to the numerical simulation of oil exploitation [28] , [26] , [25] (see Figure 8 ).
-
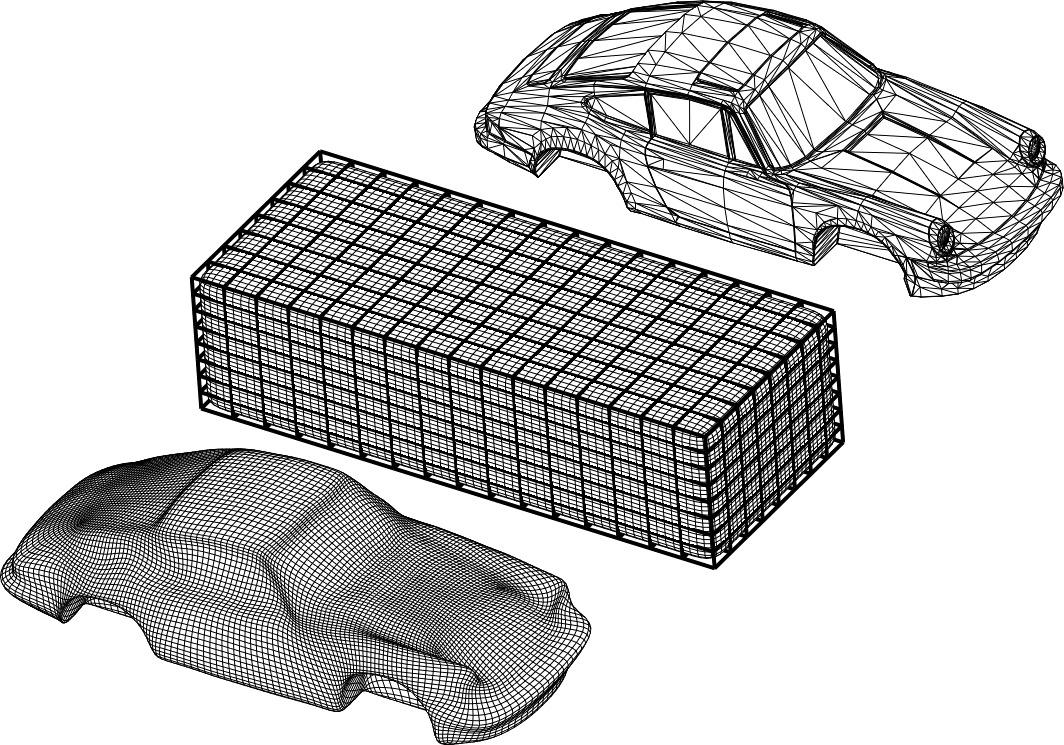
Reverse engineering: We developed methods to convert mesh surfaces and point sets into parametric splines, using either a global parameterization technique [18] or an approximation of surface-to-surface distance based on Voronoi diagrams [27] (see Figure 9 ).