Section: New Results
Analysis and modeling for compact representation and navigation
Joint projection/filling method for virtual view synthesis
Participants : Christine Guillemot, Vincent Jantet.
This study is carried out in collaboration with INSA/IETR (Luce Morin). Associated with a view synthesis method, a multi-view plus depth video allows the generation of virtual views of the scene from any viewpoint. Many algorithms have thus been developed to synthesize virtual views from one or several input views video plus depth data. These rendering algorithms are either based on Image-Based Rendering (IBR) techniques or Geometry-Based Rendering (GBR) techniques, according to the amount of 3D information they use. IBR techniques require limited geometric information to synthesize intermediate views and allow the generation of photo-realistic virtual views at the expense of virtual camera freedom. GBR techniques require detailed 3D models of the scene to synthesize arbitrary viewpoints (points of view). GBR techniques are sensitive to the accuracy of the 3D model, which is difficult to estimate from real multi-view videos. Depth-Image-Based Rendering (DIBR) techniques include hybrid rendering methods between IBR and GBR techniques. DIBR methods are based on warping equations, which project a reference view onto a virtual viewpoint. Each input view is defined by a "color" (or "texture") map and a "depth" map, which associates a depth value to each image pixel.
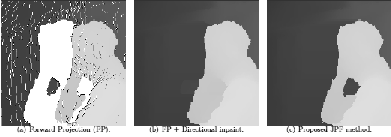
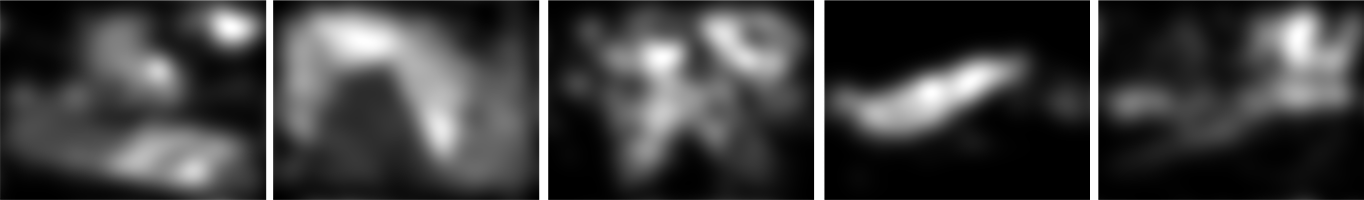
In classical DIBR schemes, the rendering proceeds in several distinct steps, each one designed to solve a specific problem. First, the input depth map is warped onto the virtual viewpoint. The obtained warped depth map contains disocclusions, cracks and ghosting artifacts. Second, this virtual depth map is filtered with a median filter, in order to remove the cracks, and then to dilate disocclusion areas on the background side, in order to avoid ghosting artifacts during view synthesis. Third, the filtered depth map is used in a backward warping to compute the color of each pixel of the virtual view. Fourth, this resulting depth map is inpainted, to fill in disocclusion areas. Finally, this complete depth map is used by a depth-aided inpainting algorithm to fill in disocclusions in the color map. However, all these steps are inter-dependent, and errors introduced by each one are amplified by the following one. Connectivity information is lost during the first projection step, as shown in Fig. 2 . Without this connectivity information, every inpainting method fails to fill in background disocclusions if the disoccluded area is surrounded by foreground objects. This case may happen each time a foreground object is not convex, and contains holes, as shown in Fig. 2 -(a). As a result, depth-aided inpainting uses wrong foreground patches to fill in background disocclusions, producing annoying artifacts, as shown in Fig. 2 -(b).
We have developed two DIBR techniques, both based on a novel forward projection technique, called the Joint Projection Filling (JPF) method [16] . The JPF method performs forward projection, using connectivity information to fill in disocclusions in a single step. The first proposed DIBR method is designed to extrapolate virtual views from a single input view plus depth video sequence. The synthesis of virtual depth maps by the JPF method avoids the use of dedicated filtering and inpainting processes and leads to synthsized depth maps of higher quality. The second proposed DIBR method is designed to interpolate intermediate views from multiple input view plus depth sequences. This interpolation method uses the Floating Texture approach to register multiple inputs view plus depth sequences before blending. The JPF method fills in disocclusion areas during the projection, to ensure that geometrical structures are well preserved. The method uses the occlusion-compatible ordering presented by McMillan, which uses epipolar geometry to select a pixel scanning order.The occlusion-compatible ordering is used to handle disocclusions gracefully. Cracks are filled in by interpolation of neighboring pixels, whereas disocclusions are only filled in by background pixels. This technique can also be used with non-rectified views, avoiding prior creation of parallax maps.
|

2D/3D image inpainting for virtual view synthesis
Participants : Josselin Gauthier, Christine Guillemot, Mouid Keskes, Olivier Le Meur.
Inpainting methods play an important role in a wide range of applications. Removing text and advertisements (such as logos), removing undesired objects, noise reduction and image reconstruction from incomplete data are the key applications of inpainting methods. Algorithms can be classified into two categories: PDE (Partial Derivative Equation)-based schemes and examplar-based schemes. The former uses diffusion schemes in order to propagate structures in a given direction. Their drawback is the introduction of blur due to diffusion. The latter relies on the sampling and the copying of texture from the known parts of the picture.
We have proposed a novel inpainting algorithm combining the advantages of both aforementionned methods. As in Criminisi et al's approach (Criminisi et al., Region filling and object removal by examplar-based image inpainting, IEEE Trans. On Image Processing, vol. 13, pp. 1200-1212, 2004), the proposed method involves two steps: first, a filling order is defined to favor the propagation of structure in the isophote direction. Second, a template matching is performed in order to find the best candidates to fill in the hole. Compared to previous approaches, the main contributions concern the use of structure tensors to define the filling order instead of field gradients. The structure tensor is defined as follow:
is the sum of the scalar structure tensors of each image channel (). Information about local geometry can be deduced by computing the eigenvalues and eigenvectors of . The local vector geometry is computed from the structure tensor . Its eigenvectors () define an oriented orthogonal basis and its eigenvalues define the amount of structure variation. is the orientation with the highest fluctuations (orthogonal to the image contours), and gives the preferred local orientation. This eigenvector (having the smallest eigenvalue) indicates the isophote orientation. The use of structure tensor allows to retrieve a more coherent local geometry. The computation of the filling order as proposed by Criminisi et al is then replaced by a term coming from PDE-based schemes, called Coherence Enhancing Diffusion. The use of structure tensor in an examplar-based approach leads to a more robust algorithm that visually improves the quality of the inpainted areas.
Additionnaly the simple template matching originally used in previous methods has been improved by using a K-nearest neighbor approach. The weigths of the linear combination of the first best candidate are adjusted by taking into account that all candidate patches are not equally reliable. Note that the number is also locally adjusted in function of the local spatial complexity.
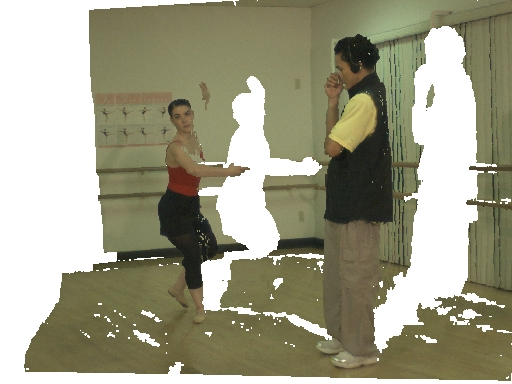
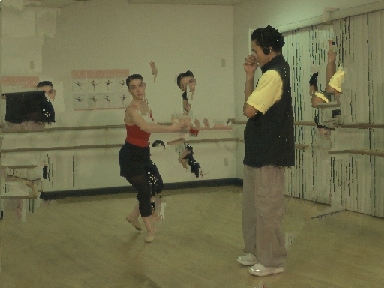
The 2D inpainting algorithm described above has been extended to deal with 3D content. In this work the goal is to synthesize novel views directly from the original images. Image-based rendering (IBR) is commonly used to render a virtual view. It generates a nearby viewpoint image by projecting a point from the reference view to the virtual view using the depth data. However, when the viewpoint is shifted, occluded regions in the original view point are dissoccluded. Handling these disocclusions (holes) is a difficult problem. We propose to use an extension of the 2D inpainting method to fill in these holes. For this goal, we have modified the computation of the structure tensor by adding the depth information. Equation (2 ) is simply modified as follow:
where represents the depth map. As previously, the tensor is used to compute the filling order. A directional term is also included in order to favor a filling direction. Specifically, when the viewpoint is shifted from left to right in the horizontal direction, occluded regions in the left image appear in the right image around the right side of the object. Therefore, it is recommended to start the filling from the right to the left. This filling is performed by a modified template matching using texture information as well as depth data. Figure 3 illustrates the inpainting quality for different approaches.
|

Computational modelling of visual attention
Participants : Josselin Gauthier, Olivier Le Meur.
Eye-movement study:
In 2011, we have investigated whether two populations of visual fixation exist in 2D context. The question is simple: do all visual fixations have the same role in the free viewing of natural scenes? Recent studies suggest that there are at least two types of visual fixations: focal and ambient fixations. The former is believed to be used to inspect local areas accurately, whereas the latter is used to obtain the context of the scene.
From a collaboration with Technicolor (P. Guillotel and C. Chamaret) and LUTIN (T. Baccino), we found new evidence to support a focal-ambient dichotomy. Our results published in the journal i-Perception [14] indicate that the determining factor to classify the visual fixations is the saccade amplitude. We proposed an automatic system to cluster visual fixations in two groups using four types of natural scene images. From this automatic classification, the terms focal saliency map and ambient saliency map have been introduced. The dependence on the low-level visual features and the time course of these two kinds of visual fixations were examined. Our results demonstrate that there is an interplay between both fixation populations and that focal fixations are more dependent on low-level visual features than ambient fixations. These results might have a strong impact on both the computational modelling of visual attention and their performance assessment.
A second study related to eye-movement dealt with the role of the binocular disparity depth cue in the deployment of visual attention. To address this point, we compared eye tracking data recorded while observers viewed natural images in 2D and 3D conditions. The influence of disparity on the inter-observers congruency, saliency, center and depth bias was first examined. Results show that visual exploration in depth layer detection task is affected by the binocular disparity. In particular, participants tend to look first at closer areas just after the stimuli onset with the introduction of disparity, and then direct their gaze to more widespread locations. Our results has been submitted in the journal Cognitive Computation.
Model of visual attention:
Since 1998 with the publication of the influential work of Itti, Kock and Niebur (Itti et al, A model for saliency-based visual attention for rapid scene analysis, IEEE Trans. on PAMI, vol. 20, pp. 1254-1259, 1998), the computational modelling of the visual attention has known an increasing interest. The former models only used the low-level visual features for getting a saliency map. They perform well in a number of cases in predicting where an observer would look at. However, to improve the quality of the prediction, it seems unavoidable to use high-level information in order to account for visual deployment.
This work aims at designing a computationnal model mixing low-level and high-level features. Among the different factors influencing our gaze, we have focused our works on two cues: the dominant depth and the horizon line position. The dominant depth and the spatial position of the horizon line were inferred from the low-level visual features. A training database has been set up to perform a learning. Results indicate that the proposed model outperforms state-of-the-art models [37] .
From behavioual studies on eye-movement in a 3D context, we have proposed a model of visual attention able to predict saliency of 3D pictures. The method developped aims at using the depth cue, the central bias and the low-level visual features. The predicted saliency is obtained by linearly combining these cues. The weights of the linear combination are learnt from a training database and are time-dependent. This study is under revision in the journal Cognitive Computation.
Predicting the inter-observer visual congruency:
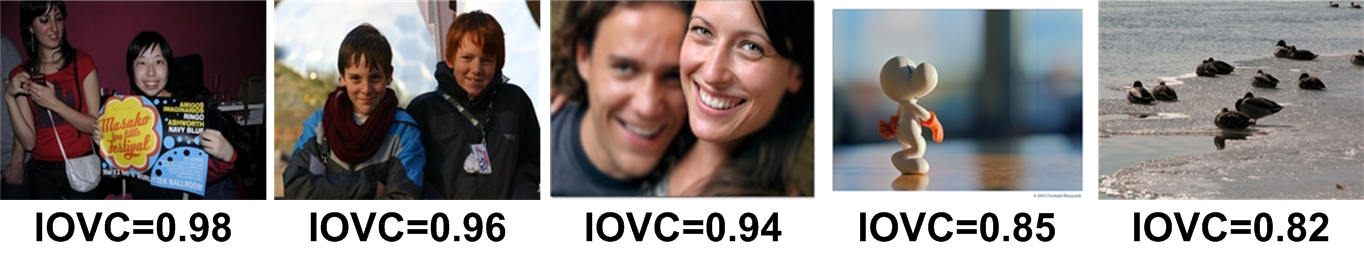
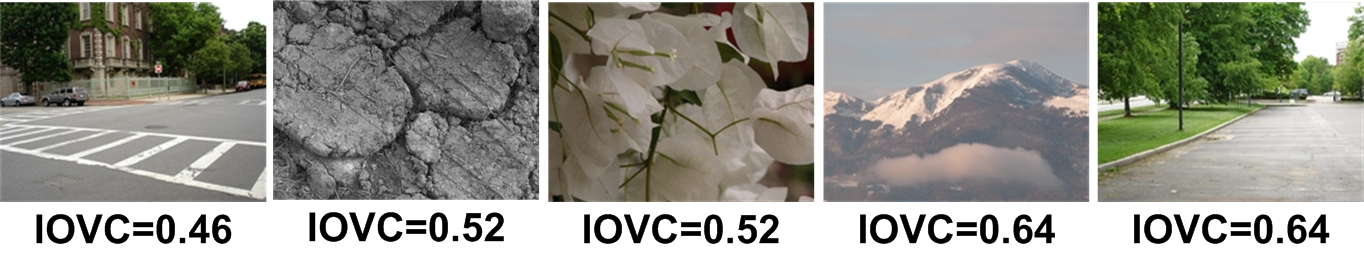
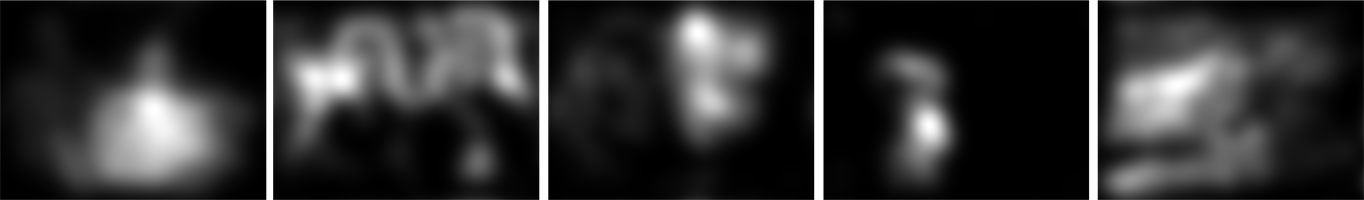
This work aims at predicting the inter-observer visual congruency (IOVC), indicating the congruence or the variability among different subjects looking at the same image [35] . Predicting this congruence is of interest for image processing applications where the visual perception of a picture matters such as website design, advertisement, etc. We proposed a computational model of the IOVC. This new model is a mixture of low-level visual features extracted from the input picture. Model's parameters are learned by using a large eye-tracking database. In this study, we also proposed a new scheme to compute the depth of field of a picture. Finally, once the training and the feature extraction have been carried out, a score ranging from 0 (minimal congruency) to 1 (maximal congruency) is computed. A value of 1 indicates that observers would focus on the same locations and suggests that the picture presents strong locations of interest. To illustrate the interest of the proposed model, we have used it to automatically rank personalized photograph. Figure 4 illustrates the proposed approach.
|
Visual cues analysis and modelling
Participants : Safa Cherigui, Christine Guillemot.
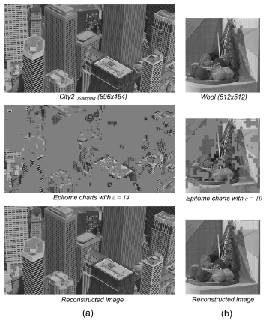
Thiw work is carried out in collaboration with Technicolor (D. Thoreau, Ph. Guillotel, P. Perez) and aims at designing a compresion algorithm based on the concept of epitomes. An epitome is a condensed representation of an image (or a video) signal containing the essence of the textural properties of this image. Different forms of epitomes have been proposed, such as a patch-based probability model learned either from still image patches or from space-time texture cubes taken from the input video. These probability models together with appropriate inference algorithms, are useful for content analysis inpainting or super-resolution. Another family of approaches makes use of computer vision techniques, like the KLT tracking algorithm, in order to recover self similarities within and across images. In parallel, another type of approach consists in extracting epitome-like signatures from images using sparse coding and dictionary learning.
The method developed aims at tracking self-similarities within an image using a block matching (BM) algorithm [25] . The epitome is constructed from disjoint pieces of texture (“epitome charts”) taken from the original image and a transform map which contains translational parameters (see Fig.5 -middle row). Those parameters keep track of the correspondences between each block of the input image and a block of the epitome. An Intra image compression scheme based on the epitome has been developed showing a rate saving of up to 12