

Section: New Results
Multiscale topological properties of functional brain networks during motor imagery after stroke
Participants : Fabrizio de Vico Fallani [Correspondant] , Floriana Pichiorri, Giovani Morone, Marco Molinari, Fabio Babiloni, Febo Cincotti, Donatella Mattia.
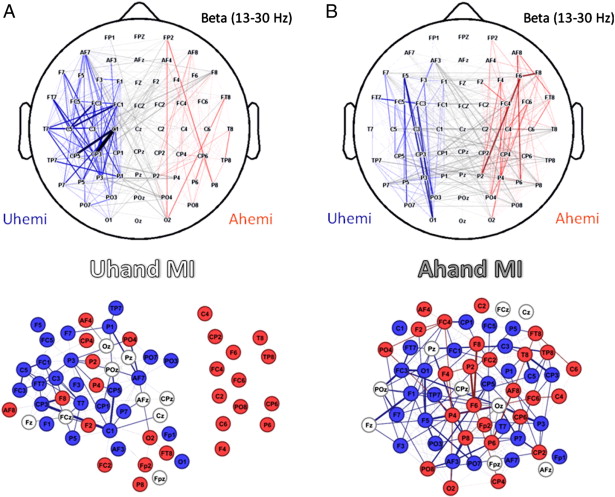
In recent years, network analyses have been used to evaluate brain reorganization following stroke. However, many studies have often focused on single topological scales, leading to an incomplete model of how focal brain lesions affect multiple network properties simultaneously and how changes on smaller scales influence those on larger scales. In an EEG-based experiment on the performance of hand motor imagery (MI) in 20 patients with unilateral stroke, we observed that the anatomic lesion affects the functional brain network on multiple levels. In the beta (13–30 Hz) frequency band, the MI of the affected hand (Ahand) elicited a significantly lower smallworldness and local efficiency (Eloc) versus the unaffected hand (Uhand). Notably, the abnormal reduction in Eloc significantly depended on the increase in interhemispheric connectivity, which was in turn determined primarily by the rise of regional connectivity in the parieto-occipital sites of the affected hemisphere. Further, in contrast to the Uhand MI, in which significantly high connectivity was observed for the contralateral sensorimotor regions of the unaffected hemisphere, the regions with increased connectivity during the Ahand MI lay in the frontal and parietal regions of the contralaterally affected hemisphere. Finally, the overall sensorimotor function of our patients, as measured by Fugl–Meyer Assessment (FMA) index, was significantly predicted by the connectivity of their affected hemisphere. These results improve on our understanding of stroke-induced alterations in functional brain networks.
|
Related publication: [6]