

Section: Research Program
Dynamics of complex systems
GEOSTAT is studying complex signals under the point of view of nonlinear methods, in the sense of nonlinear physics i.e. the methodologies developed to study complex systems, with a strong emphasis on multiresolution analysis. Linear methods in signal processing refer to the standard point of view under which operators are expressed by simple convolutions with impulse responses. Linear methods in signal processing are widely used, from least-square deconvolution methods in adaptive optics to source-filter models in speech processing. Because of the absence of localization of the Fourier transform, linear methods are not successful to unlock the multiscale structures and cascading properties of variables which are of primary importance as stated by the physics of the phenomena. This is the reason why new approaches, such as DFA (Detrented Fluctuation Analysis), Time-frequency analysis, variations on curvelets [58] etc. have appeared during the last decades. Recent advances in dimensionality reduction, and notably in Compressive Sensing, go beyond the Nyquist rate in sampling theory using nonlinear reconstruction, but data reduction occur at random places, independently of geometric localization of information content, which can be very useful for acquisition purposes, but of lower impact in signal analysis. One important result obtained in GEOSTAT is the effective use of multiresolution analysis associated to optimal inference along the scales of a complex system. The multiresolution analysis is performed on dimensionless quantities given by the singularity exponents which encode properly the geometrical structures associated to multiscale organization. This is applied successfully in the derivation of high resolution ocean dynamics, or the high resolution mapping of gaseous exchanges between the ocean and the atmosphere; the latter is of primary importance for a quantitative evaluation of global warming. Understanding the dynamics of complex systems is recognized as a new discipline, which makes use of theoretical and methodological foundations coming from nonlinear physics, the study of dynamical systems and many aspects of computer science. One of the challenges is related to the question of emergence in complex systems: large-scale effects measurable macroscopically from a system made of huge numbers of interactive agents [50] , [47] , [63] , [54] . Some quantities related to nonlinearity, such as Lyapunov exponents, Kolmogorov-Sinai entropy etc. can be computed at least in the phase space [48] . Consequently, knowledge from acquisitions of complex systems (which include complex signals) could be obtained from information about the phase space. A result from F. Takens [59] about strange attractors in turbulence has motivated the determination of discrete dynamical systems associated to time series [52] , and consequently the theoretical determination of nonlinear characteristics associated to complex acquisitions. Emergence phenomena can also be traced inside complex signals themselves, by trying to localize information content geometrically. Fundamentally, in the nonlinear analysis of complex signals there are broadly two approaches: characterization by attractors (embedding and bifurcation) and time-frequency, multiscale/multiresolution approaches. Time-frequency analysis [49] and multiscale/multiresolution are the subjects of intense research and are profoundly reshaping the analysis of complex signals by nonlinear approaches [46] , [51] . In real situations, the phase space associated to the acquisition of a complex phenomenon is unknown. It is however possible to relate, inside the signal's domain, local predictability to local reconstruction and deduce from that singularity exponents (SEs) [11] [7] . The SEs are defined at any point in the signal's domain, they relate, but are different, to other kinds of exponents used in the nonlinear analysis of complex signals. We are working on their relation with:
The alternative approach taken in GEOSTAT is microscopical, or geometrical: the multiscale structures which have their "fingerprint" in complex signals are being isolated in a single realization of the complex system, i.e. using the data of the signal itself, as opposed to the consideration of grand ensembles or a wide set of realizations. This is much harder than the ergodic approaches, but it is possible because a reconstruction formula such as the one derived in [60] is local and reconstruction in the signal's domain is related to predictability. This approach is analogous to the consideration of "microcanonical ensembles" in statistical mechanics.
Nonlinear signal processing is making use of quantities related to predictability. For instance the first Lyapunov exponent is related, from Osedelec's theorem, to the limiting behaviour of the response, after a time , to perturbation in the phase space :
with being time average and the response to a perturbation [48] . In GEOSTAT our aim is to relate such classical quantities (among others) to the behaviour of SEs, which are defined by a limiting behaviour
(: dimension of the signal's domain, : multiscale measure, typically whose density is the gradient's norm, : ball of radius centered at ). For precise computation, SEs can be smoothly interpolated by projecting wavelets:
(: mother wavelet, admissible or not), but the best numerical method in computing singularity exponents lies in the definition of a measure related to predictability [20] , [43] :
with: is a scale choosen to diminish the amplitude of the correction term, and is the average value of the wavelet projection (mother wavelet ) over the whole signal. Singularity exponents computed with this formula generalize the elementary "gradient's norm" in a very statistically coherent way across the scales.
SEs are related to the framework of reconstructible systems, and consequently to predictability. They unlock the geometric localization of a multiscale structure in a complex signal:
(: signal's domain). This multiscale structure is a fundamental feature of a complex system. Indeed, let us take the explicit example of a signal which is an acquisition of a 3D turbulent fluid. The velocity field of the flow, , is a solution of the Navier-Stokes equations. Fully Developped Turbulence (FDT) is defined as the regime observed when the Reynolds number , being defined as the ratio of "viscous diffusion time" by "circulation time": , and being respectively characteristic length and velocity of the flow. The phase space of the associated dynamical system is infinite dimensional, while the dynamics of the flow possess one or more finite dimensional attractors. In the case of FDT, particles of the fluid in the continuum which are trapped around KAM invariant manifolds undergo random perturbations in their motion which accounts for the "boost" observed in turbulent diffusion. From there comes the observed behaviour for the energy spectrum (the law within the inertial range), an observation that was the starting point of the Kolmogorov K41 theory, but is still not directly mathematically related from the Navier-Stokes equations. Intermittency is observed within the inertial range and is related to the fact that, in the case of FDT, symmetry is restored only in a statistical sense, a fact that has consequences on the quality of any nonlinear signal representation by frames or dictionaries.
The example of FDT as a standard "template" for developing general methods that apply to a vast class of complex systems and signals is of fundamental interest because, in FDT, the existence of a multiscale hierarchy (i.e. the collection of sets of equation 5 ) which is of multifractal nature and geometrically localized can be derived from physical considerations. This geometric hierarchy of sets is responsible for the shape of the computed singularity spectra, which in turn is related to the statistical organization of information content in a signal. It explains scale invariance, a characteristic feature of complex signals. The analogy from statistical physics comes from the fact that singularity exponents are direct generalizations of critical exponents which explain the macroscopic properties of a system around critical points, and the quantitative characterization of universality classes, which allow the definition of methods and algorithms that apply to general complex signals and systems, and not only turbulent signals: signals which belong to a same universality class share common statistical organization. In GEOSTAT, the approach to singularity exponents is done within a microcanonical setting, which can interestingly be compared with other approaches such that wavelet leaders, WTMM or DFA. During the past decades, classical approaches (here called "canonical" because they use the analogy taken from the consideration of "canonical ensembles" in statistical mechanics) permitted the development of a well-established analogy taken from thermodynamics in the analysis of complex signals: if is the free energy, the temperature measured in energy units, the internal energy per volume unit the entropy and , then the scaling exponents associated to moments of intensive variables corresponds to , corresponds to the singularity exponents values, and to the singularity spectrum.
The singularity exponents belong to a universality class, independently of microscopic properties in the phase space of various complex systems, and beyond the particular case of turbulent data (where the existence of a multiscale hierarchy, of multifractal nature, can be inferred directly from physical considerations). They describe common multiscale statistical organizations in different complex systems [57] , and this is why GEOSTAT is working on nonlinear signal processing tools that are applied to very different types of signals. The methodological framework used in GEOSTAT for analyzing complex signals is different from, but related to, the "canonical" apparatus developed in recent years (WTMM method, wavelet leaders etc.). In the microcanonical approach developed, geometrically localized singularity exponents relate to a "microcanonical" description of multiplicative cascades observed in complex systems. Indeed, it can be shown that -dissipation at scale associated to a fixed interval , , behaves in the limit as
which indicates the existence of a relation between the multiscale hierarchy and the geometric localization of the cascade in complex systems.
The GEOSTAT team is working particularly on the very important subject of optimal wavelets which are wavelets that "split" the signal projections between two different scales in such a way that there exists an injection term , independent of the process with:
(: two scales of observation, : injection variable between the scales, : optimal wavelet). The multiresolution analysis associated to optimal wavelets is particularly interesting because it reflects, in an optimal way, the cross-scale information transfer in a complex system. These wavelets are related to persistence along the scales and lead to multiresolution analysis whose coefficients verify
with and referring to child and parent coefficients, and are random variables independent of and and also independent of each other.
|
|
|
|
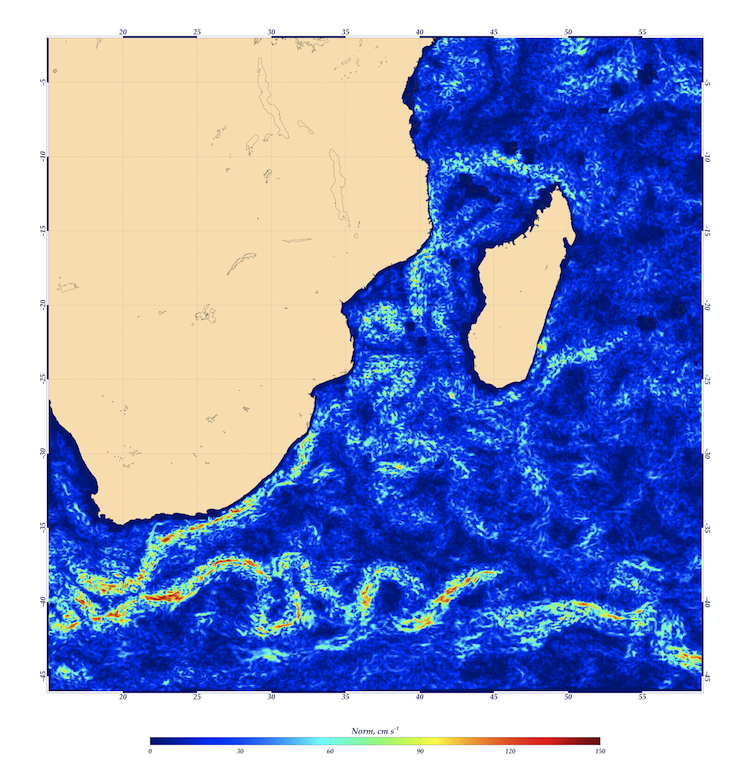
In a first example we give some insight about the collaboration with LEGOS Dynbio team (http://www.legos.obs-mip.fr/recherches/equipes/dynbio .) about high-resolution ocean dynamics from microcanonical formulations in nonlinear complex signal analysis. LPEs relate to the geometric structures linked with the cascading properties of indefinitely divisible variables in turbulent flows. Cascading properties can be represented by optimal wavelets (OWs); this opens new and fascinating directions of research for the determination of ocean motion field at high spatial resolution. OWs in a microcanonical sense pave the way for the determination of the energy injection mechanisms between the scales. From this results a new method for the complete evaluation of oceanic motion field; it consists in propagating along the scales the norm and the orientation of ocean dynamics deduced at low spatial resolution (geostrophic from altimetry and a part of ageostrophic from wind stress products). Using this approach, there is no need to use several temporal occurrences. Instead, the proper determination of the turbulent cascading and energy injection mechanisms in oceanographic signals allows the determination of oceanic motion field at the SST or Ocean colour spatial resolution (pixel size: 4 kms). We use the Regional Ocean Modelling System (ROMS) to validate the results on simulated data and compare the motion fields obtained with other techniques. See figure 1 .
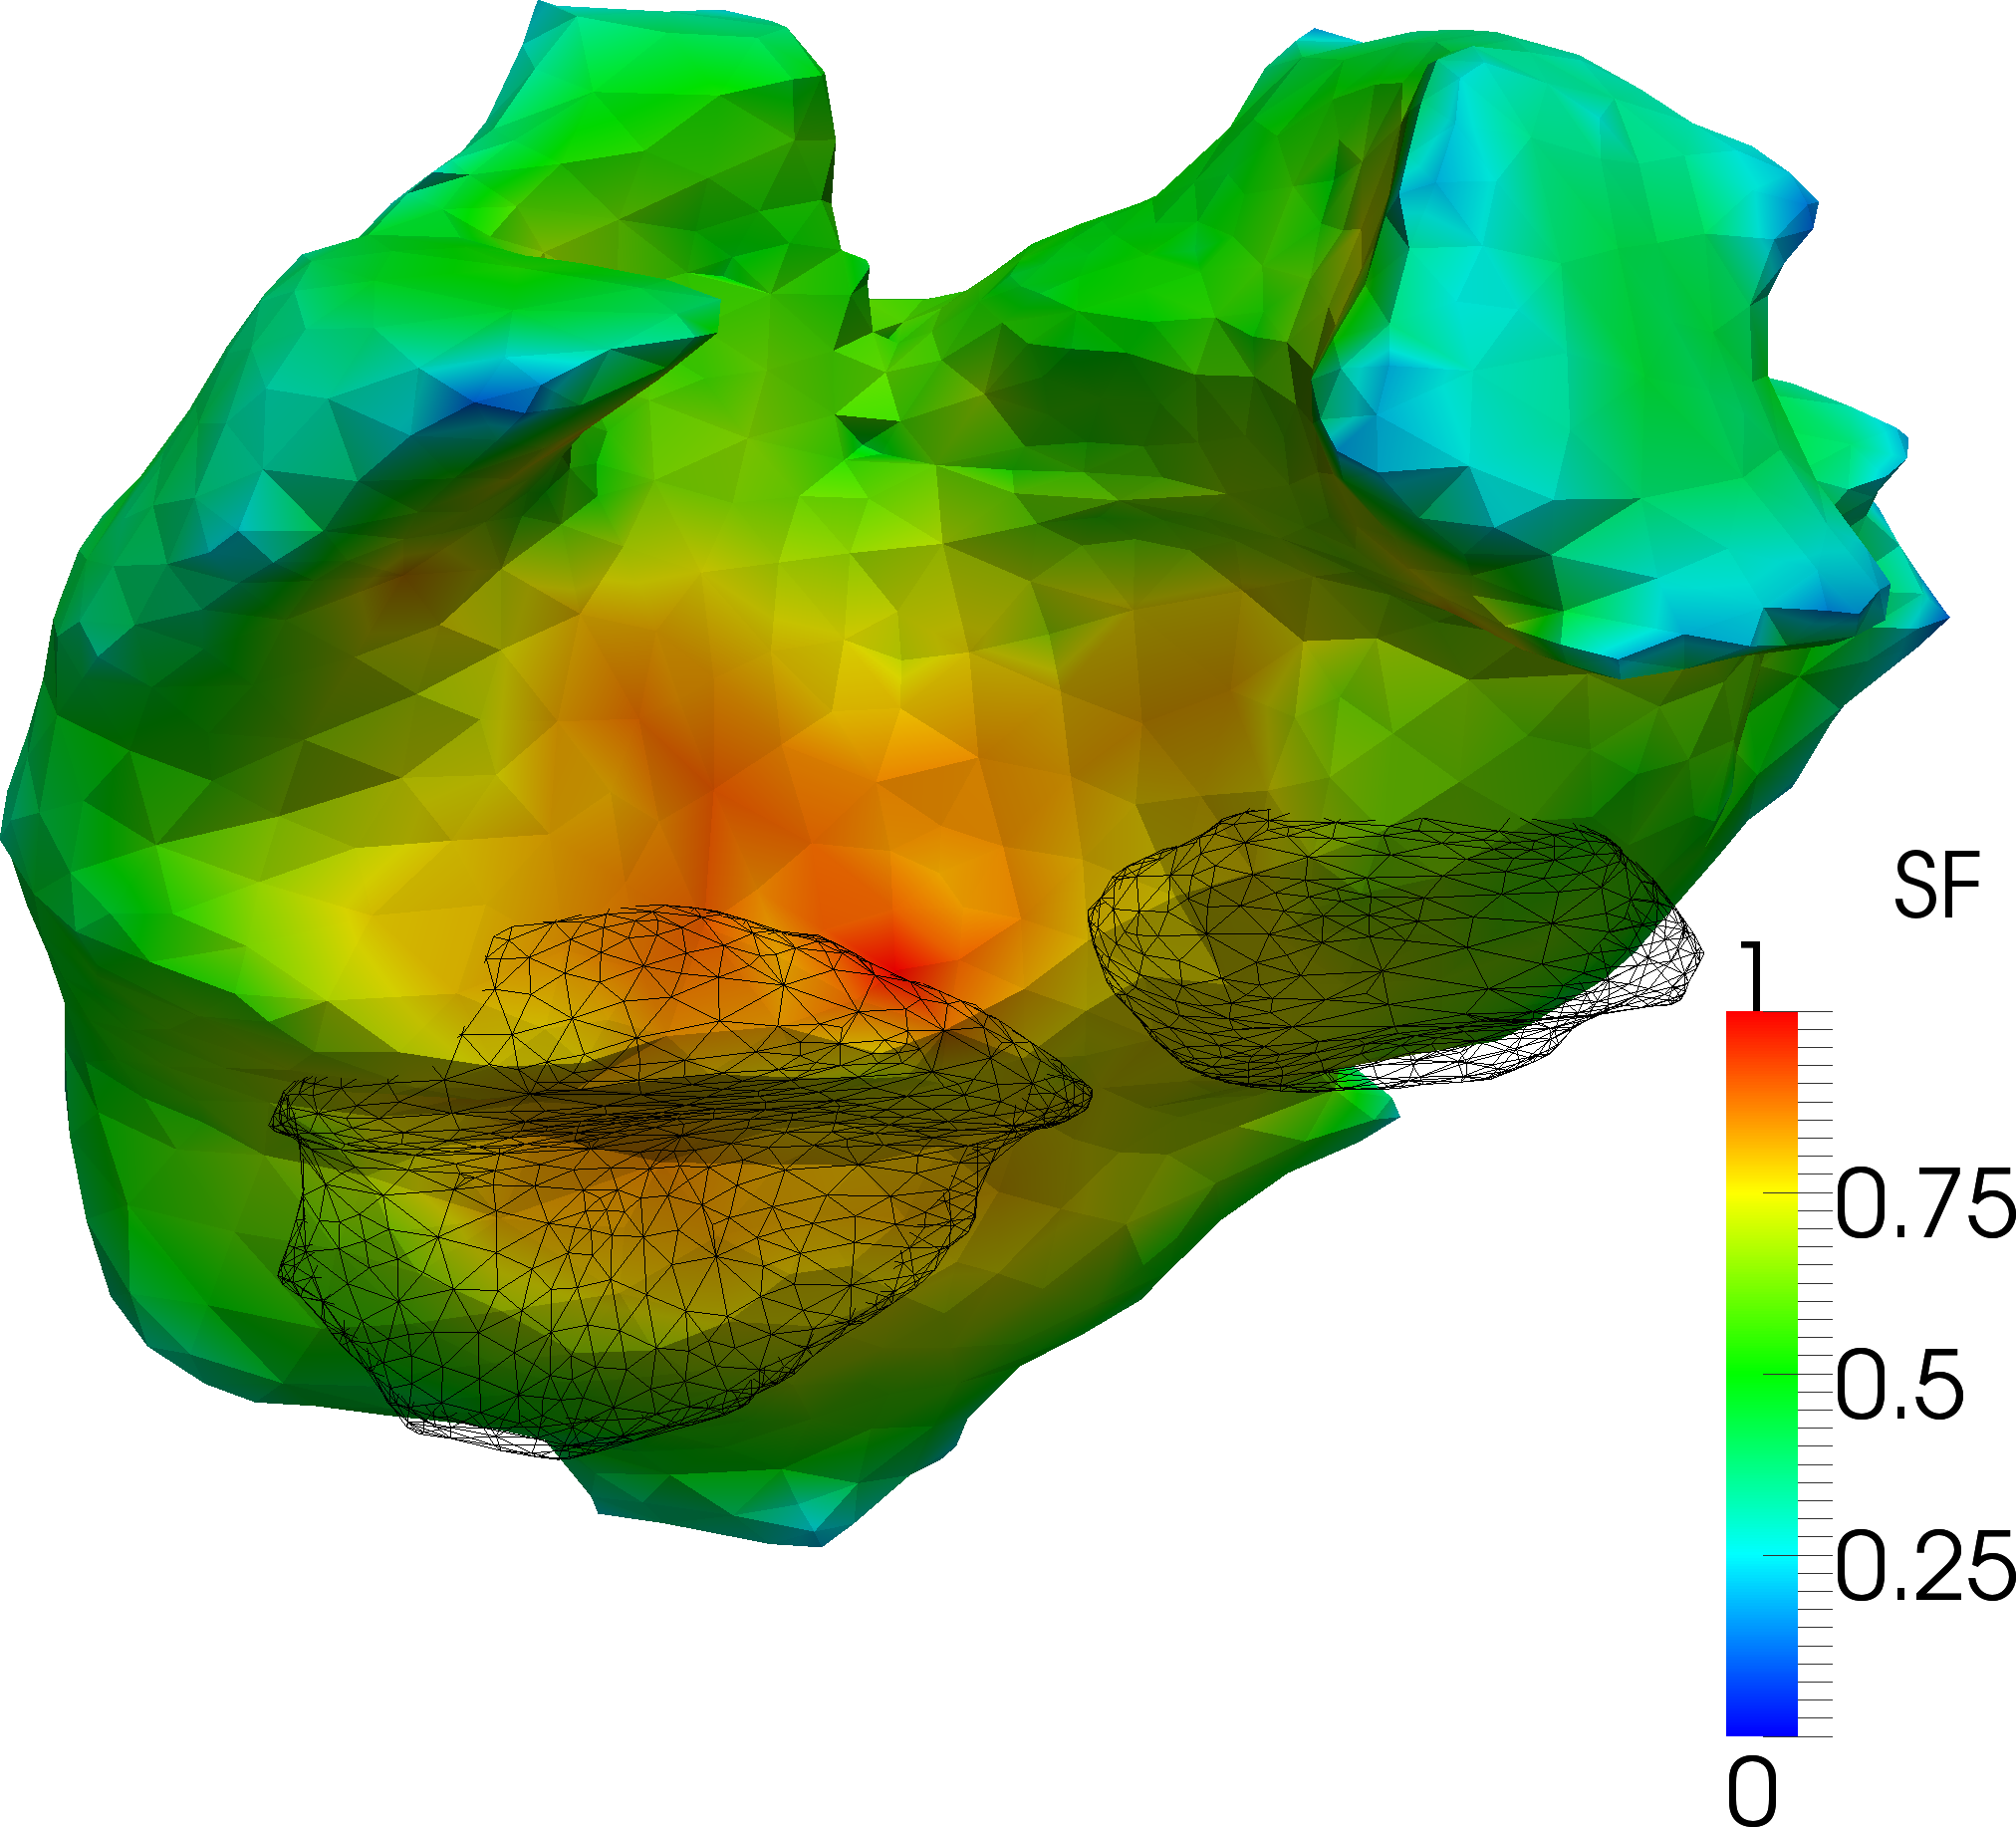
In a second example, we show in figure 2 the highly promising results obtained in the application of nonlinear signal processing and multiscale techniques to the localization of heart fibrillation phenomenon acquired from a real patient and mapped over a reconstructed 3D surface of the heart. The notion of source field, defined in GEOSTAT from the computation of derivative measures related to the singularity exponents allows the localization of arrythmic phenomena inside the heart [8] .
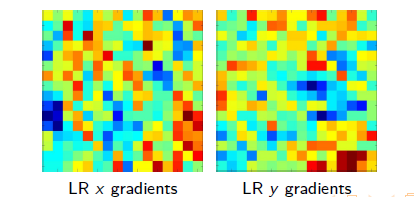
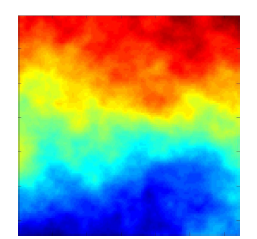
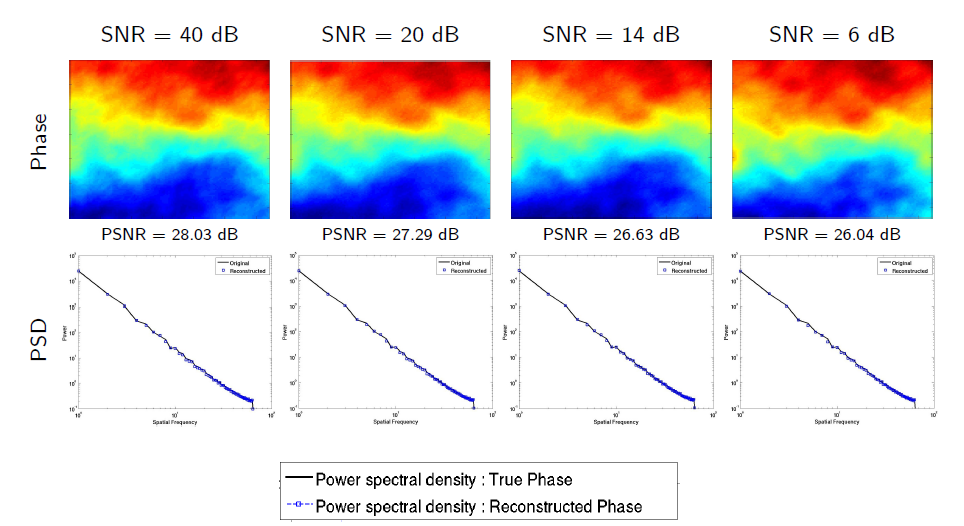
In a third example, we show in figure 3 the result of a new nonlinear method based on singularity exponents for optical phase reconstruction in adaptive optics (PhD of Suman Kumar Maji, defended November 2013). The method is very robust to noise. It consists in propagating subgradient information of acquired phase at low resolution across the scales of a multiresolution analysis computed on singularity exponents.
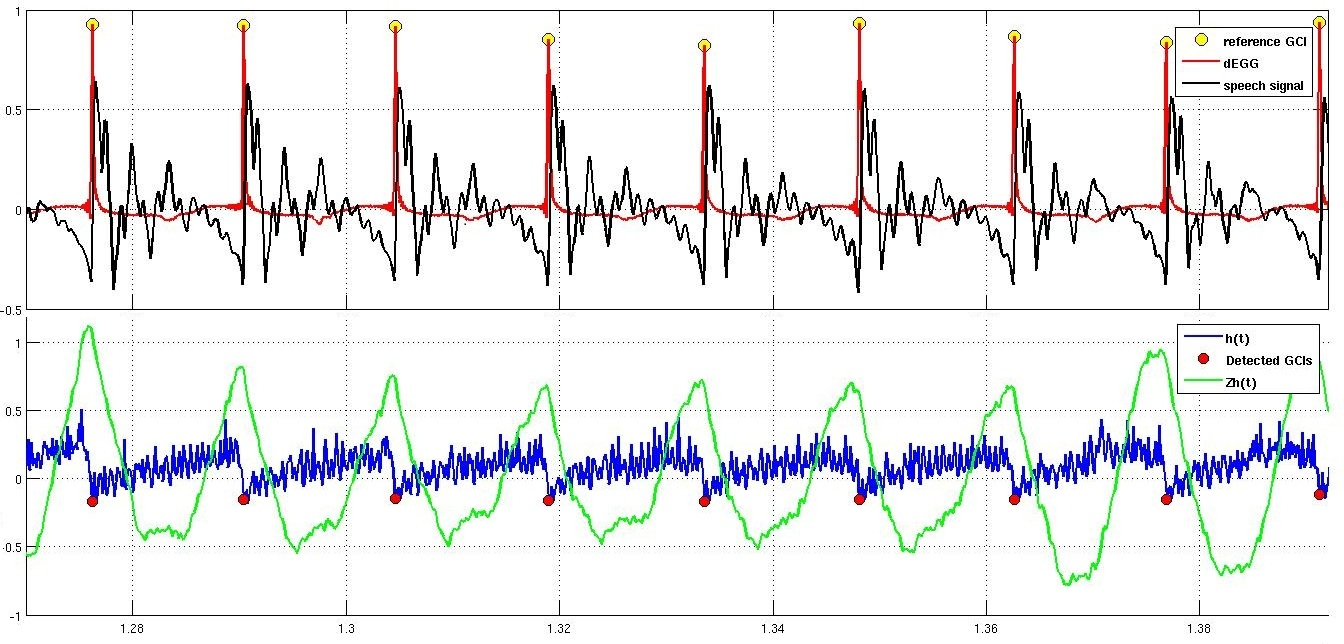
Our last example is about speech. In speech analysis, we use the concept of the Most Singular Manifold (MSM) to localize critical events in domain of this signal. We show that in case of voiced speech signals, the MSM coincides with the instants of significant excitation of the vocal tract system. It is known that these major excitations occur when the glottis is closed, and hence, they are called the Glottal Closure Instants (GCI). We use the MSM to develop a reliable and noise robust GCI detection algorithm and we evaluate our algorithm using contemporaneous Electro-Glotto-Graph (EGG) recordings. See figure 4 .