Section: Partnerships and Cooperations
International Initiatives
-
The Toubkal project "Caractérisation multi-capteurs et suivi spatio-temporel de l'Upwelling sur la côte atlantique marocaine par imagerie satellitaire", led by K. Daoudi, has been accepted. The partners in this project are: Faculté des sciences de Rabat, Centre Royal de Télédetection Spatiale, Mercator-Ocean and Geostat.
Inria Associate Teams not involved in an Inria International Labs
OPTIC
-
International Partner (Institution - Laboratory - Researcher):
-
See also: https://optic.bordeaux.inria.fr/ .
-
The OptIC associated team is co-managed by Prof. D. Singh (IIT Roorkee) and N. Brodu, H. Yahia (Inria Geostat).
-
The OptIC associated team targets the extension and development of a strong collaboration between Inria Geostat team and Indian Institute of Technology Roorkee, Dept of Electronics and Computer Engineering (Prof. D. Singh's group) on non-linear Signal Processing for Universe Sciences, with a strong emphasis on data fusion in Earth Observation and monitoring. Non-linear Physics puts strong evidence of the fundamental role played by multiscale hierarchies in complex and turbulent data: in these data, the information content is statistically localized in geometrical arrangements in the signal's domain, while such geometrical organization is not attainable by classical methods in linear signal processing. This is one of the major drawbacks in the classical analysis of complex and turbulent signals. The goal of this associated team is to show that inference of physical variables along the scales of complex and turbulent signals can be performed through optimal multiresolution analysis performed on non-linear features and data extracted from the signals, resulting in novel and powerful approaches for data fusion between different acquisitions (in temporal/spatial/spectral resolutions). This program needs both strong expertise in the physical processes beyond the acquisitions and the application of non-linear physics ideas on the behavior of the acquired physical phenomena. The proposal will focus on specific applications in Earth Observation and monitoring for which the Indian partner has developed a very strong expertise, notably in its knowledge and use of the physical processes in remote sensing acquisitions. This partnership is an extremely interesting and high potential collaboration between two teams which focus separately either on the acquisition of the physical processes or their analysis by Complex Systems and non-linear physics methodologies. The recent results obtained in super-resolution by GEOSTAT promises strong applications to a much wider range of Universe Sciences problems, notably with a strong emphasis on data fusion between the physical variables acquired on related but different acquisitions. OptiC builds on a collaboration between Inria and IIT ROORKEE teams, added with partners in Universe Sciences and earth observation (ONERA, CNRS) already involved in research actions with Geostat.
Summary of work done in 2015
|
-
The public availability of low-resolution MODIS data is cost-effective, but limited in precision. Some applications, such as land monitoring and anomaly detection, must not only operate on objects smaller than provided in the freely available data, but also offer a high level of confidence in the classified land occupation. We are working on both aspects:
-
Augmenting numerically the resolution of the images. This can be done with different methods, out of which two are currently explored in our team. The first relies on wavelet decompositions, with an attempt at preserving the spatial structure around each pixel (e.g. edges). This is typically done by propagating the high-frequency components to higher wavelet decomposition level through some interpolation mechanism, plus artifact-reduction steps. The second method considers a sub-pixel mixing model which is fit from all multispectral bands. The assumption is that, irrespectively of the reflectance of natural elements at each wavelength, the proportion of these elements is a physical property shared through all spectral bands. Then, unmixing is performed in order to estimate the best sub-pixels. See figure 7 .
-
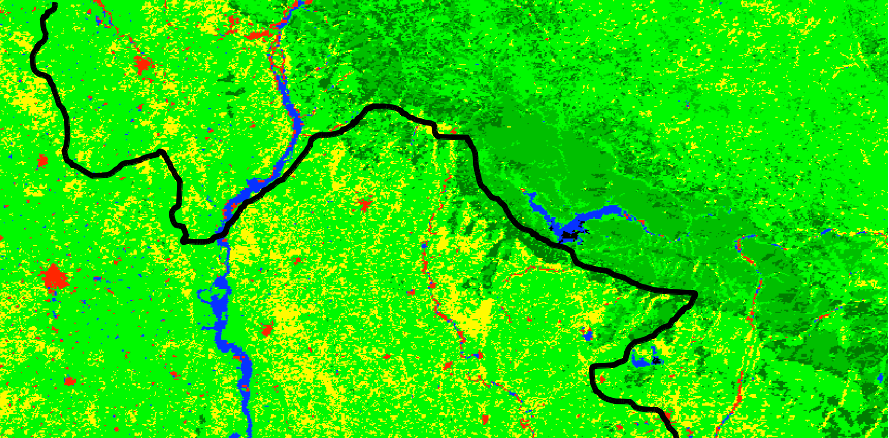
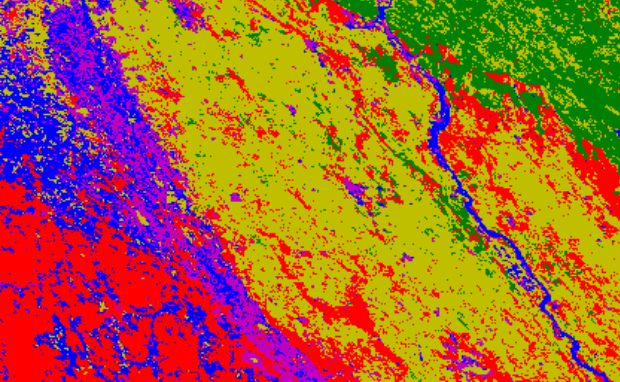
Resolution-augmented images are then exploited for classification. We use by field measurements, in order to provide the ground truth for a corpus of well-registered locations, which together encompass a wide variety of objects (e.g. urban, crops, etc). We then train our super-resolution algorithms, and quantitatively assess our super-resolved maps on how well they improve the performance of land classification. As the final accuracy results from the interplay between the considered feature space and the classification method itself, we quantify both aspects with cross-validated data sets. We have tested state of art classification methods (SVM, decision trees, probabilistic models, nearest neighbors, etc…). Classification accuracy is improved by the used of superresolved images but, more importantly, so are the generalization ability of the classifiers. This is shown in the following two images, demonstrating the improvement in land recognition between the use of the original 500m MODIS data and the superresolved 250m data.
-
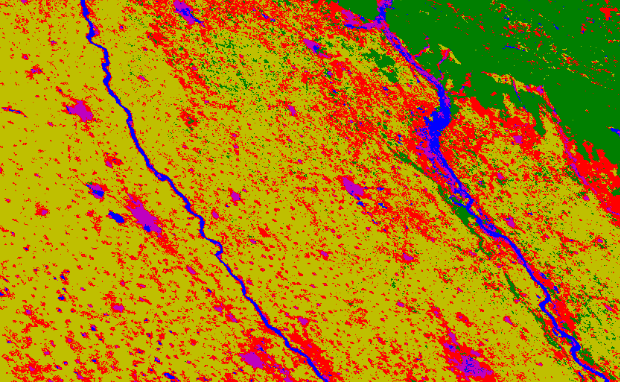
A wavelet based resolution enhancement technique has been crtically analyzed to see the effect of it on resolution enhancemnt modified discrete wavelet transform and interpolation based technique is proposed for enhancing the resolution of satellite images having low resolution in such a way that a highly resolved satellite image can be obtained without losing any image information. The advent of DWT has given a major impetus to many techniques based on achieving super resolution starting with a single low resolution image. In the proposed method, DWT is employed on the input satellite image to decompose it into sub-bands then the high frequency subbands and the input low resolution satellite image have been interpolated to obtain four interpolated images which are later combined after minor alterations to the interpolated input image using IDWT. The quantitative peak signal-to-noise ratio (PSNR) and classification results show that the resolution has been enhanced to a good scale without losing any information content present in the satellite image. The quality assessment parameters also illustrate the supremacy of the proposed technique over the conventional techniques. Results are shown in fig 8 .
-
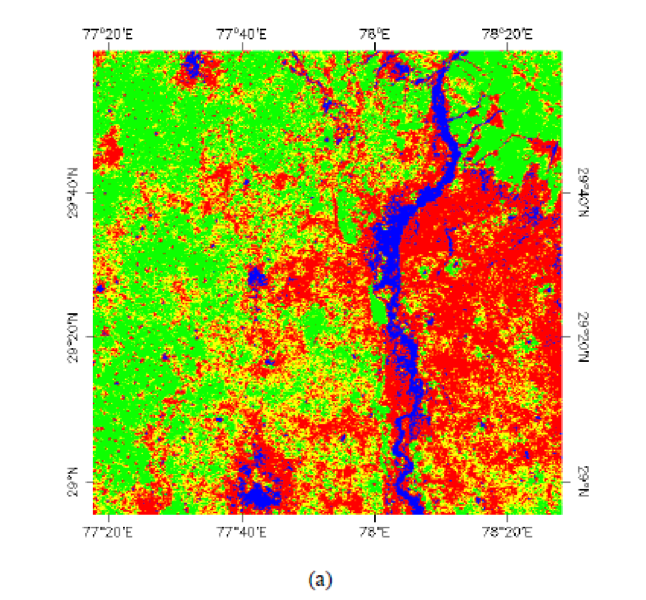
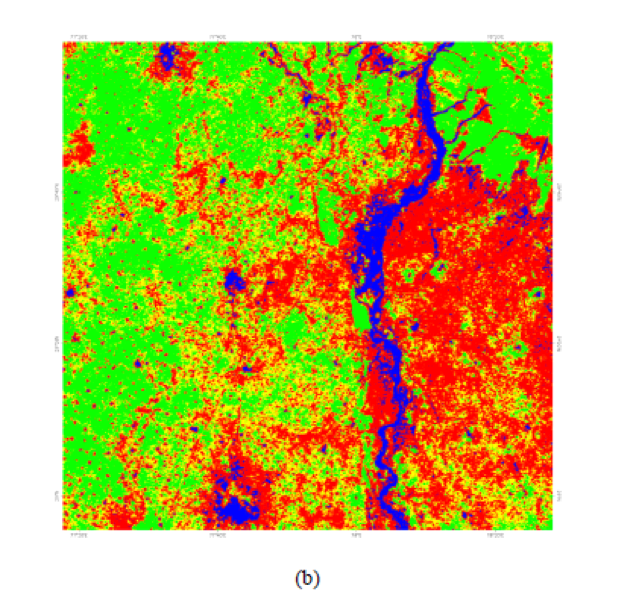
A technique based on feature extarction has been attempted to apply in the low resolution satellite data by which a land cover monitoring system can be developed. Moderate resolution imaging spectroradiometer (MODIS) data is a good resource for land cover monitoring as it is freely available data, having high temporal frequency and spatial resolutions 250 m, 500m and 1000m. MODIS being optical satellite data suffers from various atmospheric and cloud disturbances due to which, feature extraction and land cover interpretation using MODIS data is a significant and challenging task. In the past various features like spectral indices (EVI, SAVI, GEMI, PAVI etc), fourier based features, wavelet based features were extracted for land cover classification from MODIS data but the role of texture descriptors and color features in land cover analysis has not been focussed, which has the potential to provide a new stage of land cover discrimination. Therefore, the objective of this work was to explore the applicability of MODIS composite data for land cover monitoring by texture and color features extraction. Various texture features and descriptors like GLCM (Gray Level Co-occurrence Matrix) measures, LBP (Local Binary Pattern), EHD (Edge Histogram Descriptor), gabor wavelets and color features like Red-Green-Blue (RGB) color space, Hue-Saturation-Value (HSV) color space, Hue-Min-Max-Difference (HMMD) color space, MPEG-7 Dominant Color Descriptor (DCD), MPEG-7 Color Structure Descriptor (CSD) and MPEG-7 Scalable Color Descriptor (SCD) were extracted. These color features were extracted over the artificial-color image obtained by mapping band2 (infrared band), NDVI (Normalized Vegetation Index) and band1 (red band) to the red, green and blue (RGB) color channels, respectively. It is observed that the extracted features are giving quite good results for land cover identification and classification. This infers that in near future these features could play a major role in the development of the land monitoring system using MODIS data. A clssified result of Roorkee region of India is shown in fig 9 which has the overall classification accuracy approx. 82%.
-
An another approach based on KLT (Kanade-Lucas-Tomasi) tracker has also been explored to apply on the Phased Array L-Band Synthetic Aperture Radar (PALSAR) satellite image for adapative monitoring the land cover changes. It is observed that KLT tracking algorithm has good potential to be used as monitoring of vegetation in less time without applying time consuming image registration technique.
Related publications: link to list of publications on OPTIC web site .