

Section: Highlights of the Year
Highlights of the Year
Numerical simulation of zebrafish larvae C-bend
This part is performed in collaboration with the MRGM laboratory (Laboratoire Maladies Rares : Génétique et Métabolism, https://mrgm.u-bordeaux.fr/). They are interested in the swimming of a zebrafish larvae under genetic modifications. One aim is to quantify the power spent by such fishes to swim after a stimuli reaction. The numerical simulation we develop can help computing integral quantities such the power [39]. This simulation is challenging due to coupling several methods like image treatment (from movies given by MRGM), optimal transport [58] and numerical simulations.
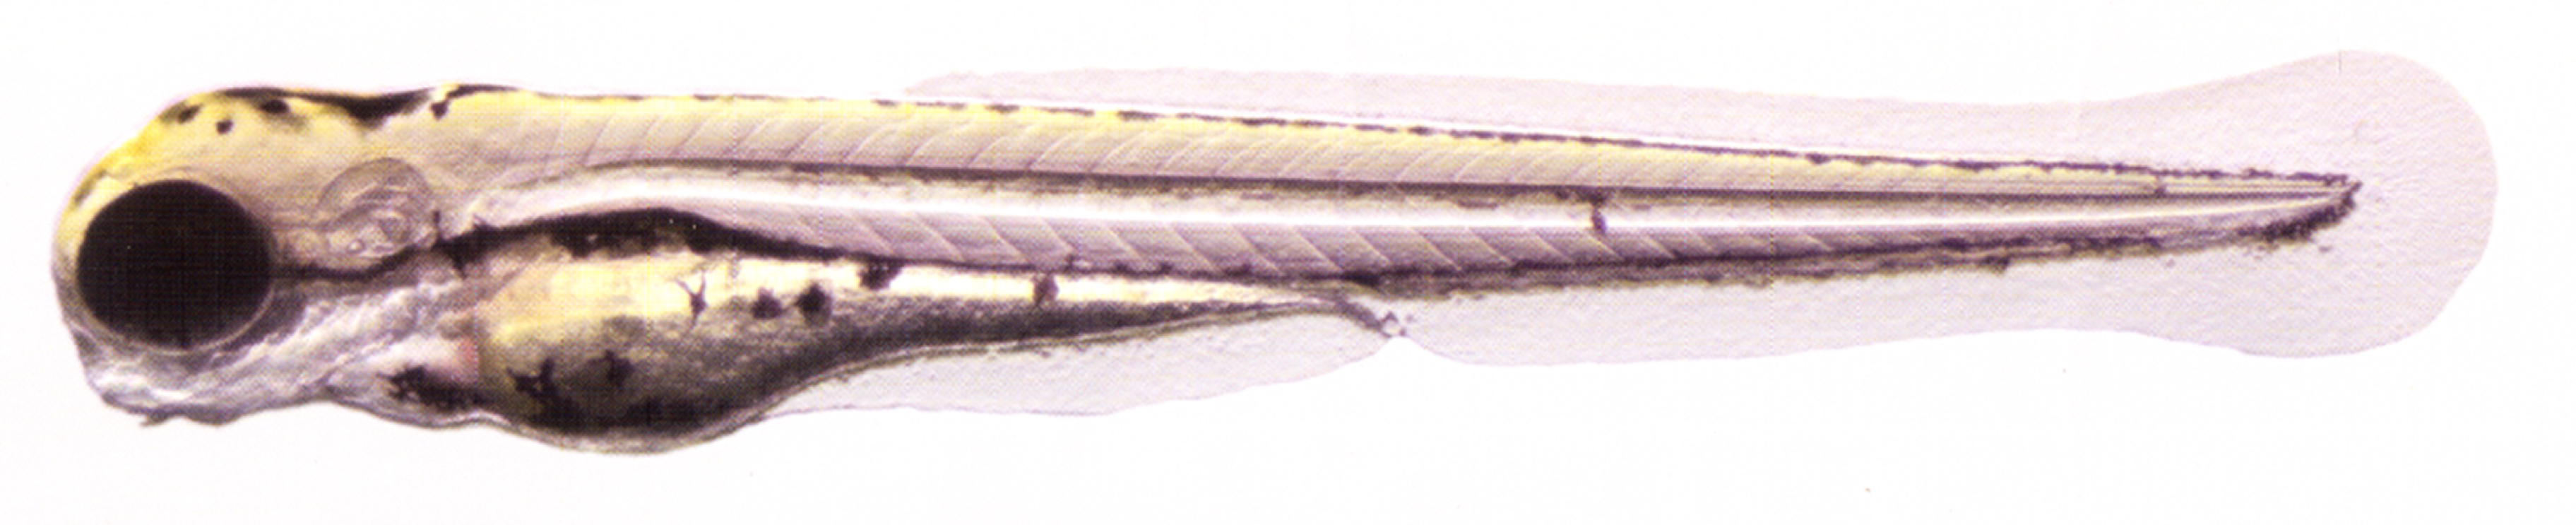
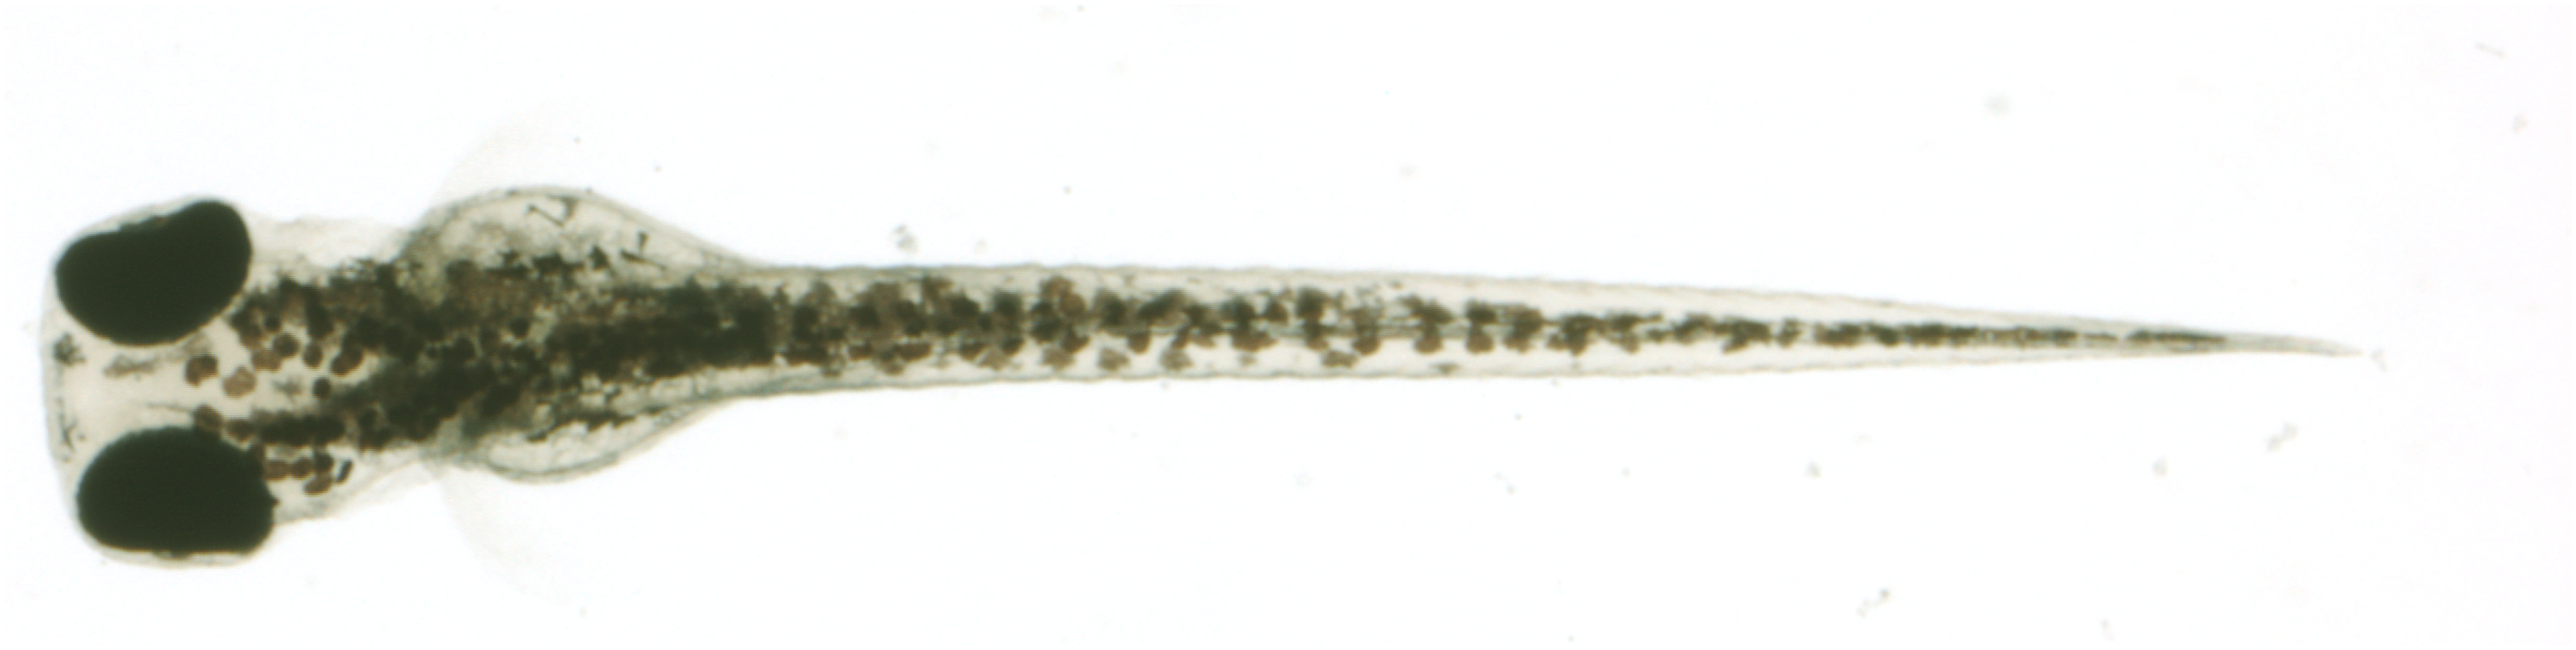
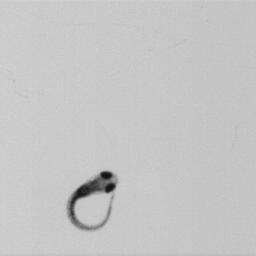
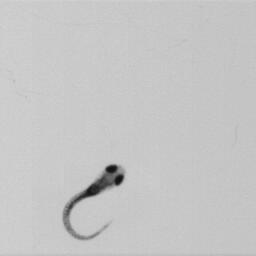
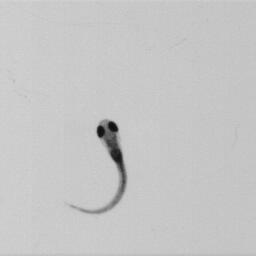
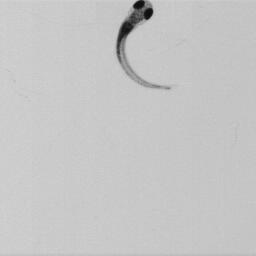
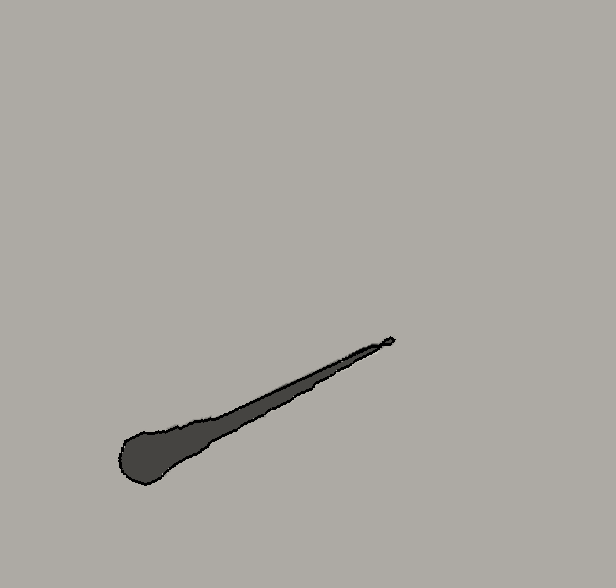
First 2D numerical results have been performed from a series of 615 pictures obtained at a rate equal to images per second. The fish is a 8-day zebrafish larvae (length is ) presented in figure 5.
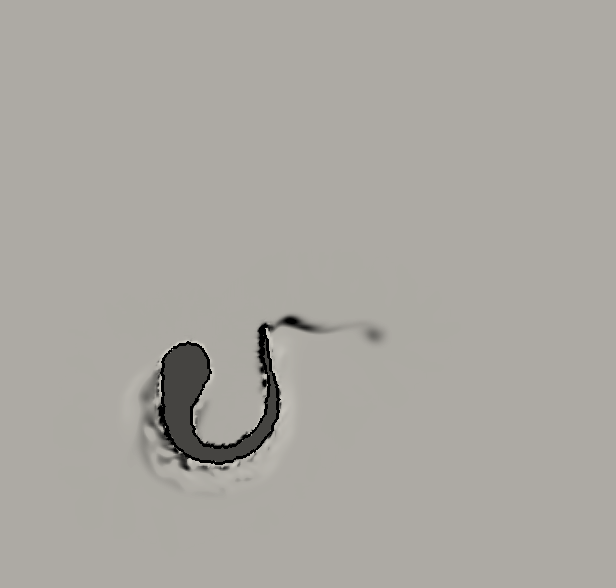
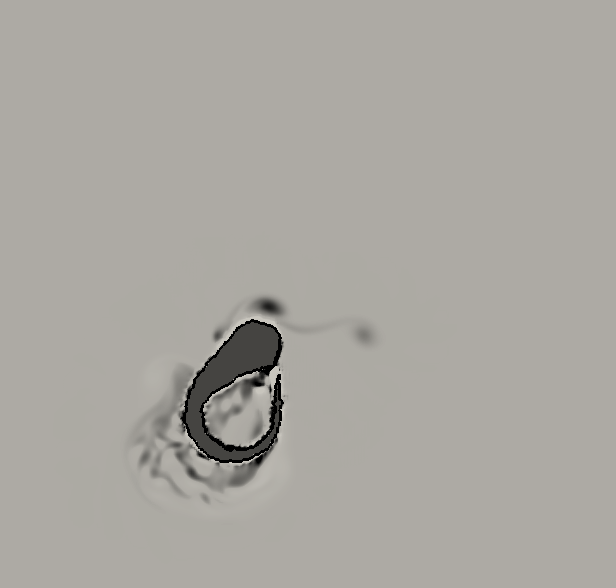
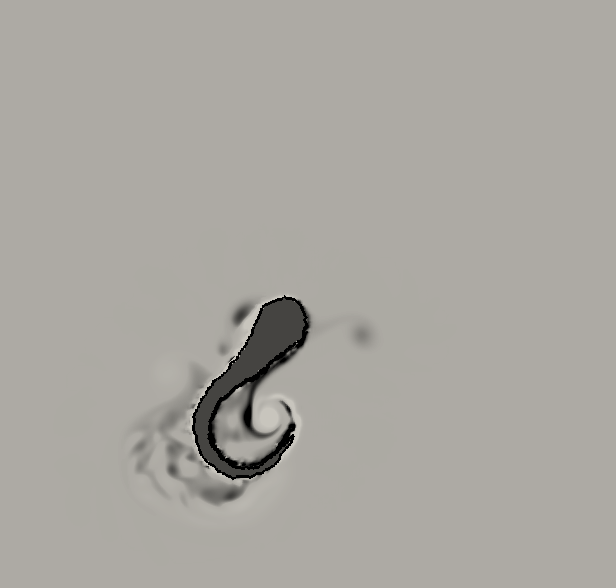
All the 615 pictures have been post-processed to remove the displacement of the center of mass (due to the hydrodynamic forces) as well as the rotation angle (due to the hydrodynamic torques) to isolate the kinematic of the deformation. Indeed, the displacement of the mass center and the rotation angle have to be computed as being the results of the flow effects generated by the fish deformation. The numerical solver requires however more than 615 images for the overall simulation due to small times steps limitation. The missing images are thus computed using optimal transportation with the algorithm presented in [40]. This method gives also the deformation velocity inside the body that is necessary for our numerical simulation based on the penalty method (see figure 4 for an example of deformation velocity computation).
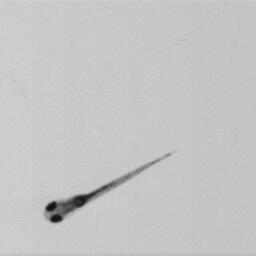
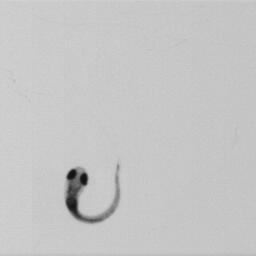
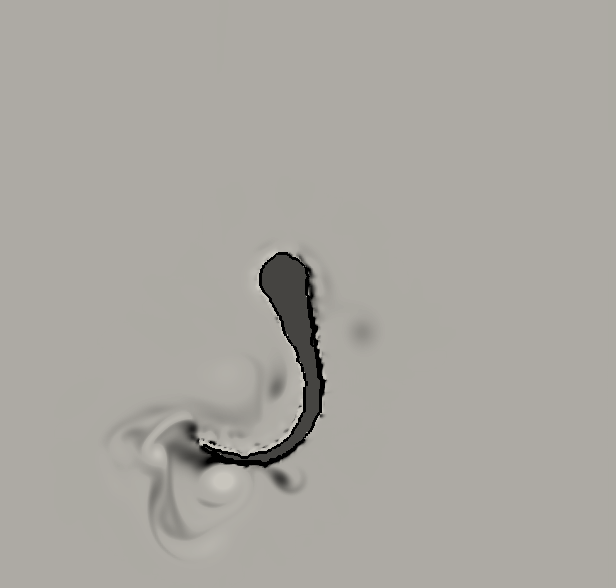
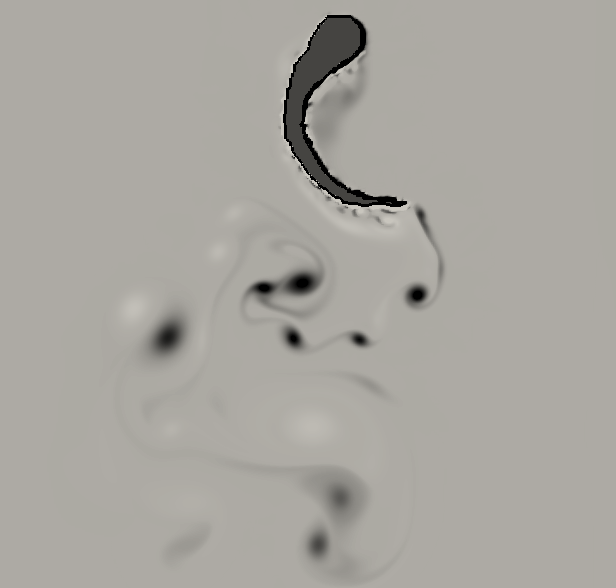
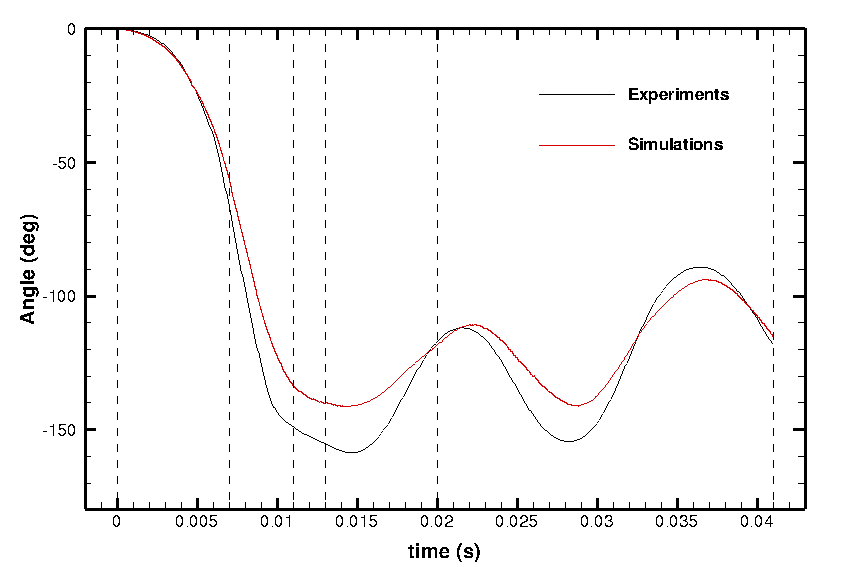
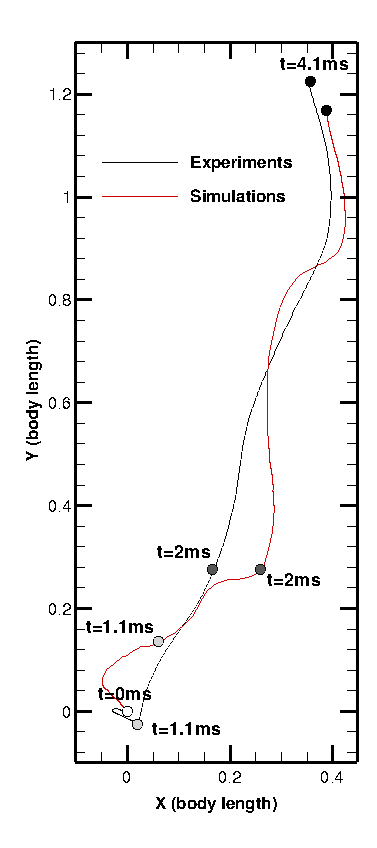
A comparison between experimental and numerical swimming behaviors is presented in figure 6. The qualitative behaviors look quite similar. In a more quantitative way, figures 7 and 8 show the temporal evolution of the rotating angle as well as the position of the center of mass. The numerical results (displacement of the mass center and the rotation) are quite close to the experimental ones (the ones removed in the post-processed of the original pictures).
|
|
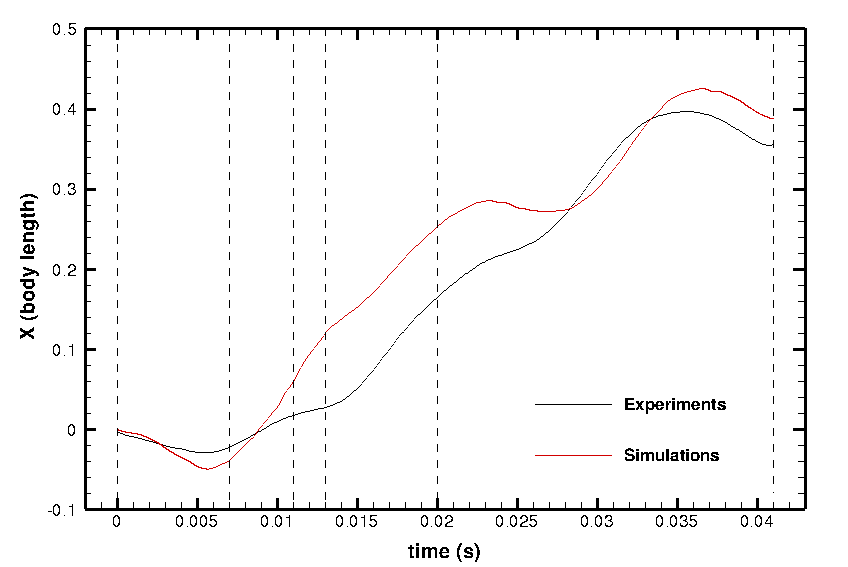
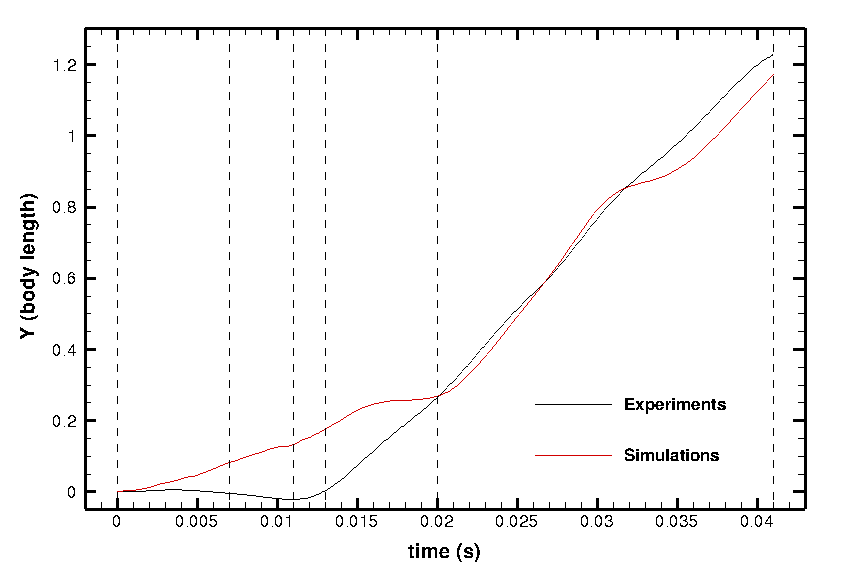
The small differences can be explained by the fact the the actual simulation is only two-dimensional. Another explanation is that the deformation velocity obtained by optimal transportation is by definition irrotational and a priori non divergence free. We are now working on the 3D simulation as well as a modified (sub-)optimal transportation including rotational effects for a divergence free field.