

Section: New Results
Attenuation and Delay of Remote Potentials Evoked by Direct Electrical Stimulation During Brain Surgery
Participants : Anthony Boyer, Hugues Duffau [CHU Montpellier] , Emmanuel Mandonnet [CHU Lariboisière] , Marion Vincent, Sofiane Ramdani [LIRMM] , David Guiraud, François Bonnetblanc.
Direct electrical stimulation (DES) is used to perform functional brain mapping during awake surgery but its electrophysiological effects remain by far unknown. DES may be coupled with the measurement of evoked potentials (EPs) to study the conductive and integrative properties of activated neural ensembles and probe the spatiotemporal dynamics of short- and long-range networks. We recorded ECoG signals on two patients undergoing awake brain surgery and measured EPs on functional sites after cortical stimulations, using combinations of stimulation parameters. EPs were similar in shape but delayed in time and attenuated in amplitude when elicited from a different gyrus or remotely from the recording site. We were able to trigger remote EPs using low stimulation intensities. We propose different activation and electrophysiological propagation mechanisms following DES based on activated neural elements [15].
|
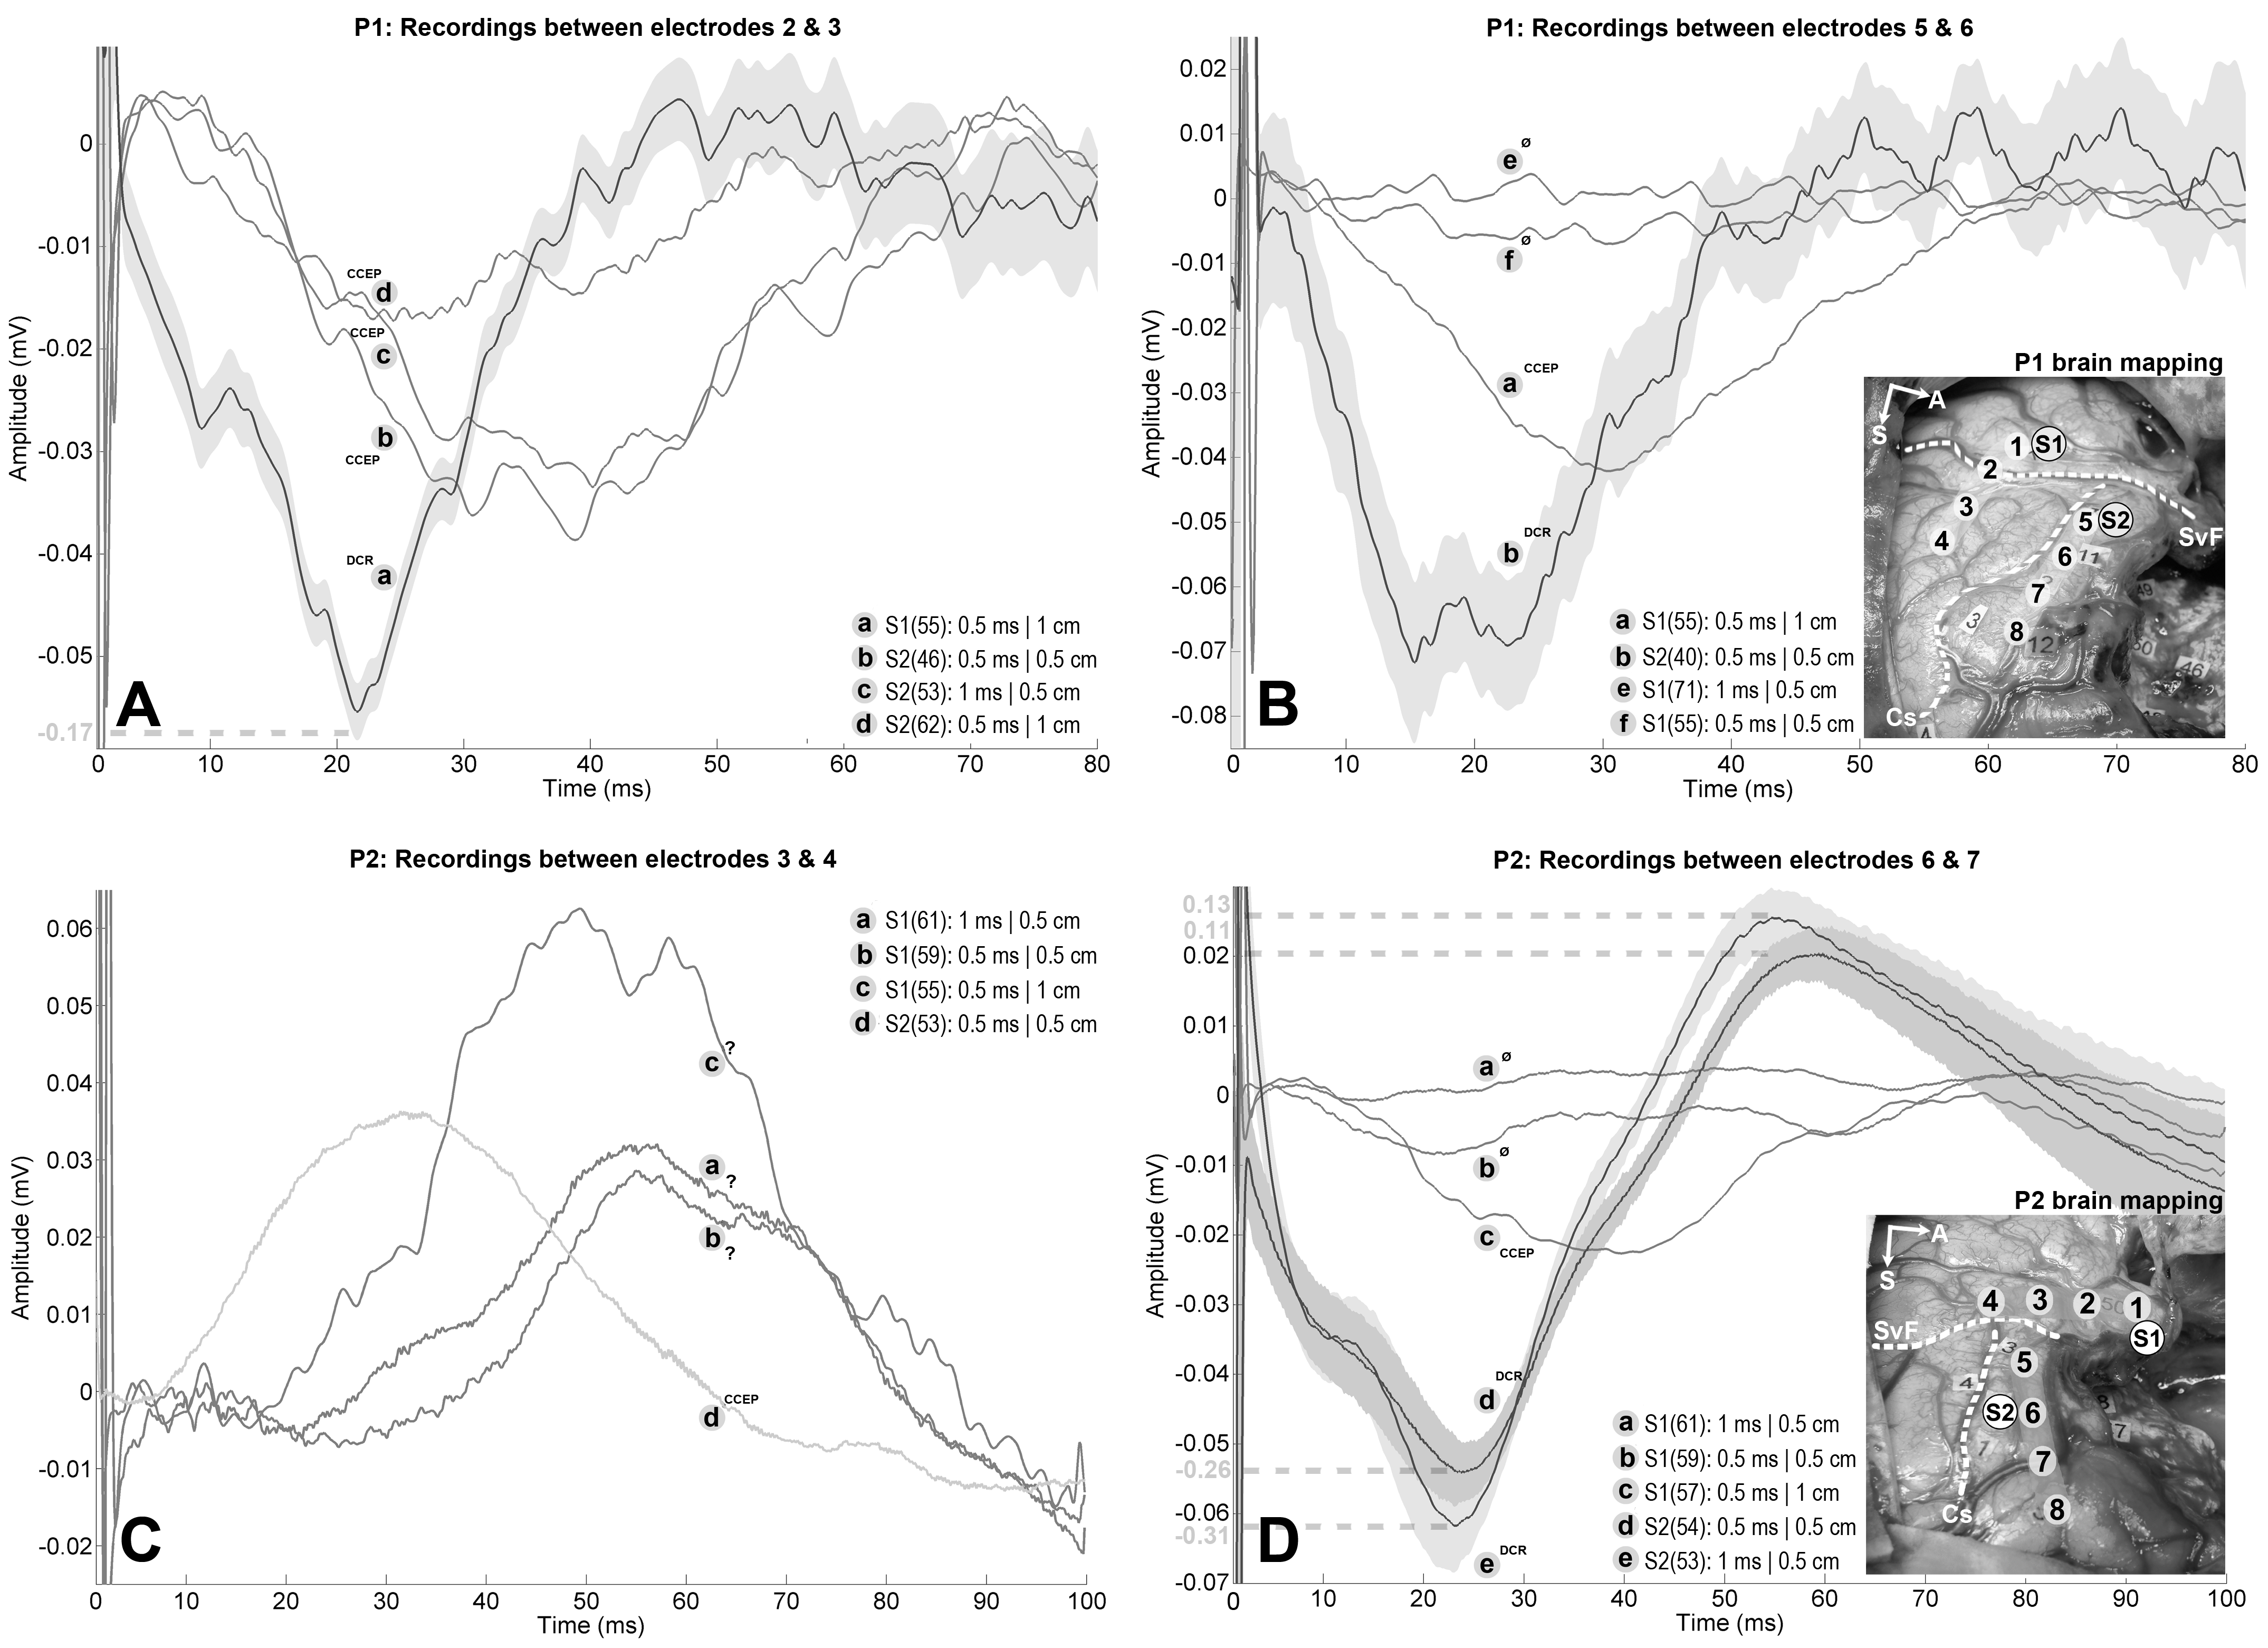
Electrodes of both ECoG strips are numbered from 1 to 4 and from 5 to 8. The Sylvian fissure and central sulcus are highlighted by a white dashed lines and annoted "SyF" and "Cs" respectively. For P1, experimental DES was applied on: (1) the Wernicke's area (S1), associated with complete anomia; (2) the ventral premotor cortex (S2), which led to movement and counting interruptions. Strip 1 spans over both temporal and parietal lobe with: electrode 1 over the most posterior part of the superior temporal gyrus; electrode 2 over the Sylvian fissure; electrodes 3 and 4 over the adjacent supramarginal gyrus. Strip 2 spans over the precentral gyrus with: electrodes 5 to 7 over the ventral premotor cortex; electrode 8 is bordering with the most posterior part of the partially resected dorsolateral prefrontal cortex. For P2, experimental DES was applied on: (1) the middle part of the superior temporal gyrus (S1) which led to complete anomia; (2) the precentral gyrus (S2), which induced articulatory disorders. Strip 1 spans over the superior temporal gyrus with: electrodes 1 and 2 over its middle third; electrodes 3 and 4 over its most posterior part. Strip 2 spans over the precentral and dorsolateral prefrontal gyri with: electrodes 5 and 6 over the ventral premotor cortex; electrodes 7 and 8 are respectively bordering and within the adjacent dorsolateral prefrontal cortex. Tumor was about 164 cm3 for P1 and 150 cm3 for P2. The number of averaged stimuli is reported within parentheses for each trace. 99% confidence interval estimated for DCRs are represented by grey surfaces to demonstrate that CCEPs do not belong to them. Additional traces corresponding to variations of stimulation parameters were added if available, regardless of the presence of EPs. A: Differential recordings between electrodes 2 and 3 for P1 while stimulating S1 (-170 µV, 21 ms delay) and S2 (amplitudes ranging from -40 µV to -17 µV, delays ranging from 25 ms to 38 ms). EPs following S2 stimulation are CCEPs because of the presence of the central fissure between the stimulation and recording sites. The EP measured after stimulating S1 is ambiguous because electrode 2 lies on the Sylvian fissure, but the short latency and enhanced amplitude with regard to the CCEPs suggest a DCR. Note the dashed line indicating a different amplitude scale for the DCR, which was reduced by a factor 3 for visualization purposes. B: Differential recordings between electrodes 5 and 6 for P1 while stimulating S2 (-75 µV, 20 ms delay) and S1 (-44 µV, 30 ms delay). EP following S1 stimulation is a CCEP because of the presence of the Sylvian fissure between the stimulation and recording sites. EP following S2 stimulation should be viewed as DCR as it was recorded on the same gyrus and it showed shorter latency and enhanced amplitude in comparison with the CCEP. C: Differential recordings between electrodes 3 and 4 for P2 while stimulating S1 (amplitudes ranging from +29 µV to +62 µV, delays ranging from 52 ms to 62 ms) and S2 (+36 µV, 32 ms delay). EP following S2 stimulation is a CCEP because of the presence of the Sylvian fissure between the stimulation and recording sites. EPs following S1 stimulations should be viewed as DCRs as they are recorded on the same gyrus but the latencies and amplitudes appeared unusual. EPs are positive because of differential measure. D: Differential recordings between electrodes 6 and 7 for P2 while stimulating S2 (amplitudes ranging from -260 µV to -310 µV, 20 ms delay) and S1 (-24 µV, 38 ms delay). EP following S1 stimulation is a CCEP because of the presence of the Sylvian fissure and the operative cavity between the stimulation and recording sites. EPs following S2 are likely DCRs as they are recorded on the same gyrus, which is corroborated by their short latencies and maximized amplitudes with regard to the CCEP. Note the dashed lines indicating different amplitude scales for the DCRs, which were reduced by a factor 5 for visualization purposes.