
Keywords
Computer Science and Digital Science
- A1.3. Distributed Systems
- A1.3.3. Blockchain
- A3.1.4. Uncertain data
- A3.1.7. Open data
- A3.1.8. Big data (production, storage, transfer)
- A3.3. Data and knowledge analysis
- A3.3.1. On-line analytical processing
- A3.3.3. Big data analysis
- A3.5.1. Analysis of large graphs
- A5.1. Human-Computer Interaction
- A5.1.1. Engineering of interactive systems
- A5.1.2. Evaluation of interactive systems
- A5.1.6. Tangible interfaces
- A5.1.8. 3D User Interfaces
- A5.1.9. User and perceptual studies
- A5.2. Data visualization
- A5.6.1. Virtual reality
- A5.6.2. Augmented reality
- A6.3.3. Data processing
- A9.6. Decision support
Other Research Topics and Application Domains
- B1. Life sciences
- B1.1. Biology
- B1.2. Neuroscience and cognitive science
- B9.5.6. Data science
- B9.6. Humanities
- B9.6.1. Psychology
- B9.6.3. Economy, Finance
- B9.6.6. Archeology, History
- B9.6.10. Digital humanities
1 Team members, visitors, external collaborators
Research Scientists
- Jean-Daniel Fekete [Team leader, Inria, Senior Researcher, HDR]
- Pierre Dragicevic [Inria, Researcher, until Aug 2021]
- Steve Haroz [Inria, Starting Research Position]
- Tobias Isenberg [Inria, Senior Researcher, HDR]
- Petra Isenberg [Inria, Researcher, HDR]
Faculty Member
- Frédéric Vernier [Univ Paris-Saclay, Associate Professor]
Post-Doctoral Fellows
- Luiz Augusto De Macedo Morais [Inria, until Aug 2021]
- Gaelle Richer [Inria, until May 2021]
PhD Students
- Marie Destandau [Inria, Jan 2021]
- Yuheng Feng [Univ Paris-Saclay]
- Tingying He [Univ Paris-Saclay, from Oct 2021]
- Jiayi Hong [Inria]
- Mohammad Alaul Islam [Inria]
- Alexis Pister [Inria]
- Mickael Sereno [Inria]
- Natkamon Tovanich [Institut de recherche technologique System X, until February 2022]
- Lijie Yao [Inria]
Technical Staff
- Christian Poli [Inria, Engineer]
- Gaelle Richer [Inria, Engineer, from Jun 2021]
Interns and Apprentices
- Sara Di Bartolomeo [Inria, from Jun 2021 until Sep 2021]
- Valentine Ducerf [Ecole normale supérieure Paris-Saclay, from Apr 2021 until Jul 2021]
- Tingying He [Inria, from Mar 2021 until Aug 2021]
- Ameya Baburao Patil [Inria, from Jun 2021 until Sep 2021]
- Selena Pere [Inria, from Feb 2021 until Apr 2021]
- Nathan Van Hille [Inria, from May 2021 until Oct 2021]
Administrative Assistants
- Katia Evrat [Inria, Jan 2021]
- Katia Evrat [Inria, from Feb 2021]
Visiting Scientist
- Raimund Dachselt [Technical University Dresden, Germany, Oct 2021]
External Collaborators
- Paolo Buono [Université de Bari - Italie]
- Paola Tatiana Llerena Valdivia [Telecom ParisTech, until Oct 2021]
- Evelyne Lutton [Institut national de recherche pour l'agriculture, l'alimentation et l'environnement, HDR]
- Catherine Plaisant [Université du Maryland - College Park USA]
2 Overall objectives
2.1 Objectives
Aviz (Analysis and VIsualiZation) is a multidisciplinary project that seeks to improve data exploration methods, techniques, and tools based on Interactive Visualization. Visualization, in general, refers to the graphical representation of data or concepts to aid access, distribution or explanations of data. Card et al. give a general definition for visualization as
“the use of computer-supported, interactive, visual representations of data to amplify cognition.” 73
Taking this definition, visualization is a means of creating visual aids that lead to insight in the underlying data sets. It is not about producing nice pictures but about making data understandable and explorable so that visualizations help viewers gain knowledge about the data. It is about aiding the process of forming a mental model for the acquired data and so helping the viewer to understand underlying concepts, patterns, and connections within the data 133. In partiular, visualization has the goal to improve humans' sensemaking of complex data by taking advantage of the capabilities of their vision system: visual information can be processed in parallel and with a high bandwidth into the human cognitive centers 143. Ware defines five advantages of visualization 143:
- Comprehension: Supports the comprehension of large amounts of data.
- Pattern Perception: Previously unnoticed properties of data may emerge.
- Problem Analysis: Problems within the data may become immediately apparent.
- Adaptability: facilitates understanding of large- and small-scale features of data.
- Interpretation: Hypothesis formulation is facilitated.
Three main areas of visualization have evolved in the computer science community: Scientific Visualization, Information Visualization, and Visual Analytics. Scientific visualization is primarily concerned with displaying real or simulated scientific data. Basic visualization techniques for this area include surface rendering, volume rendering, and animation. Typical examples include processing of satellite photographs, fluid flows, or medical data. Datasets in information visualization typically come from large information spaces or information systems and are both structured or unstructured. Examples include network data, multi-dimensional tables of abstract measurements, or unstructured data such as text. Visual analytics, finally, is concerned with augmenting human-led data exploration with automatic techniques such as machine learning. The Aviz team has expertise in all three areas of visualization.
As shown in
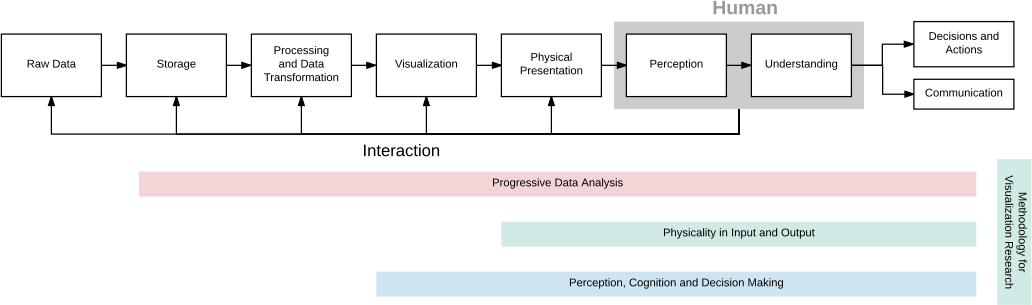
On the system side, we want to expand the scope of visualization that is currently limited to relatively small datasets and relatively simple analytical methods. To achieve scalability in visualization, we will focus on a paradigm shift: progressive data analysis. Long-running computations currently hamper the exploration and visualization process because human's attention is limited by latency constraints. We want to design exploratory systems that provide continuous feedback and allow interactions at any time during computation. The new progressive data analysis paradigm offers these capabilities, but to be usable, it requires the whole analytical pipeline to be re-implemented, and visualization and interaction techniques to be adapted.
2.2 Research Themes
Aviz's research on Visualization and Visual Analytics is organized around four research themes, described in more detail in the next section. Instead of addressing point problems, each research theme will address several stages of the visualization pipeline in a holistic manner, as summarized in
1. Progressive Data Analysis will address visualization scalability problems. Existing data analysis systems (such as Tableau 137, R 138, or Python with its data analysis ecosystem 109) are not scalable for exploratory analysis because their latency is not controllable. This theme will lay out the foundations of progressive data analysis systems, which generate estimates of the results and updates the analyst continuously at a bounded pace. It will focus on all the stages of the data analysis pipeline: data management mechanisms, data analysis modules, as well as visualizations, perception, understanding, and decision making.
2. Physicality in Input and Output will seek to better understand the benefits of physicality for information. Although beyond-desktop environments for visualization are generating more and more interest, theories and empirical data are lacking. This theme will consolidate the nascent areas of data physicalization, situated visualization, and immersive visualization.
3. Perception, Cognition, and Decision Making will study how we perceive and understand visualizations in order to develop generalized guidelines for optimizing effectiveness. It will generalize results obtained with simple charts to more complex visualizations of large datasets, establish theories on the use of abstraction in visualization, and contribute new empirical knowledge on decision making with visualizations.
4. Methodologies for Visualization Research will develop new methods to ground the study of the above scientific questions, and to benefit visualization more generally. This theme will develop evidence-based strategies for communicating quantitative empirical findings, and will promote methodological discussions and open research practices within the field.
3 Research program
3.1 Progressive Data Analysis
Permanent involved: Jean-Daniel Fekete
While data analysis has made tremendous progresses in scalability in the last decade, this progress has only benefited “confirmatory” analysis or model-based computation; progress in data exploration has lagged behind.
Existing data analysis systems do not support data exploration at scale because, for large amounts of data or for expensive computations, their latency is not controllable: computations can take minutes, hours, even days and months. Cognitive psychologists have shown that humans cognitive capabilities degrade when latency increases 125, 132. Miller 125 points out that the feedback of a system should remain below 10 seconds to maintain the user's attention. Therefore, to try to limit the latency, analysts currently resort to complex, inefficient, and unsatisfactory strategies, such as sampling with its issues related to representativity.
To address the scalability problem under controlled latency, instead of performing each computation in one long step that forces the analyst to wait for an unbounded amount of time, a progressive system generates estimates of the results and updates the analyst continuously at a bounded pace. The process continues until the computation is complete, or it stops early if the analyst considers that the quality of the estimates is sufficient to make a decision. During the process, a progressive system allows users to monitor the computation with visualizations and steer it with interactions.
While the topic of progressive data analysis has started to emerge in the late 90's, it has remained marginal practically because it touches three fields of computer science that are traditionally separate: data management, data analysis, and visualization. Research on progressive data analysis remains fragmented; the solutions proposed are partial and the different solutions cannot always be combined. We have organized a Dagstuhl seminar on Progressive Data Analysis and Visualization 85, 139 that acknowledged the harm of this topical separation and devised a research agenda. Aviz will participate in this agenda with specific assets.
Aviz has recently started to design and implement the ProgressiVis language
that is natively progressive 86.
The language relies on a Python interpreter but its execution semantics is
different in the sense that all the operations that would take time to
execute are performed progressively.
The ProgressiVis system touches all the stages of the conceptual data analysis pipeline of
- Progressive language kernel and data management mechanisms
- Progressive algorithms and computation strategies
- Progressive visualizations
- Management of uncertainties, computed from the algorithms and conveyed to the analysts.
Language:
ProgressiVis relies on a Python interpreter that is convenient for quick prototyping but is inefficient. Once the semantics of the language and its core libraries become clearer, we will replace the implementation with a C++ library that will improve performance and allow its integration in other popular data science environments such as R and Julia. We are collaborating with colleagues in the database community to tackle the challenges related to progressive data management 139, 58.
Algorithms:
Existing libraries implementing algorithms are either “eager”, sometimes “online”, and more rarely “streaming”, but very few are compatible with our progressive paradigm. We have started to work in collaboration with the University of Seoul and the University of Delft on the problem of converting existing algorithms into a progressive form. We currently have a running version of approximate k-nearest-neighbors 107, kernel density estimation 107, k-means clustering, multidimensional projection using t-SNE 107, and several other core algorithms. We want to further expand the range of algorithms we can support, and better understand how algorithms could be transformed into their progressive counterpart.
Progressive computation can trade speed, memory, and quality. When analysts want to compute rough estimates of their results quickly, several progressive algorithms offer parameters to control the tradeoffs. For example, our progressive k-nearest-neighbors algorithm 107 allows choosing the number of k-d-trees that influences the memory footprint, accuracy, and speed. Progressive data analysis also uses and adapt streaming algorithms, also called “data sketches” 87, that offer various tradeoffs between speed, memory, and quality.
Visualizations:
Like algorithms need to be adapted or transformed, visualization techniques and user interfaces also need to be adapted to be used in a progressive setting. For the visualization pipeline, including the rendering phase, there has been previous work related to progressive layout computation and progressive rendering. For example, in network visualization, there is a old tradition of using iterative force-directed solvers and showing their results progressively when computing complex graph layouts. We want to generalize this approach to all the visualizations. In the recent years, we have collaborated on work related to the progressive computation of multidimensional projections, including PCA and t-SNE 129, 107, and will continue to improve the scalability of projection methods. Progressive rendering is popular in the real-time computer graphics and gaming domains, but new in visualization. Our colleague Renaud Blanch from Grenoble has started to investigate this problem 70 by designing a rendering engine that can visualize and filter a large amount of data in interactive time, transiently simplifying details when necessary. We will also explore this problem both in the context of direct rendering, when the GPU shares the memory performing the computations, and web-based rendering.
We have also started to explore the problem of requirements for progressive user interfaces 57, leading the community of researchers to understand that progressive systems need to provide effective assessments of the quality of their results to allow analysts to make early decisions. This justifies the next research topic on the management of uncertainties. We have also started to propose new data models for managing aggregated visualizations 108. We will now continue our research to adapt existing visualization techniques and interaction environments to deal with progressive results and parameter steering.
Management of uncertainties
When performing exploratory data analysis on large data, analysts start by trying some algorithms with different parameters until they obtain useful results. Therefore, it is of paramount importance to be able to realize that a specific algorithm or a specific set of parameters are not leading to a useful result and to abort an analysis before it ends to explore other methods. On the other side, in many circumstances when data is “well-behaved”, progressive algorithms achieve very good results quickly, and analysts can make a decision before the end of the algorithms' execution. The assessment of a quality measure related to a computed result is a complex problem, already tackled by other communities (e.g., streaming, approximate queries). Progressive Data Analysis adds two problems: 1) controlling uncertainty during progressive computations, and 2) conveying the results of this uncertainty in a way understandable by analysts, while avoiding possible cognitive biases such as priming and anchoring 110.
To control the uncertainty during the progression of a computation, methods related to Sequential Analysis 88 should be used. They are well-known in the area of clinical trials and have evolved recently to manage large amounts of data while controlling time or quality in Approximate Query Databases such as BlinkDB 54. These approaches should be further adapted for progressive data analysis.
The topic of human cognitive bias will be developed further in
3.2 Physicality in Input and Output
Permanents involved: Pierre Dragicevic, Petra Isenberg, Tobias Isenberg, Jean-Daniel Fekete
In the past few years, researchers at Aviz have begun to investigate beyond-desktop environments for visualization 96, 97, 101, 120. In particular, our team has made important contributions in the areas of large-display visualizations 94, 69, 93, tangible interaction for scientific visualization 61, 59, 63, and data physicalization 102, 106, 104, 119. We will pursue and consolidate this stream of research by focusing on how to leverage physicality in visualization, both as an input channel and as an output channel. We will more specifically i) lay out the scientific foundations for data physicalization; ii) explore physically-situated and physically-embedded visualizations for personal analytics; and iii) study augmented-reality-based scientific visualization.
3.2.1 Scientific Foundations for Data Physicalization
In the next few years, we will work on establishing and consolidating the new area of data physicalization. Data physicalization is an emerging cross-disciplinary research area that examines how computer-supported, interactive physical representations of data, that we call “data physicalizations”, can support cognition, communication, learning, problem solving, and decision-making 104, 45. In contrast to traditional graphical on-screen data visualizations, physicalizations show data in a material form.
Although the research community, and especially the members of Aviz, have made first steps by conducting initial experiments 102 and laying out a research agenda 104,1 the area still lacks a theoretical and empirical foundation that can guide the design of physical data representations, both static and dynamic 117, 118.
Data physicalizations can potentially offer a useful complement to flat (paper-based or screen-based) visualizations due to the ability of physical objects to tap on human skills such as active perception, depth perception, and non-visual senses; they may have the ability to support learning via direct manipulation, and can possibly engage broader audiences. However, there is currently little understanding of the underlying mechanisms, and the exact situations where physicality may be beneficial.
In particular, work in educational psychology and tangible user interfaces has shown that physical manipulation can facilitate cognition, while research on vicarious learning has suggested that people can also learn from observation. However, it is not clear which approach is the most effective, and no study so far has started to examine how previous findings generalize to data physicalizations. We will investigate to what extent manipulable physicalizations can support data-driven cognition compared to non-manipulable physical media such as paper, and to manipulable virtual media (e.g., computer graphics). We will investigate the perception, recollection and interpretation of a data physicalization when people watch it being animated vs. they manipulate it themselves, vs. they watch a third-person manipulate it. We will attempt to conduct this research in collaboration with Barbara Tversky (Professor Emerita of Psychology at Stanford University, Professor of Psychology and Education at Columbia University, and President of the Association for Psychological Science), with whom we have been in close contact.
We will also be working on a taxonomy of physicality, in order to better untangle the factors that distinguish physical from virtual displays, and to help the community develop a coherent terminology that will serve as a thinking and communication tool.
Although we have been involved in research on digital fabrication in the context of data physicalization 134 and despite the new and exciting advances in this domain, we might not pursue this line of research so we can better focus on the research questions mentioned previously. In other words, we will focus more on why build data physicalizations than on the how.
3.2.2 Situated Data Representations for Personal Analytics
In addition to studying physical representations of data, we will study how embedding data visualizations in the physical world can empower people to make effective use of their personal data in a variety of application contexts. People generate data in many areas of daily life (e. g., data generated from shopping cards, fitness and health data). However, these types of personal data are often only exploited by the companies capturing it while they remain unused by the people who “generated” them. Rarely is personal data subjected to an in-depth analysis and used for reflection and decision making.
Personal visual analytics is a new and growing area of research 91, but has mostly focused on desktop and mobile applications. With our work we want to go beyond the traditional platforms of personal data analytics by using situated data visualizations. In a situated data visualization, the data is directly visualized near the physical space, object, or person it originates from 145. For example, a person may attach small e-ink displays embedded with sensors at various locations of their house or their workplace, to better understand their use of space, of equipment, or of energy resources. Or a person who wishes to exercise more may use an augmented reality device to visualize their past running performance in-place. New situated data visualizations like these can surface information in the physical environment—allowing viewers to interpret data in-context and take action in response to it. Because they will make it possible to explore personal data and take action in relevant physical locations, situated visualizations of personal data have the potential to radically transform how people relate to data.
This research will investigate how situated visualizations of personal data can help address problems faced by the general public by investigating a range of research hypotheses and application domains. For example, we will study how augmented reality technology can help surface digital traces of personal data in physical environments and enable people to make more informed decisions. We will also study how small, portable, and situated micro-visualizations can allow people to understand personal data in-place in changing, dynamic, and mobile contexts.
On this topic, we already have an “équipe associée” Inria grant with University of Calgary, and we are currently submitting an ANR PCR proposal in collaboration with Sorbonne Université and Université de Bordeaux.
3.2.3 Visualization using Augmented Reality Devices
Based on past work on the integration of various types of input and output devices for the visualization of inherently three-dimensional spatial data 61, 59, 63, 95, 121, 98, 99, 100, we investigate the use of, in particular, augmented reality (AR) head-mounted displays (HMDs). This combination of stereoscopically projected 3D data which provides a high amount of visual immersion with innovative interaction techniques that facilitate data exploration though immersion that arises from direct manipulation is part of the recently established subfield of visualization research which focuses on immersive analytics 84, 72 and promises to combine benefits of traditional virtual reality (VR) environments with those that use traditional, touch, or tangible input and used innovative interaction designs. We specifically focus on AR-based HMDs because they do not prevent us from using traditional data exploration environments such as workstations which are not only familiar to experts but also widely available. The AR HMD, moreover, is an easily maintainable device that does not rely on constant calibration and thus could more easily be integrated into and accepted by existing research facilities than more elaborate VR settings such as CAVEs.
Specifically, we currently have started two projects in this direction. One is a collaboration with particle physicists at the local linear accelerator laboratory as well as researchers at CERN with whom we are exploring an interactive data exploration tool of the experimental data generated at CERN from collisions of protons. In a second project we are working with climate researchers to explore novel collaborative data analysis scenarios in which several experts investigate 3D datasets together with the help of AR HMDs.
3.2.4 Other
In addition to the three major themes previously mentioned, Aviz has also been involved in research on the use of tangible input devices, both to navigate abstract data visualizations 103, 113 and to explore 3D data 99, 64, 62. We will continue this stream of research, possibly applying emerging trends in tangible input device design 89 to data exploration.
3.3 Perception, Cognition and Decision Making
Permanents involved: Steve Haroz, Pierre Dragicevic, Petra Isenberg, Tobias Isenberg, Jean-Daniel Fekete
As we collect increasingly large amounts of data in fields such as climate science, finance, and medicine, the need to understand and communicate that data becomes more important. Data visualizations (e.g., graphs, maps, infographics, etc.) are often used to give an overview of information, however it can be challenging to predict whether these visualizations will be effective before spending resources to develop them. Consequently, researchers make use of experimental methods from visual perception and cognition to study how we perceive and understand visualizations in order to develop generalized guidelines for optimizing effectiveness. While many past studies provide a research groundwork using simple and small visualizations (such as a bar graph with four bars), there has been little research on perception and cognition for more complex visualizations used for large datasets with thousands or millions of elements. Novel techniques researched by Aviz to alleviate complexity can be more effectively used if we understand when and why these techniques become beneficial.
3.3.1 Perceiving the Gist of a Visualization
It would be highly inefficient if users of large data visualizations serially inspected individual visual elemnts. Instead, the visual system allows people to quickly get a visual gist of an overall pattern in the image 136. But how quickly and reliably can we detect these gists when multiple groups or regions in a visualization need to be summarized seperately and compared? What happens to speed and accuracy as more items are added to a visualization? These open questions about the impact of data scale and complexity on visualization perception were discussed in the review article by Szafir, Haroz, Gleicher, and Franconeri 136. To answer these questions, the experiment methods and findings from visual perception can be employed. Specifically, “ensemble coding” is the term used by vision scientists to describe our ability to rapidly perceive simple statistical properties of sets without the need to inspect individual items. Research has shown that we can perceive averages for sets made of simple 55 and complex 135 objects as well as the variance of sets for simple objects 127. But it is not clear if or how we can answer more complex statistical questions about subsets within visualizations, such as:
- How different are trends between groups of line charts?
- Which group's trends are more variable?
- Is the distribution of trends uniform or normally distributed?
For the field of visual perception research, understanding how we make these statistical decisions with collections would be a novel contribution that helps explain how our brain represents and summarizes complex information, how much information is discarded to make rapid judgements, and when biases or accuracy limits arise when working with collections of items.
For the field of data visualization research, understanding the conditions when we can make these statistical judgements and the speed and precision with which we can make them will directly translate to new guidelines for optimal use of visualization for large datasets. Although much visualization software uses settings that rely on design intuition, these results would be the first science-based guidelines for large data visualization and progressive visualization.
3.3.2 Cognitive Limitations for Visually Selecting Subsets in Visualizations
A critical task for analyzing large data mentioned in the previous section is filtering and comparing subsets. But why and when are these filtering tasks difficult? And how can a visualization facilitate the identification of subsets – especially for data with many categories?
How much information we can visually select and attend to and the minimum size of a selection are strongly limited, and this limitation is impacted by the layout of items in an image and the types of visual features and tasks employed 90. Past visual cognition research on the cause of attentional limits 92 generally presumed that we focus on information in a roughly circular region. But subsets in a visualization are often irregularly shaped, and the limitations of attention selection for more chaotic images like visualizations are not understood. Researching how people select irregularly shaped subsets would be a novel contribution to our understanding of visual cognition and could inform how progressive visualization techniques can show datasets such that all subsets can be visually compared.
3.3.3 Illustrative Visualization
We will continue our work in the area of illustrative visualization. This sub-field of visualization takes inspiration from illustrators' decades to centuries of experience in using knowledge from perception and cognition to better portray scientific subject matter. Another input arises from the field of non-photorealistic rendering which has developed numerous techniques of stylizing images and other input data. Traditionally, illustrative visualization has thus been applied primarily to data with a concrete spatial mapping in 2D and, more frequently, in 3D space. Nonetheless, some efforts for understanding the potential benefit of illustrative visualization to non-spatial data have been documented, including some of our own team 78, 56. An interesting aspect in this context is the role of depiction style can play in how visualizations or other forms of depiction are interpreted and understood. For example, we recently investigated the effect of stylization on emotion for images 66, and will extend this work in the future to study how we can use stylization to change the way people perceive, consume, and understand visualizations. One hypothesis to investigate, for example, is that a more hand-drawn depiction style 83 could lead to viewers spending more time with a visualization, and thus take more time to understand and interact with it.
Another main future direction of research in this context is the question of what the role of abstraction is in illustrative visualization 141 as well as visualization in general, and specifically how we can provide dedicated means to control the abstraction being applied to visual representations of data. This means that we need to go beyond seeing abstraction only as a side-product of stylization as it has traditionally been viewed in many approaches in non-photorealistic rendering as well as illustrative visualization to date, and investigate how we can interactively adjust it to provide practitioners with a means to find the best visual representations for a given task. For example, we have investigated this question recently in the context of structural biology 124, 146 and DNA nanostructures 123, 122, but also want to expand this work to other application domains in the future.
3.3.4 Decision Making with Visualizations
Aviz has recently started a novel stream of research on the topic of judgment and decision making with visualizations 76, 75, 77. Human decision making and cognitive biases are important research topics in the fields of psychology, economics and marketing, but until recently, the presence of cognitive biases in visualization-supported decision making has not been investigated. Yet, visualization systems are increasingly used to support decision making: large companies switch to visualization solutions to improve their decisions in a range of areas, where large sums of money or human lives are at stake. More and more, the ultimate goal of visualization is not to understand patterns in the data and get insights as was traditionally assumed, but to make good decisions. In order to fully understand how information visualizations can support decision making, it is important to go beyond traditional evaluations based on data understanding, and study how visualizations interact with human judgment, human heuristics, and cognitive biases.
We will pursue this important stream of research by investigating yet-unexplored areas, such as group decision-making with visualizations, decision making in the presence of uncertainty and incomplete information (in connection with the topics discussed in Sections 3.1 and 3.4.2), and the use of visualizations to support social choice and group decisions in the presence of conflicts of interest. How cognitive biases interact with visual perception is also an important and difficult question that has remained largely unexplored. In terms of application domains, we will be focusing more on evidence-based decision making in everyday life, e.g., how can visualizations be useful (or harmful) when choosing medicines, food products, means of transportation, charity donations, or when electing politicians. For example, a recent study has investigated whether specific infographic designs can lead people to feel more empathy towards suffering populations 71, but with inconclusive or negative results. In collaboration with the University of Campina Grande in Brazil, we are currently investigating designs that we believe are more likely to be effective. We will be evaluating these designs using metrics that are more likely to be correlated with prosocial decision making than empathy, as it has been shown that the emotion or empathy is not always conducive to helping behavior.
3.4 Methodology for Visualization Research
Permanents involved: Petra Isenberg, Steve Haroz, Pierre Dragicevic, Tobias Isenberg
An important aspect of any scientific research is to establish and follow rigorous and effective methodologies for acquiring new knowledge. In the field of Visualization in particular, scientific discourse on the validity, use, and establishment of methodologies is important as the field is highly interdisciplinary, with diverse influences and opinions. It is important to establish, for example, what level of rigor the field should require of its methods, how to choose among established methods and methodologies, and how to best communicate the results of our empirical research. Aviz researchers have in the past been very active in contributing critical reflection on ways to assess different forms of value offered by visualization and visual analytics research and design (e. g., 80, 105, 111, 112, 115, 130, 142). This included work on novel research methods but also existing methods and tools such as statistics. As part of the new team we will focus our efforts on three main topics related to visualization research methodologies.
3.4.1 Promoting and Following Open Research Practices
Fundamental tenants of scientific research are that it is accessible, scrutinizable, and can be built-upon. For visualization research, the low rate of accessibility of both published articles and supporting materials makes it almost impossible to question the claims made in publications or to extend them. We measured the state of some of these issues for the IEEE VIS conference, finding serious problems across every facet of openness 114:
- Open Artifacts: Questioning the veracity of research claims is difficult if the supporting evidence and methods are not available for scrutiny. Without these supporting research artifacts, reviewers and readers cannot thoroughly verify, replicate, or reproduce research, and readers may have difficulty extending and applying research. Such artifacts include but are not limited to: Code, resource files, parameters, sample datasets, and documentation needed to reproduce software, toolkits, or experiment procedures Raw empirical data collected or analyzed to support a paper’s conclusions Analysis code or scripts used to support a paper’s conclusions
- Transparency in Decisions: To clarify distinctions between exploratory and confirmatory research, to reduce hidden flexibility in research (i.e., unreported researcher degrees of freedom 144, and to minimize publications bias, researchers must be educated about the impact of these issues and use approaches such as preregistration and registered reports where appropriate 128114.
- Transparency in statistical reporting: Researchers must report the outcomes of their statistical analyses in a way that does not prompt misinterpretations. This aspect will be further developed in the next subsection.
For these issues to be addressed, educational materials and guidelines need to be written, so researchers have clarity about how to make their research more credible. Moreover, Aviz members are working with the organizing bodies of the visualization research community to establish incentives for making research artifacts and potentially establish minimal requirements for openness in published articles. Meanwhile, it is important to continue measuring and cataloging openness in the field to monitor progress. The goal is to improve the credibility and applicability of the field’s research.
3.4.2 The Communication of Statistics Results
Statistics are tools to help end users accomplish their task. In experimental sciences, to be qualified as usable, statistical tools should help scientists advance scientific knowledge by supporting and promoting the effective communication of research findings. Yet many areas of experimental science have adopted tools that have proven to be poor at supporting these tasks 79. One very common but particularly damaging practice is “dichotomous inference”, i.e., the classification of statistical evidence as either sufficient or insufficient, for example by looking at whether a p-value is above or below the .05 threshold 60. Dichotomous inference encourages practices that distort the scientific literature, such as publication bias, outcome reporting bias, and significance chasing 140. All of these issues contribute to making published studies less trustworthy and less likely to replicate.
A commonly advocated solution is to focus on effect sizes and their interval estimates rather than on p-values. However, interval estimates do not offer a sure protection against dichotomous inference 60. Therefore, many modern statisticians and methodologists urge researchers to think of evidence as gradual rather than binary when interpreting their results, irrespective of the statistical methods used. However, there is a lack of guidance on how to do to so. We will be conducting research on how to design statistical charts that prompt nuanced interpretations, and more generally, charts that convey statistical uncertainty in a honest and transparent manner. The two main targeted populations will be i) experimental scientists (who use research papers as a medium to communicate about scientific findings) and ii) the general population (who use newspapers and online articles to inform themselves about recent science advances). One goal will be to develop guidelines for faithful statistical communication that are evidence-based instead of being based on personal opinions. This research lies at the intersection of statistical cognition 67 and information visualization.
Besides studying visual representations that encourage non-dichotomous inferences, we will pursue one line of research we just started at Aviz, which considers the research paper as a user interface, and seeks to look at how this interface can be improved to help scientists communicate their results in a more transparent manner than using conventional research papers 82.
As a longer-term goal, we are planning to develop conceptual models in order to better understand and better reflect about the diverse phenomena underlying data-driven scientific communication. This includes the process of communicating empirical data between scientists, from scientists to people, and from journalists to people: we will attempt to better understand and describe the entire information pipeline, where information can be lost or distorted, and how to make the pipeline more robust to [self-]deception 81.
3.4.3 Shaping the Scientific Visualization Community
In the past, Aviz researchers have been heavily involved in the organization structure of IEEE visualization conferences, the most prestigious conference in our field, by proposing workshops, tutorials, serving on various organizing committees, steering committees, editorial boards, and even the IEEE Visualization Executive Committee that oversees the whole IEEE Visualization conference. We will continue to do so but will, in addition, be involved in newly created committees that help to restructure the community and prepare it for future growth and inclusivity. We will, in particular, aid the process by providing data collection and analysis services through the vispubdata.org dataset that we are collecting, cleaning, and making available to the community. The dataset has already been used in research (e. g., 116) but also to shape the scientific community by proposing program committee members, new processes, and is currently used by the Visualization Restructuring Committee (ReVISe). We are also involved in the EuroVis community and participate at multiple levels to its organization and management.
4 Application domains
4.1 Natural Sciences
As part of a CORDI PhD project, we collaborate with researchers at CERN on interactive data visualization using augmented reality, with the goal to better understand this new visualization environment and to support the physicists in analysing their 3D particle collision data. As part of another CORDI PhD project, we collaborate with researchers at the German Center for Climate Computation (DKRZ) and the Helmholtz-Zentrum Hereon (formerly Helmholtz-Zentrum Geesthacht, HZG), to better understand collaborative data exploration and interaction in immersive analytics contexts. Finally, as part of the Inria IPL “Naviscope,” we collaborate with researchers at INRAE (as well as other Inria teams) on interactive visualization tools for the exploration of plant embryo development.
4.2 Social Sciences
We collaborate with social science researchers from EHESS Paris on the visualization of dynamic networks; they use our systems (GeneaQuilts 68, Vistorian 131, PAOHVis 28, PK-Clustering 4) and teach them to students and researchers. Our tools are used daily by ethnographers and historians to study the evolution of social relations over time. In the social sciences, many datasets are gathered by individual researchers to answer a specific question, and automated analytical methods cannot be applied to these small datasets. Furthermore, the studies are often focused on specific persons or organizations and not always on the modeling or prediction of the behavior of large populations. The tools we design to visualize complex multivariate dynamic networks are unique and suited to typical research questions shared by a large number of researchers. This line of research is supported by the DataIA “HistorIA” project, and by the “IVAN” European project. We also collaborate on the BART initiative, a joint project with IRT-SystemX on the analysis and visualization of blockchain data, in collaboration with economists from Université Paris-Saclay.
4.3 Medicine
We collaborate with the Health-Data-Hub on the analysis and visualization of CNAM Data “parcours de santé” to help referent doctors and epidemiologists make sense of French health data. In particular, we are working on a subset of the CNAM Data focused on urinary problems, and we have received a very positive feedback from doctors who can see what happens to the patients treated in France vs. what they thought happened through the literature. This project is starting but is already getting a lot of traction from our partners in medicine, epidemiology, and economy of health.
5 Social and environmental responsibility
5.1 Impact of research results
Aviz' work on illustrative visualization (e. g., see Sections 3.3.3 and 8.3) has the potential to be integrated into future teaching materials for students in schools, visitors in museums, or similar.
Aviz' work on visualization of large documents corpora with Cartolabe is used to present the results of the French “Grand débat”, as well as other citizen expressions.
Aviz' work on anthropographics (Section 8.6) is aiming at improving assistance to populations in need.
Open science: Aviz regularly shares full research material on the repository of the Center for Open Science to facilitate scrutiny, reuse, and replication:
- Antropographic studies 34 – osf.io/xqae2/
- Anthropographics Design Space 126 – osf.io/wfgmp/
- Open Science Tutorial – osf.io/vfnwp/
- Point specification in AR 23 – osf.io/43j9g/ and osf.io/7a6yr/
- Readability of micro visualizations on mobile devices – osf.io/yz8ar/
- Reducing Affective Responses to Surgical Images through Color Manipulation and Stylization 65 – osf.io/4pfes/ and osf.io/34vzj/
- Selection techniques for tightly packed 3D objects 32 – osf.io/cewhn/ and osf.io/yze5n/
- Smart watch survey – osf.io/nwy2r/
- Spatial 3D Visualization interfaces 8 – osf.io/jtx75/
- Study on the discovery and selection of cells in 3D plant embryo datasets – osf.io/yze5n/
- Threats of a Replication Crisis in Empirical Computer Science 74 – osf.io/hkqyt/
- Transparency of CHI Research Artifacts – osf.io/csy8q/
- User Study of Annotation 3D Placements in Collaborative Augmented Reality Environments – osf.io/7a6yr/
- VIS open practice resources – osf.io/dc6mt/
- Visualization errors and bias 15 – osf.io/u8ejr/
6 Highlights of the year
6.1 Awards
Best paper award for
- IEEE VIS 2021: Wesley Willett, Bon Adriel Aseniero, Sheelagh Carpendale, Pierre Dragicevic, Yvonne Jansen, Lora Oehlberg, and Petra Isenberg. "Perception! Immersion! Empowerment!: Superpowers as Inspiration for Visualization." IEEE Transactions on Visualization and Computer Graphics (2021).
Best paper runner-up/honorable mention award:
- IEEE ICBC 2021: Natkamon Tovanich, Nicolas Soulié, Nicolas Heulot, Petra Isenberg. "An empirical analysis of pool hopping behavior in the Bitcoin blockchain." IEEE International Conference on Blockchain and Cryptocurrency.
7 New software and platforms
Natkamon Tovanich developed and tested MiningVis, a visual analytics system for studying mining activities across the history of the bitcoin blockchain.
7.1 New software
7.1.1 Cartolabe
-
Name:
Cartolabe
-
Keyword:
Information visualization
-
Functional Description:
The goal of Cartolabe is to build a visual map representing the scientific activity of an institution/university/domain from published articles and reports. Using the HAL Database, Cartolabe provides the user with a map of the thematics, authors and articles . ML techniques are used for dimensionality reduction, cluster and topics identification, visualisation techniques are used for a scalable 2D representation of the results.
Cartolabe has in particular been applied to the Grand Debat dataset (3M individual propositions from french Citizen, see https://cartolabe.fr/map/debat). The results were used to test both the scaling capabilities of Cartolabe and its flexibility to non-scientific and non-english corpuses. We also Added sub-map capabilities to display the result of a year/lab/word filtering as an online generated heatmap with only the filtered points to facilitate the exploration. Cartolabe has also been applied in 2020 to the COVID-19 kaggle publication dataset (Cartolabe-COVID project) to explore these publications.
- URL:
- Publication:
-
Contact:
Philippe Caillou
-
Participants:
Philippe Caillou, Jean-Daniel Fekete, Michèle Sebag, Anne-Catherine Letournel
-
Partners:
LRI - Laboratoire de Recherche en Informatique, CNRS
7.1.2 BitConduite
-
Name:
BitConduite Bitcoin explorer
-
Keywords:
Data visualization, Clustering, Financial analysis, Cryptocurrency
-
Functional Description:
BitConduite is a web-based visual tool that allows for a high level explorative analysis of the Bitcoin blockchain. It offers a data transformation back end that gives us an entity-based access to the blockchain data and a visualization front end that supports a novel high-level view on transactions over time. In particular, it facilitates the exploration of activity through filtering and clustering interactions. This gives analysts a new perspective on the data stored on the blockchain.
-
Authors:
Jean-Daniel Fekete, Petra Isenberg, Christoph Kinkeldey
-
Contact:
Petra Isenberg
7.1.3 PAOHvis
-
Name:
Parallel Aggregated Ordered Hypergraph Visualization
-
Keywords:
Dynamic networks, Hypergraphs
-
Functional Description:
Parallel Aggregated Ordered Hypergraph (PAOH) is a novel technique to visualize dynamic hypergraphs 28. Hypergraphs are a generalization of graphs where edges can connect more than two vertices. Hypergraphs can be used to model co-authorship networks with multiple authors per article, or networks of business partners. A dynamic hypergraph evolves over discrete time slots. A PAOH display represents vertices as parallel horizontal bars and hyperedges as vertical lines that connect two or more vertices. We believe that PAOH is the first technique with a highly readable representation of dynamic hypergraphs without overlaps. It is easy to learn and is well suited for medium size dynamic hypergraph networks such as those commonly generated by digital humanities projects - our driving application domain (see Fig. 4).
- URL:
-
Contact:
Paola Tatiana Llerena Valdivia
7.1.4 AR Collaborative Visualization
-
Name:
AR Collaborative Visualization
-
Keywords:
Augmented reality, Collaborative science, Android
-
Functional Description:
Allows to look at VTK datasets using AR-HMD (Microsoft HoloLens) in multi-users environments (i.e., one headset per user). A Multi-touch tablet is provided per user to manipulate the environment.
-
Contact:
Tobias Isenberg
7.1.5 MiningVis
-
Name:
MiningVis: Exploring the Bitcoin Mining Economy
-
Keywords:
Bitcoin, Visual analytics, Data visualization
-
Scientific Description:
https://hal.science/hal-03348145
-
Functional Description:
MiningVis aims to help analysts understand the evolution and dynamics of the Bitcoin mining ecosystem, including mining market statistics, multi-measure mining pool rankings, and pool hopping behavior. Each of these features can be compared to external data concerning pool characteristics and Bitcoin news.
-
Release Contributions:
This is the first version of the tool as described in the following publication: https://hal.science/hal-03348145
- Publication:
-
Contact:
Natkamon Tovanich
-
Participants:
Natkamon Tovanich, Petra Isenberg
-
Partner:
IRT SystemX
7.1.6 Statcheck Simple Edition
-
Keyword:
Statistics
-
Functional Description:
You can copy text with statistical tests, and Statcheck Simple Edition will detect statistical tests and check if they are correct.
- URL:
-
Contact:
Steve Haroz
7.1.7 ARSciVis
-
Name:
ARSciVis
-
Keywords:
Augmented reality, Data visualization
-
Functional Description:
This software allows to visualize, in a collaborative way, a set of data (for the moment .vtk datasets) with augmented reality headsets like the HoloLens. This software is composed of three major sub-software: -A server application to link all the devices. -An application for augmented reality headsets. -An application for multi-touch tablets which allow to interact with the data.
In order to avoid copying the code in the different sub-components, this application is also composed of several libraries written by me.
The whole software is based on the following libraries and technologies:
-The standard UNIX library -The Android SDK/NDK (with Java 8) -The Unity SDK -C#/.NET Core -GLM (MIT license or the Happy Bunny License (Modified MIT)) -lib3DS (LGPL v2.1 License) -libpng PNG Reference Library License version 2 (www.libpng.org/pub/png/src/libpng-LICENSE.txt) -VRPN (BSL licence, https://github.com/vrpn/vrpn/)
-
Contact:
MickaËl Sereno
7.2 New platforms
7.2.1 Vispubdata.org
Participants: Petra Isenberg [Inria Paris-Saclay, correspondent], Tobias Isenberg [Inria Paris-Saclay].
AVIZ members are making available for research a dataset of IEEE VIS publications at vispubdata.org. This dataset is actively being used for research and conference organization.
7.2.2 VisImageNavigator
Participants: Petra Isenberg [Inria Paris-Saclay, correspondent], Tobias Isenberg [Inria Paris-Saclay].
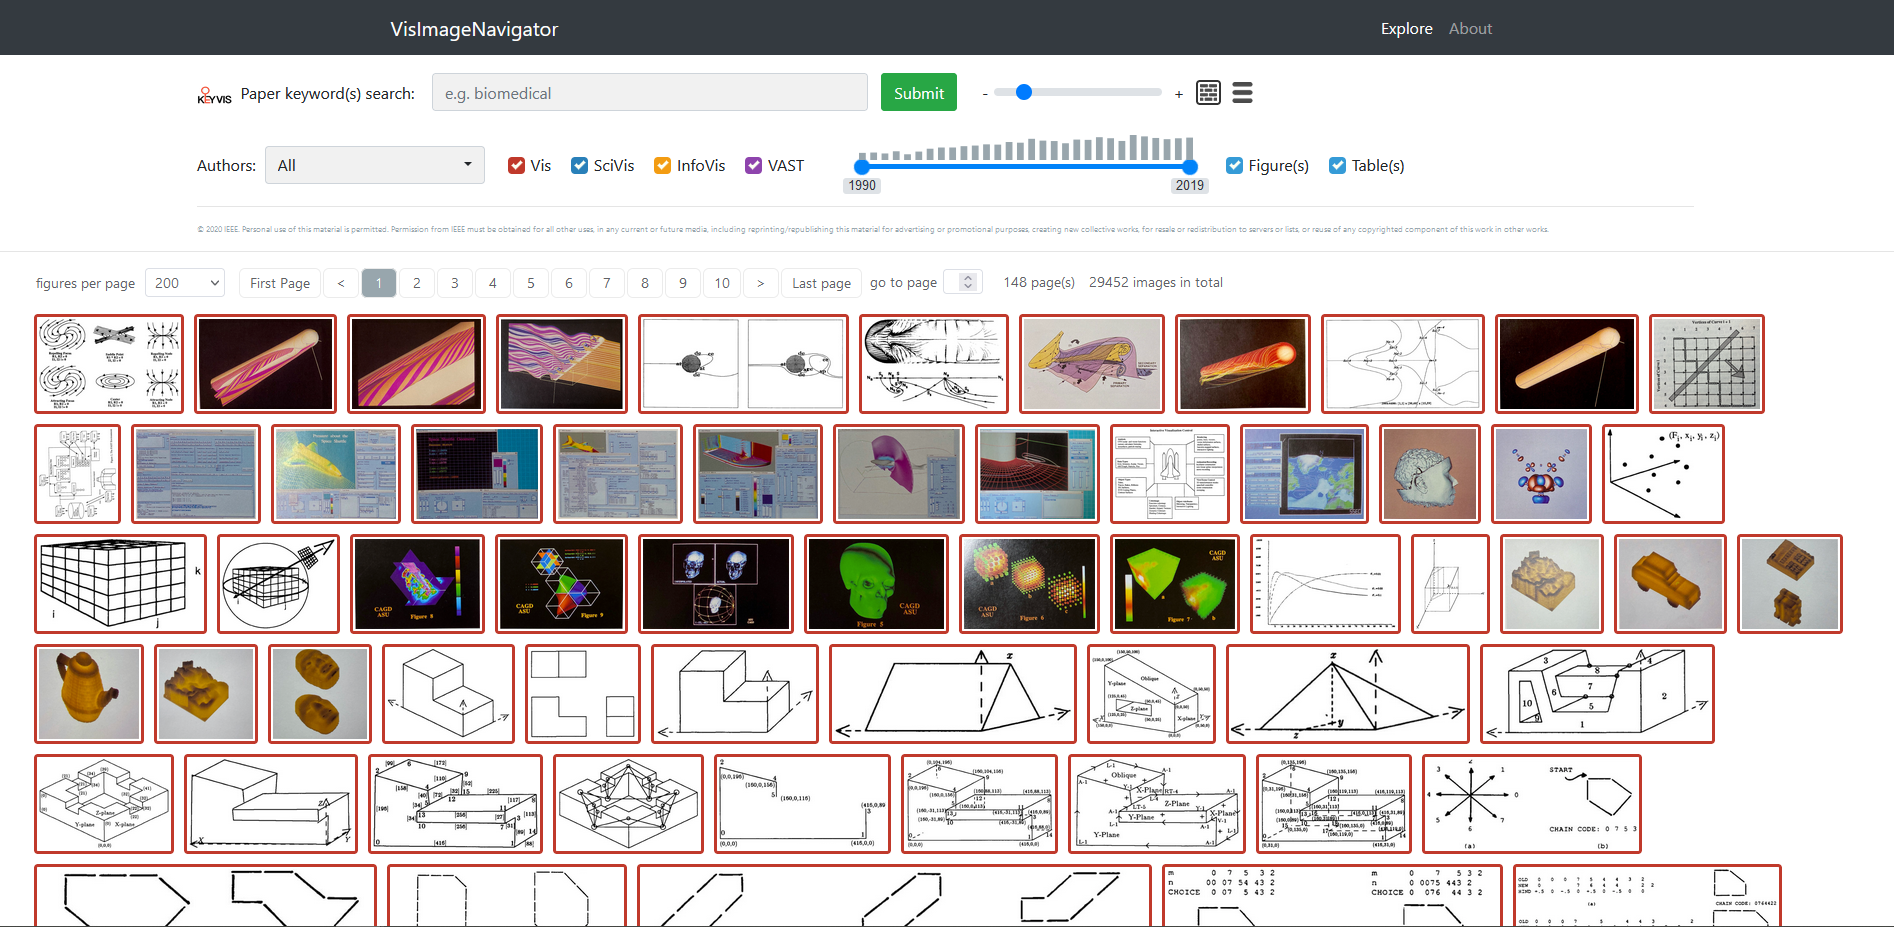
An image of the VisImageNavigator interface showing images collected from IEEE VIS papers in a grid format with several sliders and checkboxes to filter by time and conference.
AVIZ members are contributing to making available for research a dataset of IEEE VIS images at ieee-dataport.org/open-access/ieee-vis-figures-and-tables-image-dataset10. The set of images can be browsed online at vispubfigures.github.io/VisPubFigures/. The work is primarily led by Jian Chen at Ohio State University.
7.2.3 Gender in Visualization Dataset
Participants: Natkamon Tovanich [System X], Pierre Dragicevic [Inria Bordeau], Petra Isenberg [Inria Paris-Saclay, correspondent].
In the context of our paper on “Gender in 30 Years of IEEE Visualization” we make available data about the diversity of the Visualization community in terms of the gender of authors, organizing, and program committee members as well as award winners: www.aviz.fr/Research/Gender-in-Vis.
8 New results
8.1 Superpower-Inspired Framework for Data Visualization
Participants: Wesley Willett [Univ. Calgary], Bon Adriel Aseniero [Autodesk], Sheelagh Carpendale [Simon Fraser Univ.], Pierre Dragicevic [Inria Bordeaux], Yvonne Jansen [CNRS, LaBRI], Lora Oehlberg [Univ. Calgary], Petra Isenberg [Inria Paris-Saclay, correspondent].
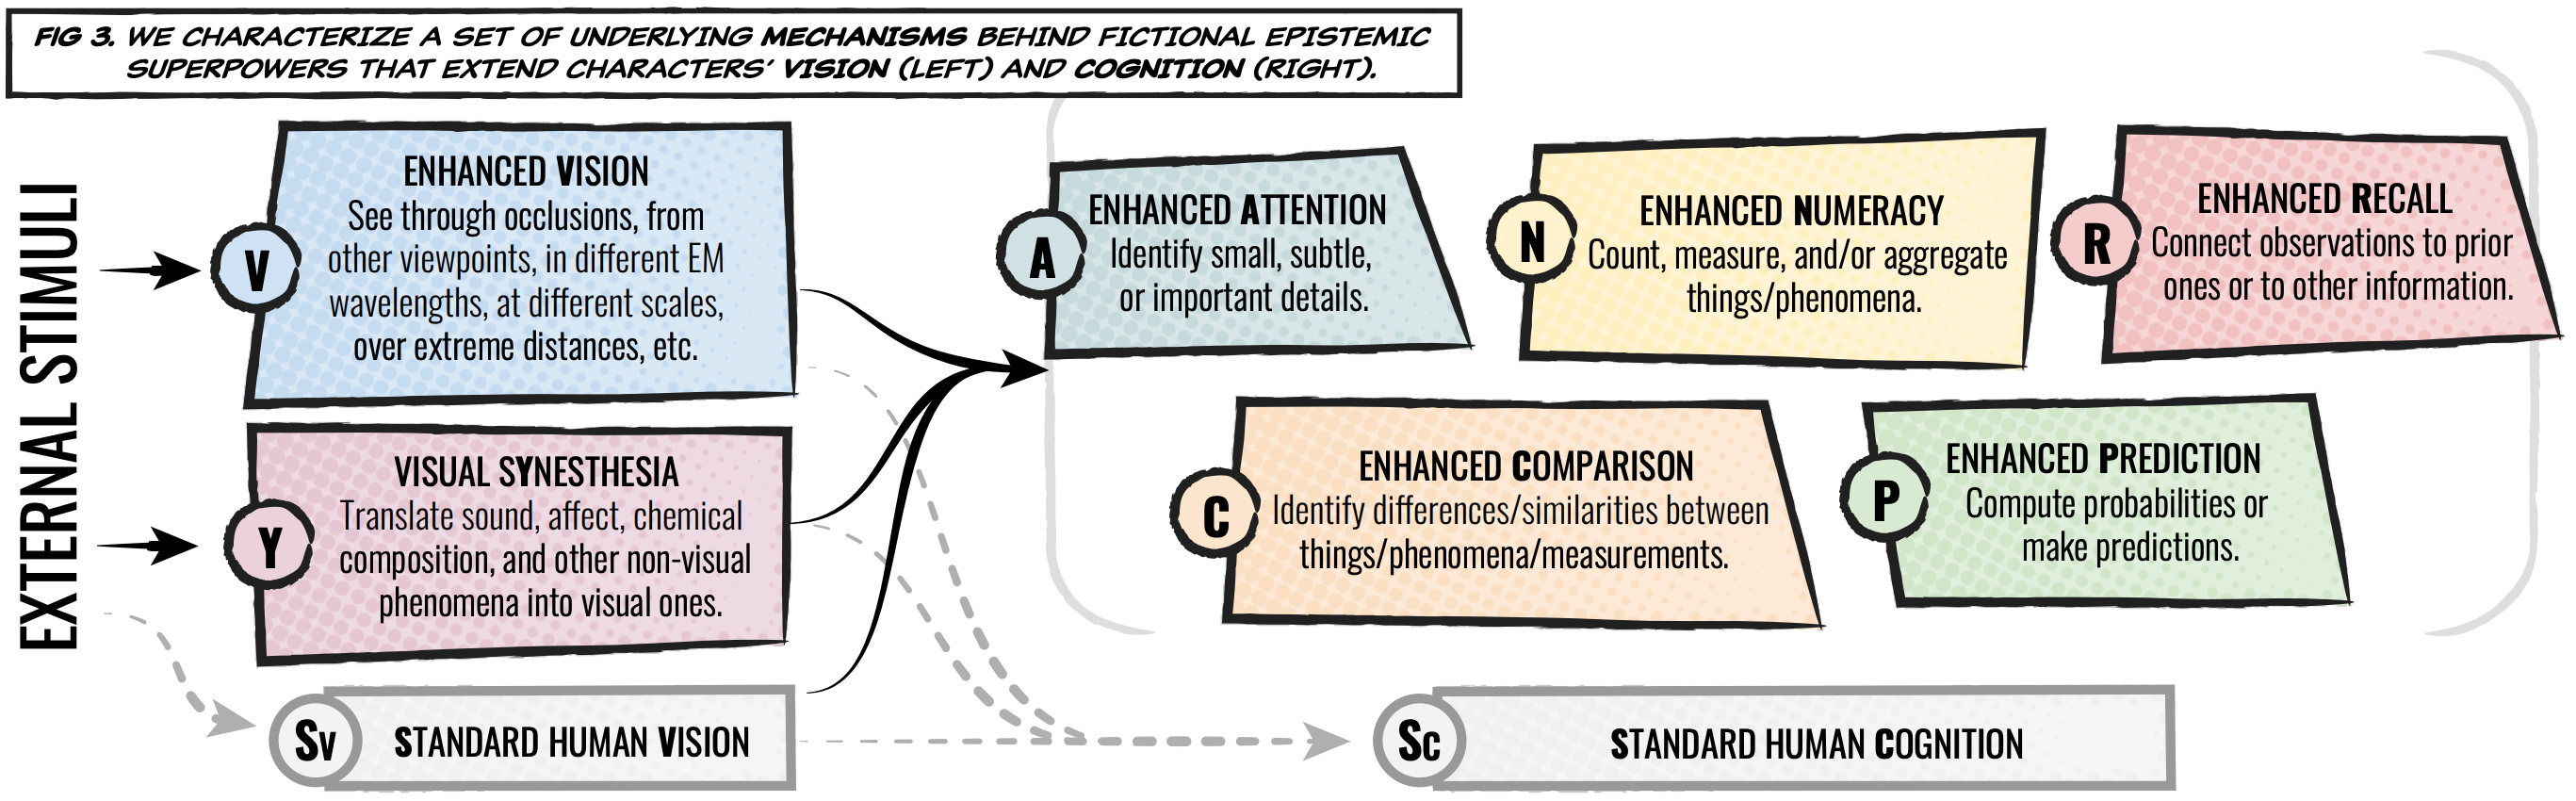
We explored how the lens of fictional superpowers can help characterize how visualizations empower people and provide inspiration for new visualization systems 29. Researchers and practitioners often tout visualizations' ability to “make the invisible visible” and to “enhance cognitive abilities.” Meanwhile superhero comics and other modern fiction often depict characters with similarly fantastic abilities that allow them to see and interpret the world in ways that transcend traditional human perception. We investigated the intersection of these domains, and showed how the language of superpowers can be used to characterize existing visualization systems and suggest opportunities for new and empowering ones. We introduced two frameworks: The first characterizes seven underlying mechanisms that form the basis for a variety of visual superpowers portrayed in fiction. The second identifies seven ways in which visualization tools and interfaces can instill a sense of empowerment in the people who use them. Building on these observations, we illustrated a diverse set of “visualization superpowers” and highlighted opportunities for the visualization community to create new systems and interactions that empower new experiences with data. Material and illustrations are available under CC-BY 4.0 at osf.io/8yhfz.
8.2 Visualization and Clustering of Hypergraphs
Participants: Jean-Daniel Fekete [correspondant], Paola Valdivia [Inria&Telecom Paris], Alexis Pister [Inria&Telecom Paris], Catherine Plaisant [Inria&Univ. of Maryland], Paolo Buono [Univ. of Bari].
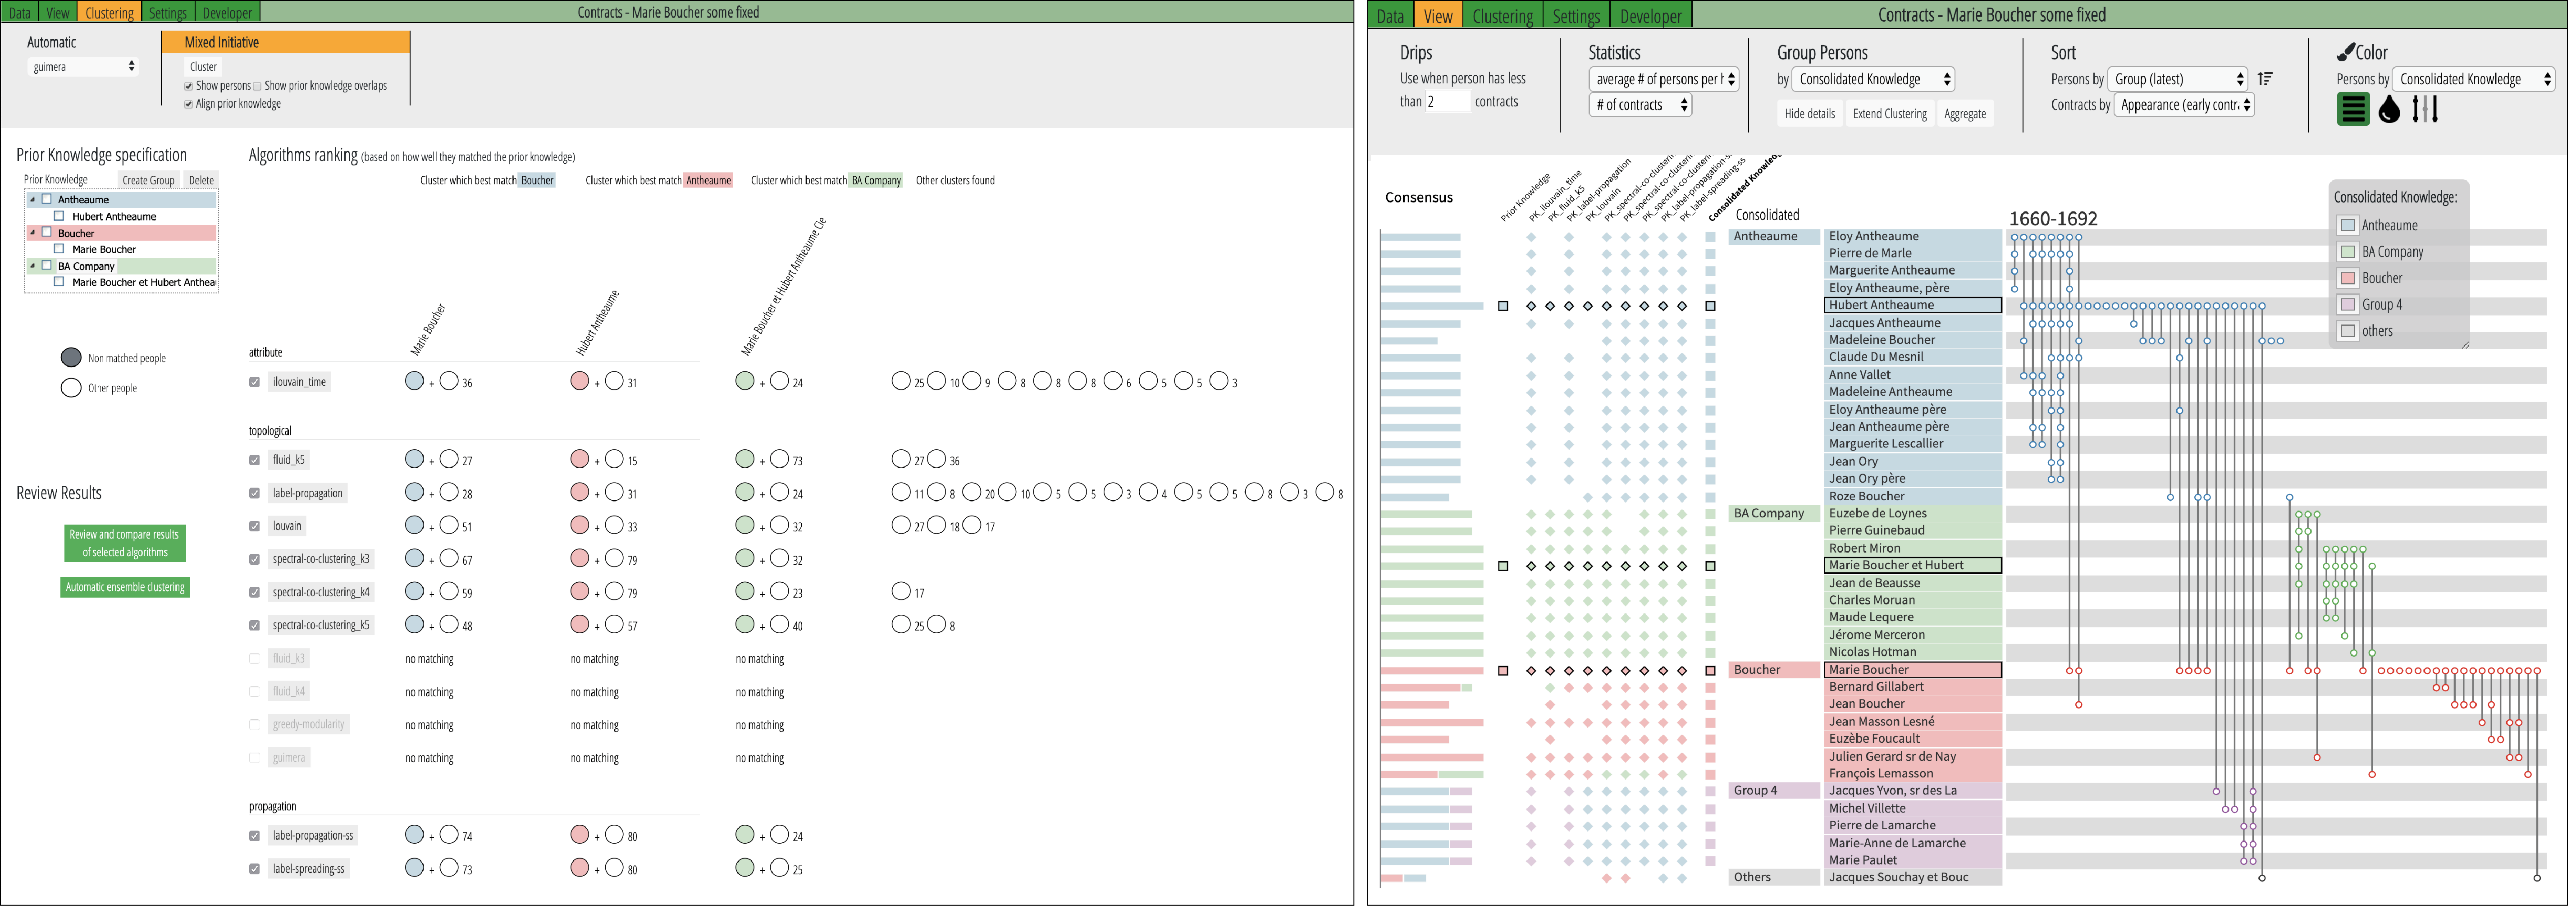
We propose a new paradigm, called PK-clustering 22, to help social scientists create meaningful clusters in social networks. Many clustering algorithms exist but most social scientists find them difficult to understand, and tools do not provide any guidance to choose algorithms, or to evaluate results taking into account the prior knowledge of the scientists. Our work introduces a new clustering paradigm and a visual analytics user interface that address this issue. It is based on a process that 1) captures the prior knowledge of the scientists as a set of incomplete clusters, 2) runs multiple clustering algorithms (similarly to clustering ensemble methods),3) visualizes the results of all the algorithms ranked and summarized by how well each algorithm matches the prior knowledge, 5)evaluates the consensus between user-selected algorithms and 6) allows users to review details and iteratively update the acquired knowledge. We believe our clustering paradigm offers a novel constructive method to iteratively build knowledge while avoiding being overly influenced by the results of often-randomly selected black-box clustering algorithms. PK-clustering relies the PAOHVis representation 28 for dynamic hypergraphs.
This work is conducted in the context of the HistorIA project funded by DataIA, and of the IVAN project.
More on the project web page aviz.fr/pkclustering.
8.3 Spatially controlled illustrative visualization of the genome
Participants: Sarkis Halladjian [Inria Paris-Saclay], Haichao Miao [TU Wien], David Kouřil [TU Wien], M. Eduard Gröller [TU Wien], Ivan Viola [KAUST], Tobias Isenberg [Inria Paris-Saclay, correspondant].
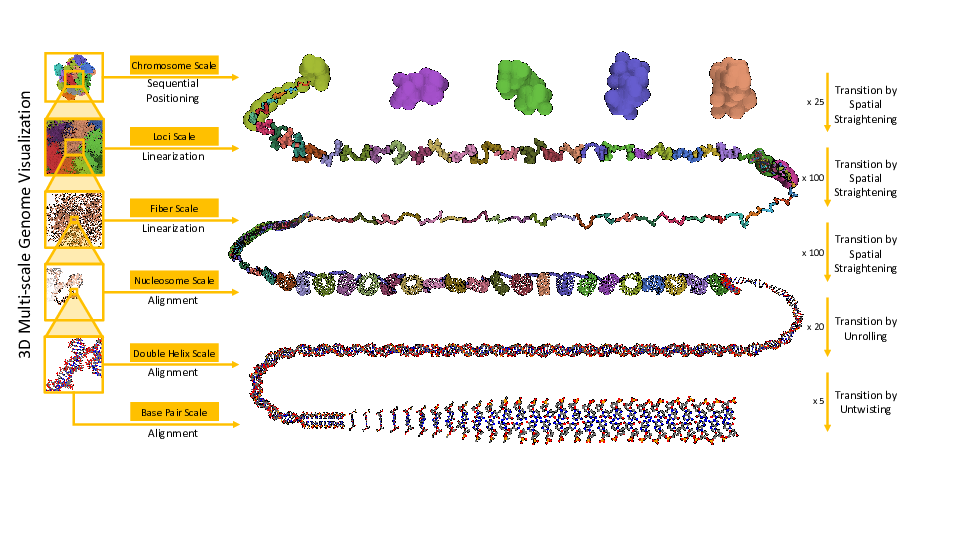
We present Multiscale Unfolding 1, an interactive technique for illustratively visualizing multiple hierarchical scales of DNA in a single view, showing the genome at different scales and demonstrating how one scale spatially folds into the next. The DNA's extremely long sequential structure—arranged differently on several distinct scale levels—is often lost in traditional 3D depictions, mainly due to its multiple levels of dense spatial packing and the resulting occlusion. Furthermore, interactive exploration of this complex structure is cumbersome, requiring visibility management like cut-aways. In contrast to existing temporally controlled multiscale data exploration, we allow viewers to always see and interact with any of the involved scales. For this purpose we separate the depiction into constant-scale and scale transition zones. Constant-scale zones maintain a single-scale representation, while still linearly unfolding the DNA. Inspired by illustration, scale transition zones connect adjacent constant-scale zones via level unfolding, scaling, and transparency. We thus represent the spatial structure of the whole DNA macro-molecule, maintain its local organizational characteristics, linearize its higher-level organization, and use spatially controlled, understandable interpolation between neighboring scales. We also contribute interaction techniques that provide viewers with a coarse-to-fine control for navigating within our all-scales-in-one-view representations and visual aids to illustrate the size differences. Overall, Multiscale Unfolding allows viewers to grasp the DNA's structural composition from chromosomes to the atoms, with increasing levels of “unfoldedness,” and can be applied in data-driven illustration and communication.
8.4 Survey of collaborative work in augmented reality
Participants: Mickaël Sereno [Inria Paris-Saclay], Xiyao Wang [Inria Paris-Saclay], Lonni Besançon [Linköpping University], Michael J. McGuffin [École de technologie supérieure], Tobias Isenberg [Inria Paris-Saclay, correspondant].
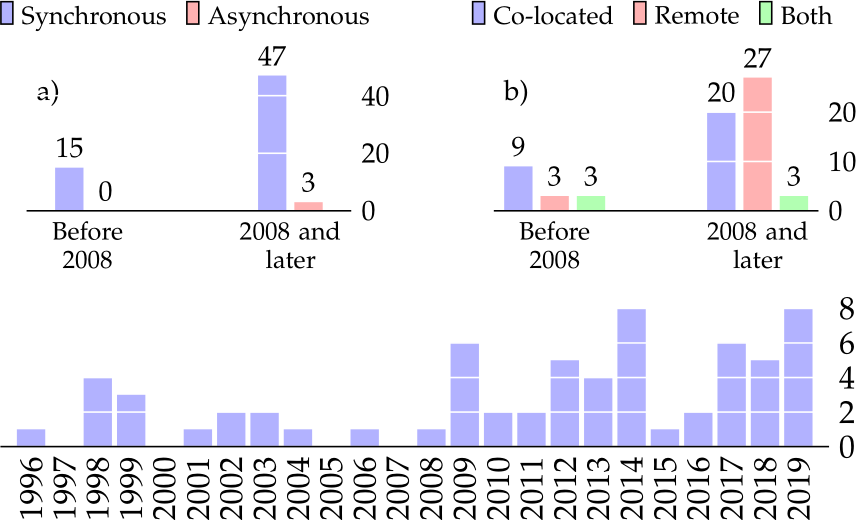
In Augmented Reality (AR), users perceive virtual content anchored in the real world. It is used in medicine, education, games, navigation, maintenance, product design, and visualization, in both single-user and multi-user scenarios. Multi-user AR has received limited attention from researchers, even though AR has been in development for more than two decades. We present the state of existing work at the intersection of AR and Computer-Supported Collaborative Work (AR-CSCW) 5, by combining a systematic survey approach with an exploratory, opportunistic literature search. We categorize 65 papers along the dimensions of space, time, role symmetry (whether the roles of users are symmetric), technology symmetry (whether the hardware platforms of users are symmetric), and output and input modalities. We derive design considerations for collaborative AR environments, and identify under-explored research topics. These include the use of heterogeneous hardware considerations and 3D data exploration research areas. This survey is useful for newcomers to the field, readers interested in an overview of CSCW in AR applications, and domain experts seeking up-to-date information.
8.5 Visualization for monitoring and exploration of the Bitcoin blockchain
Participants: Natkamon Tovanich [SystemX, correspondant], Nicolas Heulot [SystemX], Jean-Daniel Fekete [Inria], Nicolas Soulié [Université Paris-Saclay, Univ Evry, Institut Mines-Télécom Business School, LITEM].
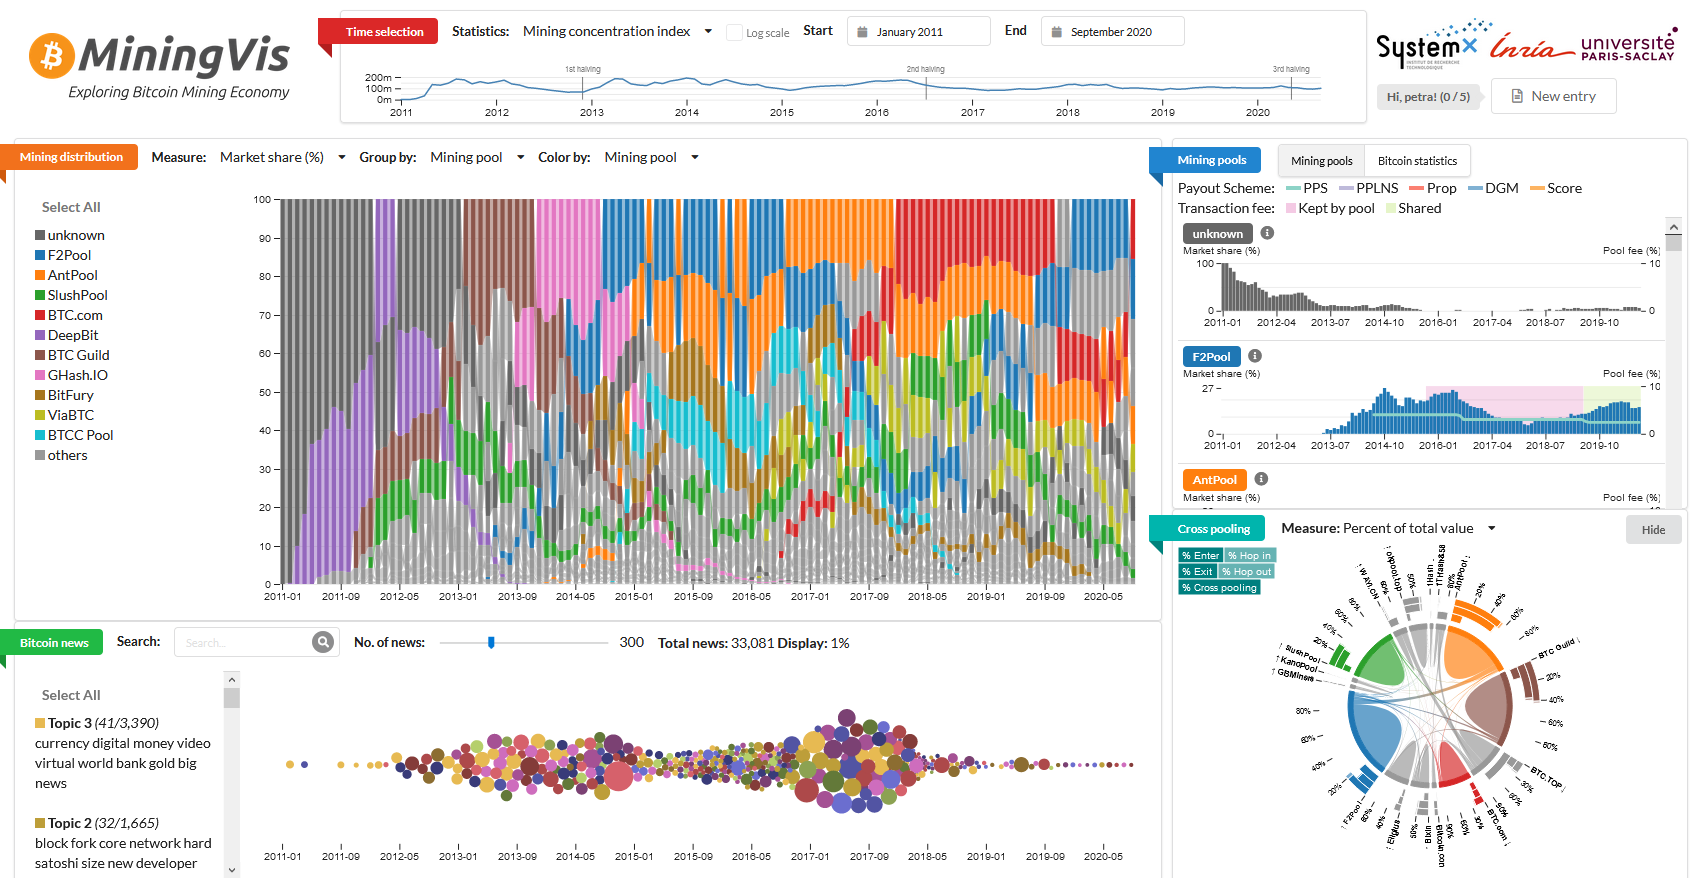
In the last year we actively worked on visual analytics tools to support the analysis of the Bitcoin blockchain. We focused on Bitcoin mining. Mining blocks is a critical component of the Bitcoin ecosystem, helping to keep the system secure, valid, and stable. At the same time, mining is a resource-intensive activity that continues to get more and more difficult. Mining pools have emerged to address this issue and to ensure a more stable and predictable income by sharing computing power. Yet, increased centralization of the mining power is also not without dangers (e.g., the 51% attack), and, thus, it is important to better understand and analyze mining pool activities in Bitcoin. We made several contributions: an extensive data collection on Bitcoin mining pools, the development of two custom visualizations and a comprehensive tool called MiningVis 27, a first exploratory data analysis leading to hypotheses and documented activities about pools’ main features such as market share, reward rules, or location 37. One extended analysis paper received a best paper runner up award at IEEE ICBC 35. Finally, our system BitConduite 17 was published in IEEE CG&A. It is a visual analytics approach for explorative analysis of financial activity within the Bitcoin network, offering a view on transactions aggregated by entities, i. e. by individuals, companies or other groups actively using Bitcoin.
8.6 Visualizations for promoting empathy and compassion
Participants: Luiz Morais [Inria], Yvonne Jansen [CNRS], Nazareno Andrade [Universidade Federal de Campina Grande], Pierre Dragicevic [correspondant].
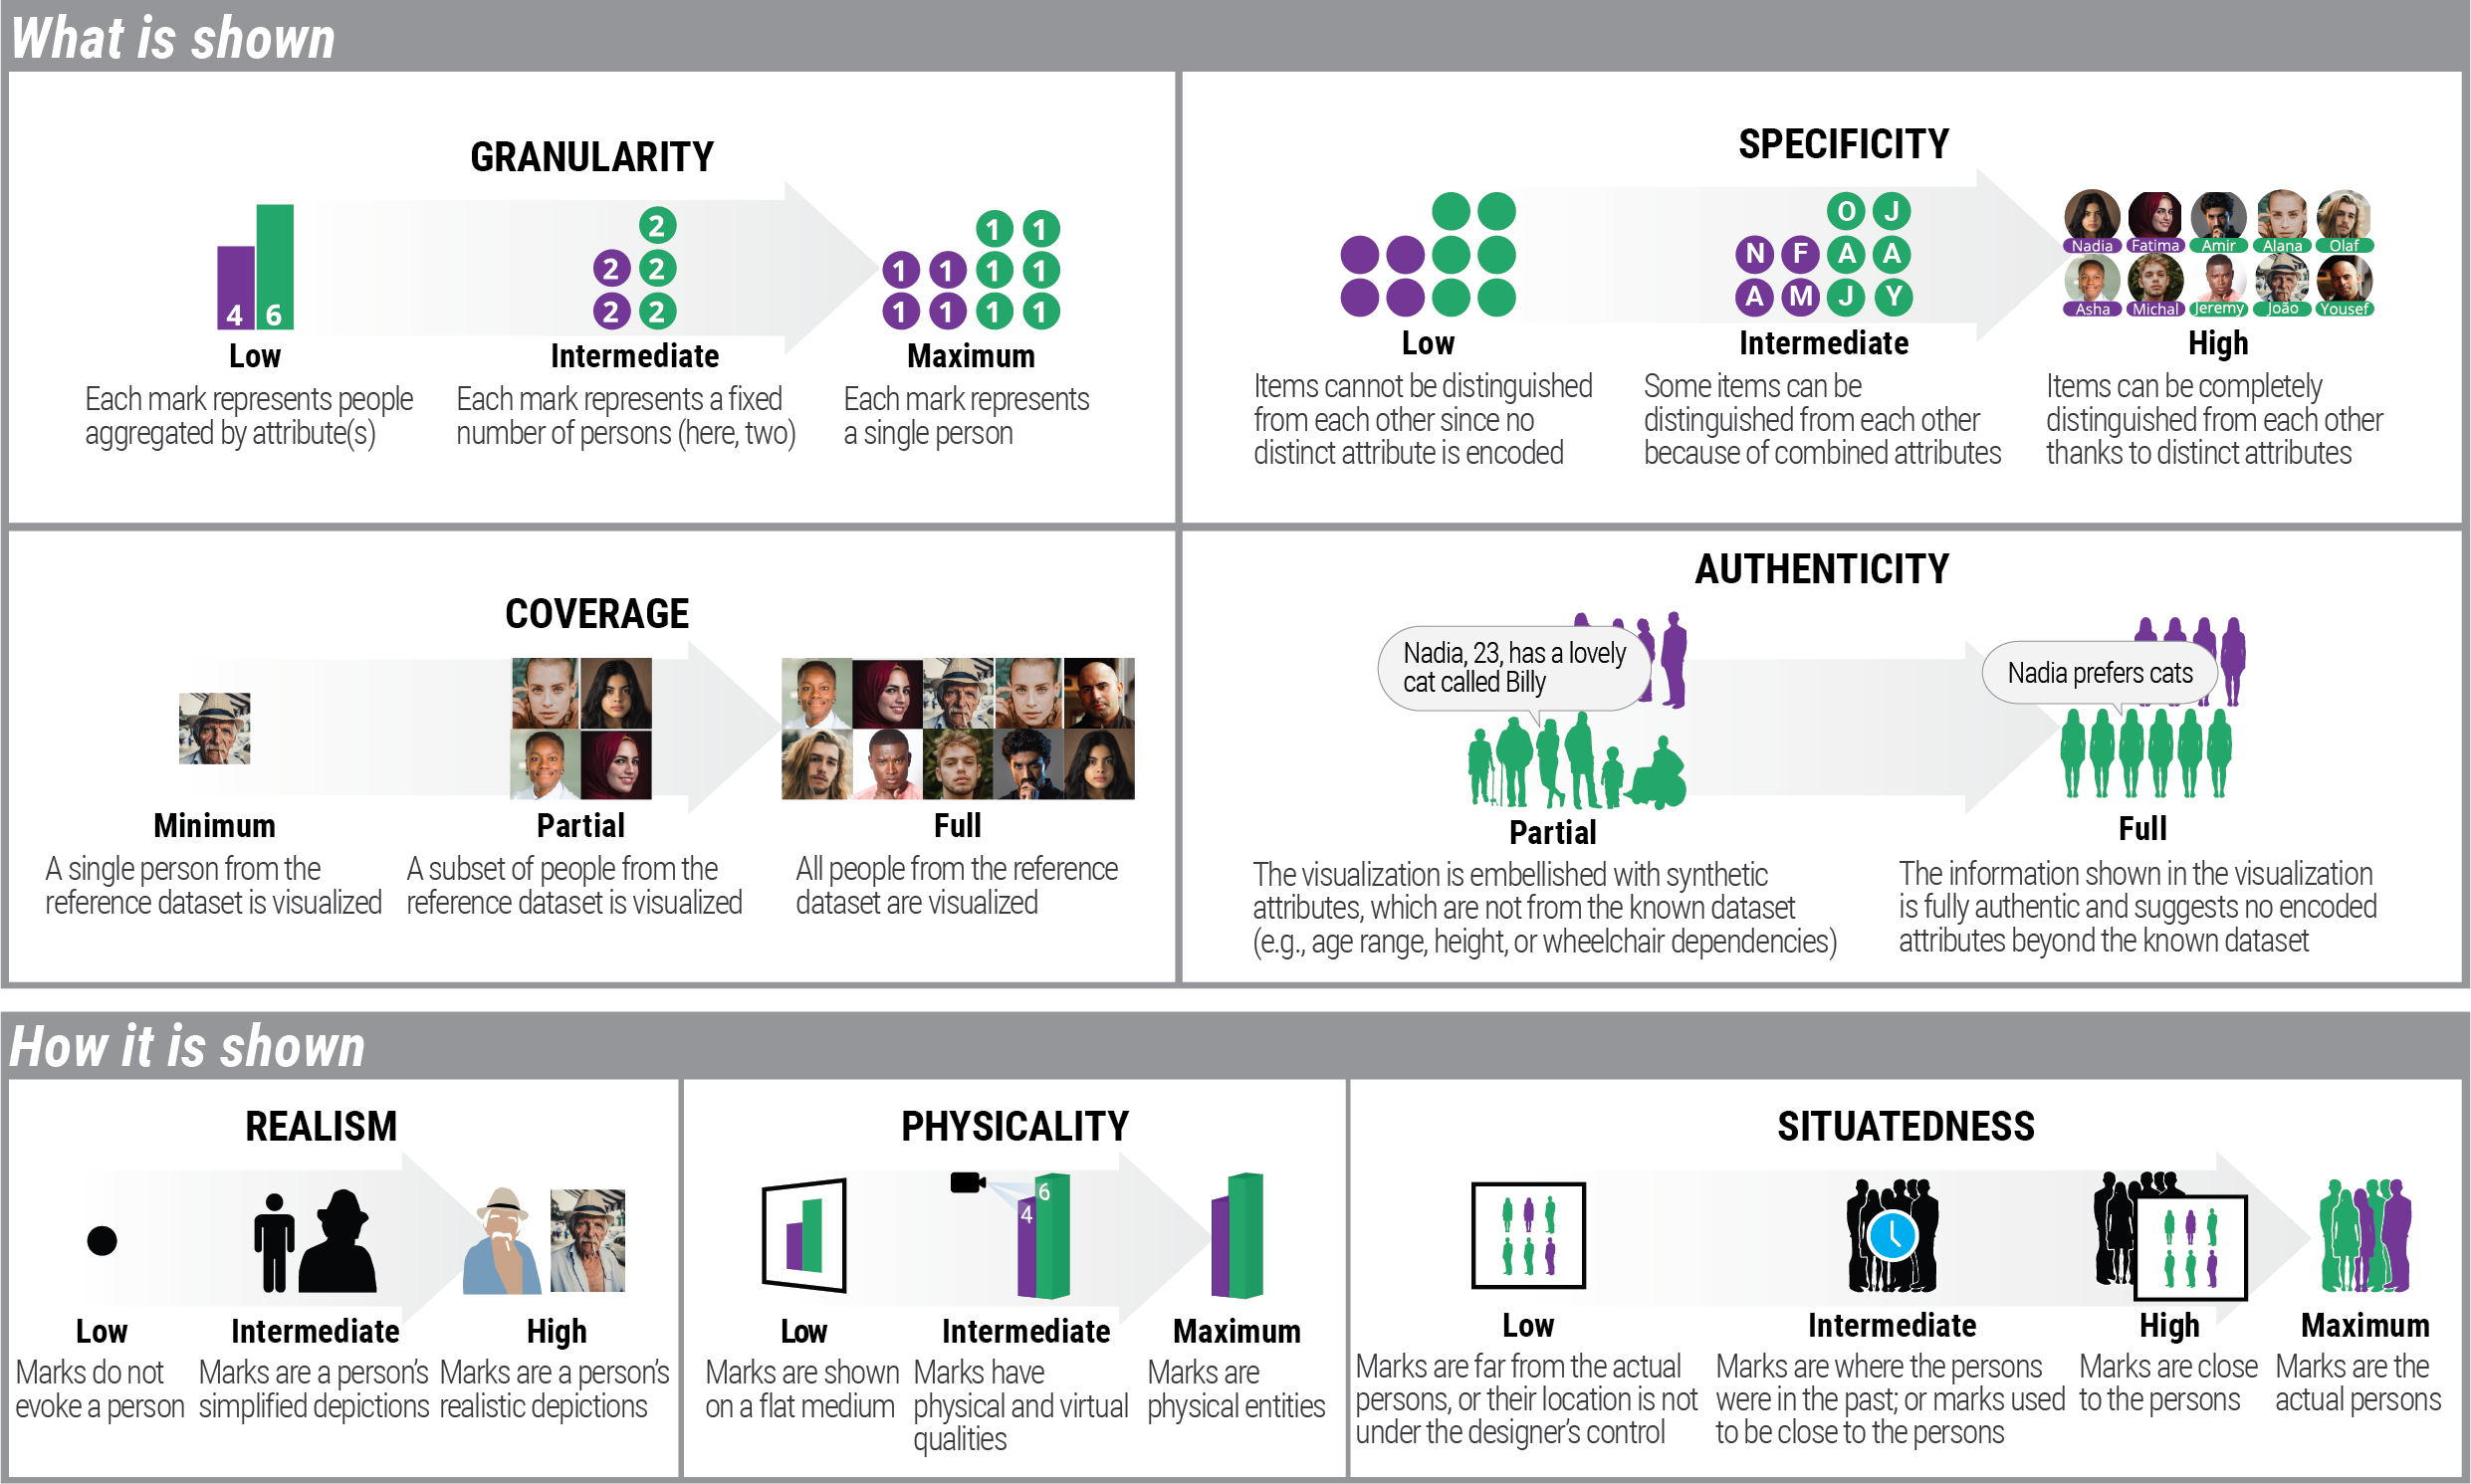
When showing data about people, visualization designers and data journalists often use design strategies that presumably help the audience relate to those people. The term “anthropographics” has been recently coined to refer to this practice and the resulting visualizations. Anthropographics is a rich and growing area, but the work so far has remained scattered. Despite preliminary empirical work and a few web essays written by practitioners, there is a lack of clear language for thinking about and communicating about anthropographics. In an article recently published at IEEE TVCG 126, we addressed this gap by introducing a conceptual framework and a design space for anthropographics. Our design space consists of seven elementary design dimensions that can be reasonably hypothesized to have some effect on prosocial feelings or behavior (Figure 8). It extends a previous design space and is informed by an analysis of 105 visualizations collected from newspapers, websites, and research papers. We used our conceptual framework and design space to discuss trade-offs, common design strategies, as well as future opportunities for design and research in the area of anthropographics. Our corpus of anthropographic visualizations can be explored at luizaugustomm.github.io/anthropographics/.
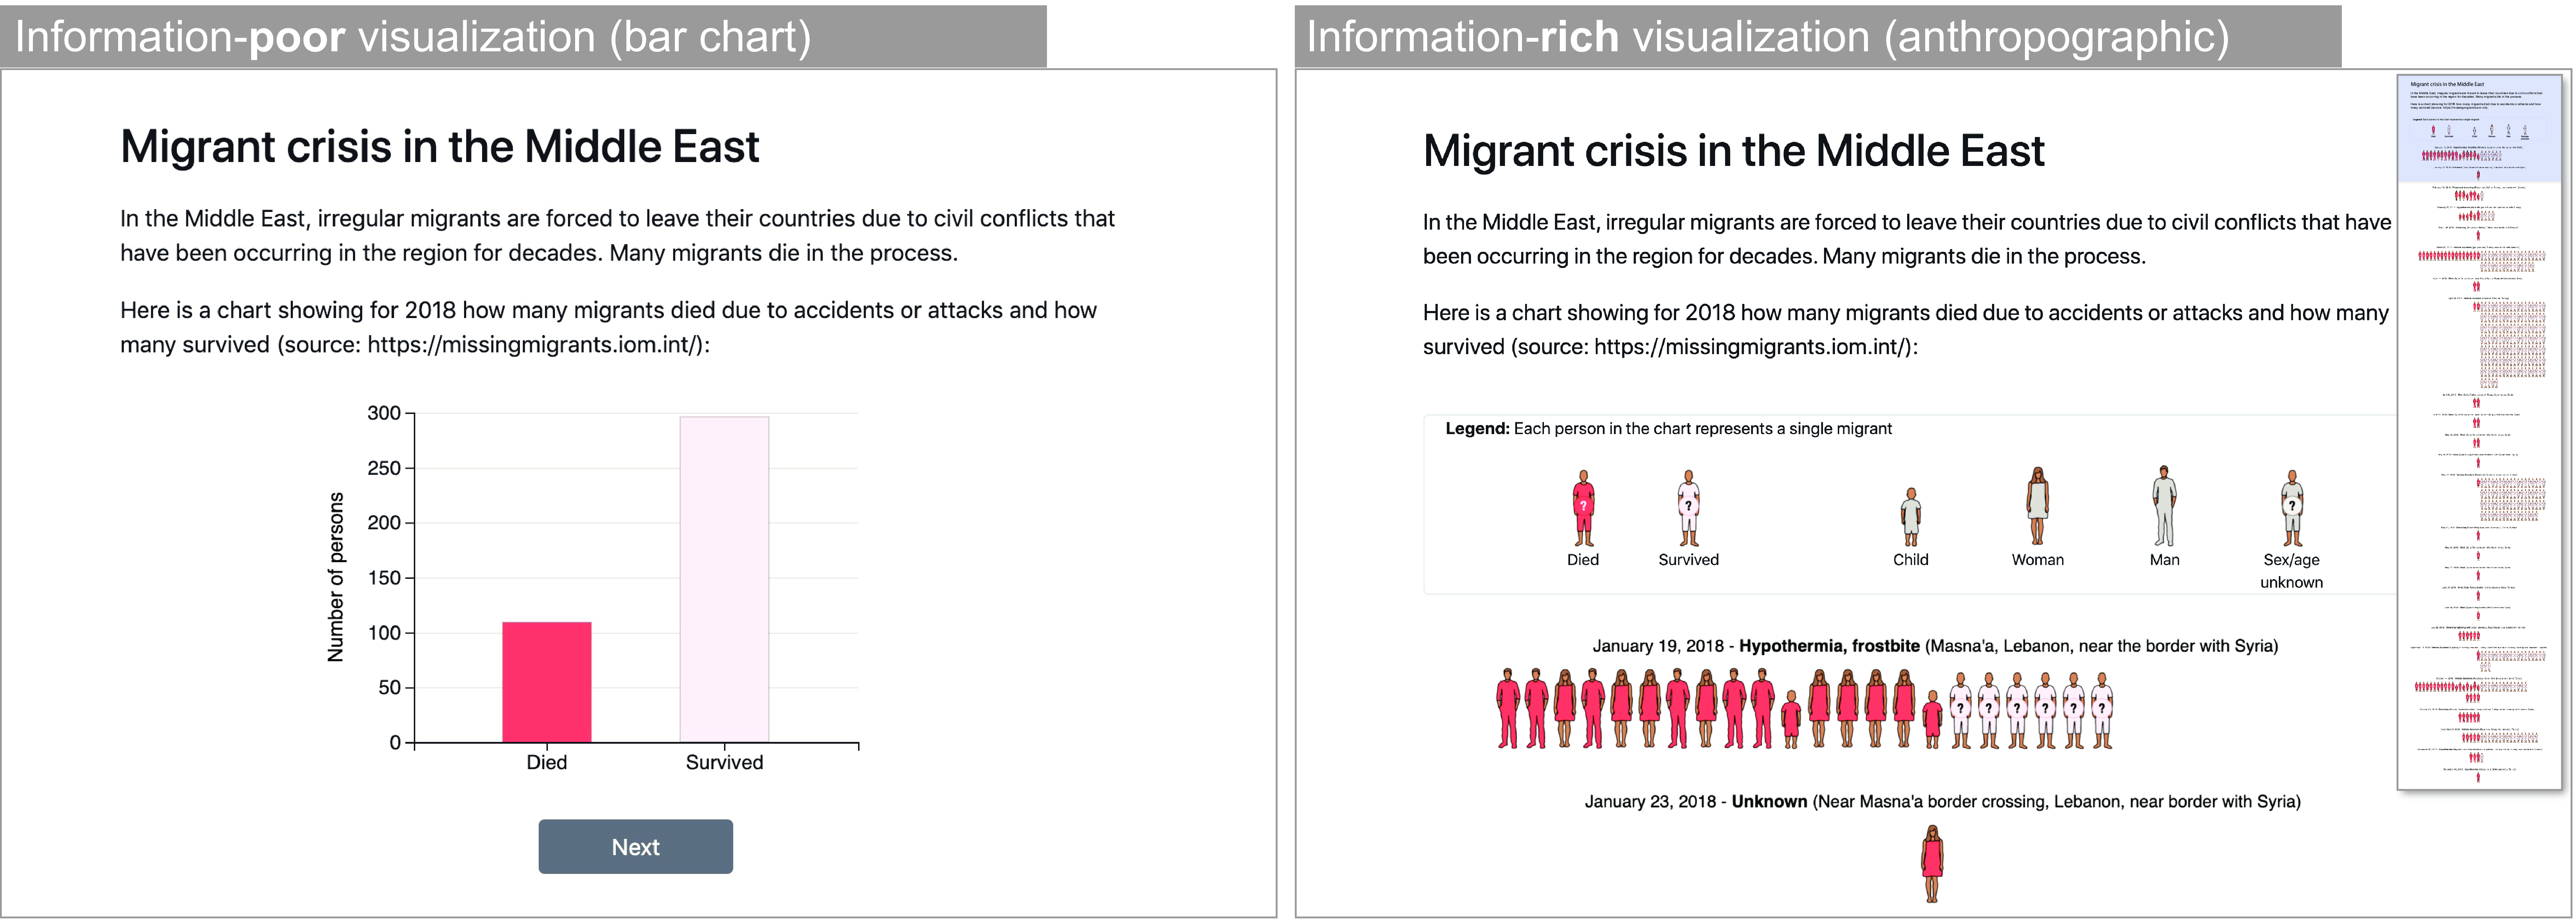
Empirical studies have recently examined whether anthropographics promote empathy, compassion, or the likelihood of prosocial behavior, but findings have been inconclusive so far. In an article recently published at ACM CHI 34, we contributed a detailed overview of past experiments, and two new experiments that use large samples and a combination of design strategies to maximize the possibility of finding an effect. We tested an information-rich anthropographic against a simple bar chart (Figure 9), asking participants to allocate hypothetical money in a crowdsourcing study. We found that the anthropographic had, at best, a small effect on money allocation. Such a small effect may be relevant for large-scale donation campaigns, but the large sample sizes required to observe an effect and the noise involved in measuring it make it very difficult to study in more depth. We discussed implications for our findings, such as the importance of testing alternative anthropographic design strategies as well as using alternative methodologies, such as real money donation tasks or observations in the field, for example, by testing alternative designs on the website of a real charity. Data and code are available at osf.io/xqae2.
8.7 Mobile Data Visualization
Participants: Petra Isenberg [Inria, correspondant], Alaul Islam [Inria, Paris-Saclay], Tanja Blascheck [University of Stuttgart], Anastasia Bezerianos [Paris-Saclay], Bongshin Lee [Microsoft Research], Eun Kyoung Choe [University of Maryland].
With an increasing use of mobile devices in everyday life, it is important to understand how to design data visualizations for small displays. A nuanced understanding is especially important since existing guidelines for visualization and data interaction design do not transfer well to mobile devices. Throughout the year several projects of the team contributed to an increased understanding of mobile data visualization design.
We co-edited a book on Mobile Data Visualization 39 and contributed to four chapters in the book. Specifically an introduction to the topic 46, a chapter on glanceable interactions for mobile visualization 41, an ideation methodology for novel representations for mobile devices 44, and a chapter on 3D mobile interaction 40.
We also published a replication study on our previous work in which we tested differences in visualization size 31.
MobileVisFixer 30 was a collaboration with the University of HongKong, Microsoft Research, and Monash University on how to automatically suggest problems and solutions with mobile friendly visualizations.
9 Partnerships and cooperations
9.1 International research visitors
9.1.1 Visits of international scientists
Inria International Chair
Participants: Jean-Daniel Fekete, Petra Isenberg, Pierre Dragicevic, Tobias Isenberg.
IIC PLAISANT Catherine
-
Name of the chair:
Catherine Plaisant
-
Institution of origin:
University of Maryland
-
Country:
USA
-
Dates:
From Mon Jan 01 2018 to Sat Dec 31 2022
-
Title:
Visual Analytics for Exploratory Data Analysis
Other international visits to the team
Sara Di Bartolomeo
Participants: Jean-Daniel Fekete, Alexis Pister.
-
Status
PhD
-
Institution of origin:
Northeastern University
-
Country:
USA
-
Dates:
From June 15 2021 to September 15 2021
-
Context of the visit:
Collaboration on dynamic hypergraph visualization
-
Mobility program/type of mobility:
internship
Ameya Patil
Participants: Jean-Daniel Fekete, Gaëlle Richer.
-
Status
PhD
-
Institution of origin:
University of Maryland
-
Country:
USA
-
Dates:
From June 15 2021 to September 15 2021
-
Context of the visit:
Collaboration on progressive visualization
-
Mobility program/type of mobility:
internship
Raimund Dachselt
Participants: Petra Isenberg, Alaul Islam.
-
Status
Professor
-
Institution of origin:
Technische Universität Dresden
-
Country:
Germany
-
Dates:
From October 11 - November 5. 2021
-
Context of the visit:
Collaboration on mobile data visualization and visualization aesthetics
-
Mobility program/type of mobility:
invited researcher
9.2 International Initiatives
-
Program:
ANR PRCI (ANR-18-CE92-0059-01)
-
Project acronym:
MicroVis
-
Project title:
Micro visualizations for pervasive and mobile data exploration
-
Duration:
Until 2/28/2023
-
Coordinator:
Petra Isenberg
-
Other partners:
University of Stuttgart, Germany
-
Abstract:
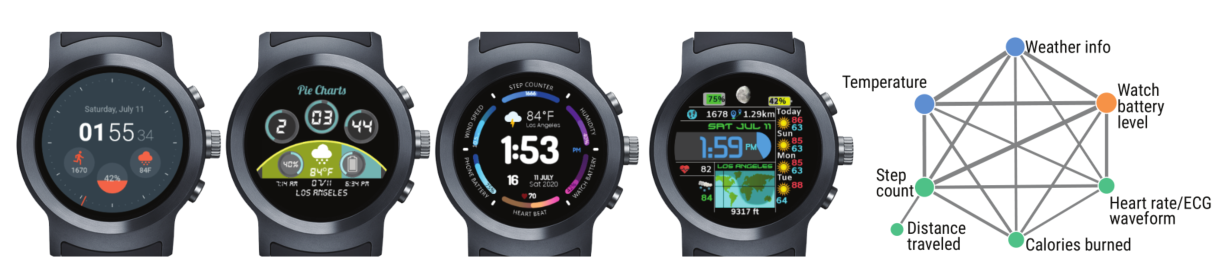
The goal of this joint Franco-German project is to study very small data visualizations, micro visualizations, in display contexts that can only dedicate minimal rendering space for data representations. We will study human perception of and interaction with micro visualizations given small as well as complex data. The increasing demand for data visualizations on small mobile devices such as fitness tracking armbands, smart watches, or mobile phones drives our research. Specifically, we define micro visualizations as small-scale visualizations that lack or have a limited set of reference structures such as labels, data axes, or grid lines and have a small physical footprint of a few square centimeters. Micro visualizations can be as simple as small unit-based visualizations such as a battery indicator but also include multi-dimensional visualizations such as star glyphs, small geographic visualizations or even small network visualizations. Although micro visualizations are essential to mobile visualization contexts, we know surprisingly little about their general visual and interaction design space or people’s ability in interpreting micro visualizations. We will address this gap by proposing a common framework, conducting empirical studies to understand people’s abilities to interpret these visualizations while in motion, and by developing a software toolkit to aid practitioners in developing micro visualizations for emerging mobile and wearable displays.
9.3 National initiatives
-
Program:
ANR PRC (ANR-19-CE33-0012)
-
Project acronym:
EMBER
-
Project title:
Situated Visualizations for Personal Analytics
-
Duration:
2020 – 2023. Total funding: 712 k€
-
Coordinator:
Pierre Dragicevic
-
Other partners:
Inria Bordeaux, Sorbonne Université
-
Abstract:
The Ember project will study how situated data visualization systems can help people use their personal data (e.g., fitness and physiological data, energy consumption, banking transactions, online social activity,…) for their own benefit. Although personal data is generated in many areas of daily life, it remains underused by individuals. Rarely is personal data subjected to an in-depth analysis and used to inform daily decisions. This research aims to empower individuals to improve their lives by helping them become advanced consumers of their own data. This research builds on the area of personal visual analytics, which focuses on giving the general public effective and accessible tools to get insights from their own data. Personal visual analytics is a nascent area of research, but has so far focused on scenarios where the data visualization is far removed from the source of the data it refers to. The goal of this project is to address the limitations of traditional platforms of personal data analytics by exploring the potential of situated data visualizations. In a situated data visualization, the data is directly visualized near the physical space, object, or person it refers to. Situated data visualizations have many potential benefits: they can surface information in the physical environment and allow viewers to interpret data in-context; they can be tailored to highlight spatial connections between data and the physical environment, making it easier to make decisions and act on the physical world in response to the insights gained; and they can embed data into physical environments so that it remains visible over time, making it easier to monitor changes, observe patterns over time and collaborate with other people. Website: ember.inria.fr/.
Other projects:
- DATAIA project HistorIA “Computational social sciences and information visualization join forces to explore and analyze large historical databases”. Duration: 36 months. Total funding: 240k€. Partners: Inria Saclay, Telecom Paris. Coordinators: Jean-Daniel Fekete, Christophe Prieur.
- Naviscope Inria Project Lab on Image-guided NAvigation and VIsualization of large data sets in live cell imaging and microSCOPy; collaboration with several Inria project teams and external collaborators; this grant supports a PhD position and funds travel and equipment.
10 Dissemination
10.1 Promoting scientific activities
10.1.1 Scientific events: organisation
General chair, scientific chair
- Tobias Isenberg: Eurographics workshop on Visual Computing for Biology and Medicine (VCBM 2021)
Member of the organizing committees
- Pierre Dragicevic: alt.chi co-chair at ACM CHI 2021.
10.1.2 Scientific events: selection
Chair of conference program committees
- Petra Isenberg: Paper Co-Chair for ACM Interactive Surfaces and Spaces (ISS)
Member of the conference program committees
- Pierre Dragicevic: IEEE VIS 2021
- Jean-Daniel Fekete: IEEE VIS 2021, EuroVis 2021, BigVis 2021
- Petra Isenberg: EuroVis Star Reports 2021, EuroVis Short Papers, IEEE VIS 2021
- Tobias Isenberg: IEEE VIS 2021, EuroVis 2021 short papers
10.1.3 Journal
Member of the editorial boards
- Pierre Dragicevic: Member of the editorial board of the Journal of Perceptual Imaging (JPI)
- Pierre Dragicevic: Member of the editorial board of the Springer Human–Computer Interaction Series (HCIS).
- Jean-Daniel Fekete: Associate Editor in Chief of IEEE Transactions of Visualization and Computer Graphics (TVCG)
- Petra Isenberg: Associate Editor for Transaction on Visualization and Computer Graphics (TVCG), Associate Editor in Chief at IEEE Computer Graphics & Applications (CG&A)
- Tobias Isenberg: Associate Editor for Elsevier Computers & Graphics
10.1.4 Invited talks
- Jean-Daniel Fekete: Panel at 5eme journée Interaction Humain-Machine et Intelligence Artificielle: “Analyser, comprendre le monde : Complémentarité entre apprentissage et visualisation” with Michèle Sebag, Mar. 11, 2021
- Petra Isenberg: Keynote at VIZBI 2021 (virtual): “Interactive visual analytics & storytelling”, March 2021
- Steve Haroz:
- Invited talk at European Conference on Visual Perception (virtual): “The Salience Bias in Ensemble Coding”, August 2021
- Panel at IEEE VIS (virtual): “Compensate subjects well. Compensate participants optionally.”, October 2021
10.1.5 Leadership within the scientific community
- Jean-Daniel Fekete: Member of the Scientific Committee of the French journal “humanités numériques”
- Jean-Daniel Fekete: Chair of the EuroVis Best PhD Award
- Jean-Daniel Fekete: Committee member of the Prix de Thèse Gilles Kahn (French best CS PhD dissertation award)
- Petra Isenberg: Vice-Chair of the IEEE VIS Steering Committee
- Tobias Isenberg: Steering Committee for ACM/EG Expressive; Steering Committee for BELIV workshop series
10.1.6 Research administration
- Pierre Dragicevic: member of the CCSU (Commission Consultative de Spécialistes de l’Université Paris-Saclay)
- Pierre Dragicevic: member of the Conseil de Labo LISN
- Pierre Dragicevic: co-chair of the IID axis of the Labex Digicosme
- Pierre Dragicevic: member of the CER (Comité d’Éthique de la Recherche) Paris-Saclay
- Petra Isenberg: Member of the Commission de Developpement Technologique (Inria)
- Petra Isenberg: Commission formation de la GS ISN (Paris-Saclay)
- Frédéric Vernier : Conseil d'Administration de l'Université Paris-Saclay (membre du bureau du CA)
- Frédéric Vernier : Commission Electorale de l'Université Paris-Saclay
- Frédéric Vernier : Commission des Carrières des Enseignants-Chercheur (CCEC= equiv. Conseil ACadémique en formation restreinte) de l'Université Paris-Saclay
- Frédéric Vernier : Membre élu du conseil du departemewnt d'informatique de l'Université Paris-Saclay
10.2 Teaching - Supervision - Juries
10.2.1 Teaching
- Master: Petra Isenberg, “Interactive Information Visualization”, 36.5h equivalent TD (total, co-taught with Anastasia Bezerianos), M1/M2, Université Paris-Saclay.
- Master: Petra Isenberg, “Visual Analytics”, 60h equivalent TD (co-taught with Natkamon Tovanich), M2, Centrale Supelec.
- Licence: Tobias Isenberg, “Introduction to Computer Graphics”, 18h en équivalent TD, L3, Polytech Paris-Saclay, France.
- Master: Tobias Isenberg, “Photorealistic Rendering/Advanced Computer Graphics”, 28h en équivalent TD, M2, Polytech Paris-Saclay, France.
- Master: Tobias Isenberg, “Illustrative Visualization”, 6h en équivalent TD, M2, ENSTA, France.
- Master: Frederic Vernier, class and lab class. “Information visualization”, 24h en équivalent TD, M2 ISC, Faculté des sciences d'Orsay. Univ. Paris-Saclay, France.
- Licence: Mickaël Sereno, tutorial sessions for “Introduction to Computer Graphics”, 24h en équivalent TD, ET3 (eq. L3), Polytech Paris-Saclay, France.
- Licence: Mickaël Sereno, tutorial sessions for “Introduction à l'Informatique ”, 37h en équivalent TD, Peip1 (eq. L1), Polytech Paris-Saclay, France.
- Licence: Frederic Vernier, class and lab class. “Introduction to Computer Graphics”, 42h en équivalent TD, L1-MI, Faculté des sciences d'Orsay. Univ. Paris-Saclay, France.
- Licence: Frederic Vernier, class and lab class. “Advanced Computer Graphics”, 36h en équivalent TD, L2-MI, Faculté des sciences d'Orsay. Univ. Paris-Saclay, France.
- Licence: Frederic Vernier, class and lab class. “Web development”, 42h en équivalent TD, L3 computer sciences, Faculté des sciences d'Orsay. Univ. Paris-Saclay, France.
- Master: Lijie Yao, “Interactive Information Visualization”, 7h equivalent TD (total 36.5h, co-taught with Petra Isenberg and Anastasia Bezerianos), M1/M2, Université Paris-Saclay
- Licence: Alexis Pister, “Algorithmique”, 16h equivalent TD, L2, Polytech Paris-Saclay, France.
- Licence: Alexis Pister, “Remise à niveau en informatique”, 20h equivalent TD, L3, Polytech Paris-Saclay, France.
- Licence: Alexis Pister, “Algorithmique des graphes”,12h equivalent TD, L3, Polytech Paris-Saclay, France.
- Licence: Alexis Pister, “Base de données”, 12h equivalent TD, L3, Polytech Paris-Saclay, France.
10.2.2 Supervision
- PhD in progress: Tingying He, A Design Space for Visual Data Mapping for Low-Color Displays, Univ. Paris-Saclay, defense planned for December 2024, Tobias Isenberg
- PhD in progress: Jiayi Hong, Interactive Visualization and Classification of Temporal Developments in 3D Datasets, Univ. Paris-Saclay, defense planned for December 2022, Tobias Isenberg
- PhD in progress: Alaul Islam, Micro Visualizations for Fitness Trackers, Petra Isenberg
- PhD in progress: Alexis Pister, Exploration, Analysis, Interpretability of Large Historical Networks, Univ. Paris-Saclay, (co-supervision with Christophe Prieur), defense planned for December 2022, Jean-Daniel Fekete
- PhD in progress: Lijie Yao, Situated Visualization in Motion, Univ. Paris-Saclay, defense planned for December 2023, Petra Isenberg, Anastasia Bezerianos
- PhD in progress: Natkamon Tovanich, Visualization and Visual Analytics of Blockchain, Petra Isenberg and Jean-Daniel Fekete, defense planned for February 2022
- PhD completed: Mickaël Sereno, Collaborative Data Exploration and Discussion Supported by AR, Univ. Paris-Saclay, defended successfully on December 14, 2021, Tobias Isenberg.
- MSc thesis completed: Tingying He, A Design Space for Watchface Micro Visualizations, Petra Isenberg
- MSc thesis completed: Nathan van Hille, Visualization of dynamic compounds involved in the life process of cells with the HoloLens, Tobias Isenberg
10.2.3 Juries
- Jean-Daniel Fekete: member of the PhD committee of Benoît Colange, "Energy Systems Diagnosis through Intelligent Analysis of High Dimensional Data Structures", Université Savoie Mont Blanc, May, 2021
- Jean-Daniel Fekete: review of the HdR of Céline Coutrix, "Physically Flexible Control for Human-Computer Interaction", Université Grenoble Alpes, Feb. 24, 2021
- Pierre Dragicevic: member of the mid-term PhD committee of Martin Tricaud, UP-Saclay.
10.3 Popularization
10.3.1 Articles and contents
- Pierre Dragicevic and Yvonne Jansen: the data physicalization wiki (dataphys.org/) and the List of Physical Visualizations and Related Artefacts (dataphys.org/list/, 600 weekly visits) are continuously being updated.
10.3.2 Education
- Steve Haroz: A Succinct Intro to R (r-guide.steveharoz.com) used in multiple courses on data science and statistics. Over 10k visits in 4 months.
10.3.3 Interventions
- Jean-Daniel Fekete: Keynote at Datarama #6: “Visualisation des données de la recherche”, Nantes, Sep. 17, 2021
- Alexis Pister: Talk at Junior Conference on Data Science And Engineering (JDSE): “PK-Clustering: Integrating Prior Knowledge in Mixed-Initiative Social Network Clustering”, Online, Feb. 02, 2021
- Alexis Pister: Software demo at Historical Networks Conference: “PK-Clustering: Integrating Prior Knowledge in Mixed-Initiative Social Network Clustering”, Online, Jul. 02, 2021
11 Scientific production
11.1 Major publications
- 1 articleMultiscale Unfolding: Illustratively Visualizing the Whole Genome at a Glance.IEEE Transactions on Visualization and Computer Graphics2022
- 2 bookMobile Data Visualization.0Chapman and Hall/CRCDecember 2021, 346
- 3 articleCurve Complexity Heuristic KD-trees for Neighborhood-based Exploration of 3D Curves.Computer Graphics Forum402May 2021, 461–474
- 4 articleIntegrating Prior Knowledge in Mixed Initiative Social Network Clustering.IEEE Transactions on Visualization and Computer Graphics272February 2021, 1775 - 1785
- 5 articleCollaborative Work in Augmented Reality: A Survey.IEEE Transactions on Visualization and Computer Graphics2022
- 6 articleMiningVis: Visual Analytics of the Bitcoin Mining Economy.IEEE Transactions on Visualization and Computer Graphics281January 2022, 868-878
- 7 articlePerception! Immersion! Empowerment! Superpowers as Inspiration for Visualization.IEEE Transactions on Visualization and Computer Graphics281January 2022, 22-32
11.2 Publications of the year
International journals
International peer-reviewed conferences
Conferences without proceedings
Scientific books
Scientific book chapters
Reports & preprints
Other scientific publications
11.3 Cited publications
- 54 inproceedingsKnowing when You'Re Wrong: Building Fast and Reliable Approximate Query Processing Systems.Proceedings of the 2014 ACM SIGMOD International Conference on Management of DataSIGMOD '14New York, NY, USASnowbird, Utah, USAACM2014, 481--492URL: http://doi.acm.org/10.1145/2588555.2593667
- 55 articleSeeing Sets: Representation by Statistical Properties.Psychological Science1222001, 157--162URL: http://www.jstor.org/stable/40063604
-
56
inproceedingsIllustrative Data Graphics in 18
–19 Century Style: A Case Study.Posters at the IEEE Conference on Visualization (IEEE VIS, October 13--18, Atlanta, GA, USA)2013 - 57 articleSteering the Craft: UI Elements and Visualizations for Supporting Progressive Visual Analytics.Computer Graphics Forum363June 2017, 491--502
- 58 inproceedingsEvaluating Visual Data Analysis Systems: A Discussion Report.HILDA'18: Workshop on Human-In-the-Loop Data AnalyticsHouston, TX, United StatesJune 2018
- 59 inproceedingsPressure-Based Gain Factor Control for Mobile 3D Interaction using Locally-Coupled Devices.CHI 2017 - ACM CHI Conference on Human Factors in Computing SystemsNew YorkACM2017, 1831--1842
- 60 inproceedingsThe Continued Prevalence of Dichotomous Inferences at CHI.CHI '19 Extended Abstracts on Human Factors in Computing SystemsGlasgow, United KingdomMay 2019
- 61 articleHybrid Tactile/Tangible Interaction for 3D Data Exploration.IEEE Transactions on Visualization and Computer Graphics231January 2017, 881--890
- 62 inproceedingsInteractive 3D Data Exploration Using Hybrid Tactile/Tangible Input.Journées Visu 2017Rueil-Malmaison, France2017
- 63 inproceedingsMouse, Tactile, and Tangible Input for 3D Manipulation.Proceedings of the ACM Conference on Human Factors in Computing Systems (CHI)New YorkACM2017, 4727--4740
- 64 techreportUsability Comparison of Mouse, Touch and Tangible Inputs for 3D Data Manipulation.https://arxiv.org/abs/1603.08735v2InriaApril 2016
- 65 articleReducing Affective Responses to Surgical Images and Videos Through Stylization.Computer Graphics Forum391January 2020, 462--483
- 66 inproceedingsReducing Affective Responses to Surgical Images through Color Manipulation and Stylization.Proceedings of the Joint Symposium on Computational Aesthetics, Sketch-Based Interfaces and Modeling, and Non-Photorealistic Animation and RenderingNew YorkACM2018, 4:1--4:13
- 67 articleSTATISTICAL COGNITION: TOWARDS EVIDENCE-BASE PRACTICE IN STATISTICS AND STATISTICS EDUCATION..Statistics Education Research Journal722008
- 68 articleGeneaQuilts: A System for Exploring Large Genealogies.IEEE Transactions on Visualization and Computer Graphics166October 2010, 1073-1081
- 69 articlePerception of Visual Variables on Tiled Wall-Sized Displays for Information Visualization Applications.IEEE Transactions on Visualization and Computer Graphics18122012, 2516-2525
- 70 miscVisualiser un milliard (et au-delà) d'évènements en Python~: de l'idée au prototype interactif.March 2018, URL: https://gricad.univ-grenoble-alpes.fr/video/visualisez-milliard-et-au-dela-d-evenements-en-python-l-idee-au-prototype-interactif
- 71 inproceedingsShowing people behind data: Does anthropomorphizing visualizations elicit more empathy for human rights data?Proceedings of the 2017 CHI Conference on Human Factors in Computing SystemsACM2017, 5462--5474
- 72 incollectionInteraction for Immersive Analytics.Immersive AnalyticsBerlin /HeidelbergSpringer2018, 495--138
- 73 bookS. K.Stuart K. CardJ. D.Jock D. MackinlayB.Ben ShneidermanReadings in information visualization: using vision to think.San Francisco, CA, USAMorgan Kaufmann Publishers Inc.1999
- 74 articleThreats of a replication crisis in empirical computer science.Communications of the ACM638August 2020, 70--79
- 75 articleConceptual and Methodological Issues in Evaluating Multidimensional Visualizations for Decision Support.IEEE Transactions on Visualization and Computer Graphics242018
- 76 articleThe Attraction Effect in Information Visualization.IEEE Transactions on Visualization and Computer Graphics2312017
- 77 phdthesisInformation Visualization for Decision Making: Identifying Biases and Moving Beyond the Visual Analysis Paradigm.Paris Saclay2017
-
78
inproceedingsVisual Showcase: An Illustrative Data Graphic in an 18
–19 Century Style.Visual Showcase at the Joint ACM/EG Symposium on Computational Aesthetics, Sketch-Based Interfaces and Modeling, and Non-Photorealistic Animation and Rendering (Expressive, July 19--20, Anaheim, CA, USA)2013, URL: https://tobias.isenberg.cc/VideosAndDemos/Bach2013IDG - 79 incollectionFair statistical communication in HCI.Modern Statistical Methods for HCISpringer2016, 291--330
- 80 techreportHCI Statistics without p-values.RR-8738InriaJune 2015, 32
- 81 articleBlinded with Science or Informed by Charts? A Replication Study.IEEE Transactions on Visualization and Computer Graphics241January 2018, 781-790
- 82 inproceedingsIncreasing the Transparency of Research Papers with Explorable Multiverse Analyses.CHI 2019 - The ACM CHI Conference on Human Factors in Computing SystemsGlasgow, United KingdomMay 2019
- 83 inproceedingsIllustrative Data Graphic Style Elements.Posters at the Joint ACM/EG Symposium on Computational Aesthetics, Sketch-Based Interfaces and Modeling, and Non-Photorealistic Animation and Rendering (Expressive, July 19--20, Anaheim, CA, USA)2013, URL: https://tobias.isenberg.cc/VideosAndDemos/Bach2013IDG
- 84 incollectionImmersive Analytics: An Introduction.Immersive AnalyticsBerlin /HeidelbergSpringer2018, 11--23
- 85 articleProgressive Data Analysis and Visualization (Dagstuhl Seminar 18411).Dagstuhl Reports8102018, 1--32URL: https://doi.org/10.4231/DagRep.8.1.1
- 86 unpublishedProgressive Analytics: A Computation Paradigm for Exploratory Data Analysis.July 2016, https://arxiv.org/abs/1607.05162 - working paper or preprint
- 87 bookData stream management: processing high-speed data streams.Springer2016
- 88 bookHandbook of sequential analysis.CRC Press1991
- 89 articleRig animation with a tangible and modular input device.ACM Transactions on Graphics (TOG)3542016, 144
- 90 articleHow capacity limits of attention influence information visualization effectiveness.IEEE Transactions on Visualization and Computer Graphics18122012, 2402--2410
- 91 articlePersonal Visualization and Personal Visual Analytics.IEEE TVCG2132015, 420--433
- 92 articleThe Spatial Resolution of Visual Attention.Cognitive Psychology4332001, 171---216URL: http://www.sciencedirect.com/science/article/pii/S0010028501907558
- 93 articleHybrid-image visualization for large viewing environments.IEEE TVCG19122013, 2346--2355
- 94 articleCollaborative Visual Analytics Around a Tabletop Display.IEEE TVCG185May 2012, 689--702
- 95 incollectionInteractive Exploration of Three-Dimensional Scientific Visualizations on Large Display Surfaces.Collaboration Meets Interactive SpacesBerlin, HeidelbergSpringer2016
- 96 articleData Visualization on Interactive Surfaces: A Research Agenda.IEEE CG & A332mar # / 2013
- 97 articleVisualization on Interactive Surfaces: A Research Overview.i-com123November 2013, 10--17
- 98 inproceedingsPreference Between Allocentric and Egocentric 3D Manipulation in a Locally Coupled Configuration.ACM Symposium on Spatial User InteractionNew YorkACM2016, 79--88
- 99 inproceedingsA Tangible Volume for Portable 3D Interaction.2016 IEEE International Symposium on Mixed and Augmented RealityLos AlamitosIEEE Computer Society2016, 215--220
- 100 articleAnalysis of Locally Coupled 3D Manipulation Mappings Based on Mobile Device Motion.MIT Presence261October 2017, 66-95
- 101 articleAn Interaction Model for Visualizations Beyond The Desktop.IEEE Transactions on Visualization and Computer Graphics1912November 2013, 2396 - 2405
- 102 inproceedingsEvaluating the efficiency of physical visualizations.Proc. CHIACM2013, 2593--2602
- 103 inproceedingsTangible Remote Controllers for Wall-Size Displays.ACM annual conference on Human Factors in Computing Systems. CHI '12ACMAustin, TX, United StatesMay 2012, 2865-2874
- 104 inproceedingsOpportunities and Challenges for Data Physicalization.Proceedings of the ACM Conference on Human Factors in Computing Systems (CHI)ACMNew York, NY, United StatesApril 2015
- 105 miscWhat Did Authors Value in the CHI'16 Reviews They Received?May 2016, 596 - 608
- 106 phdthesisPhysical and Tangible Information Visualization.Université Paris Sud-Paris XI2014
- 107 articlePANENE: A Progressive Algorithm for Indexing and Querying Approximate k-Nearest Neighbors.IEEE Transactions on Visualization and Computer Graphics262February 2020, 1347-1360
- 108 articleA Declarative Rendering Model for Multiclass Density Maps.IEEE Transactions on Visualization and Computer Graphics251January 2019, 470-480
- 109 miscSciPy: Open source scientific tools for Python.[Online; accessed <today>]2001, URL: http://www.scipy.org/
- 110 bookThinking, Fast and Slow.Farrar, Straus and Giroux2011
- 111 miscSpecial Interest Group on Transparent Statistics in HCI.May 2016, 1081--1084
- 112 miscMoving Transparent Statistics Forward at CHI.WorkshopMay 2017, 534-541
- 113 inproceedingsStackables: combining tangibles for faceted browsing.Proceedings of the International Working Conference on Advanced Visual InterfacesACM2012, 241--248
- 114 inproceedingsSkipping the Replication Crisis in Visualization: Threats to Study Validity and How to Address Them.Evaluation and Beyond - Methodological Approaches for VisualizationBerlin, GermanyOctober 2018
- 115 articleBELIV 2014 Special Issue.Information Visualization154October 2016, 286-287
- 116 articleVIS Author Profiles: Interactive Descriptions of Publication Records Combining Text and Visualization.IEEE Transactions on Visualization and Computer Graphics251January 2019, 152-161
- 117 inproceedingsZooids: Building Blocks for Swarm User Interfaces.Proceedings of the 29th Annual Symposium on User Interface Software and Technology (UIST)Tokyo, JapanOctober 2016
- 118 articleDynamic Composite Data Physicalization Using Wheeled Micro-Robots.IEEE Transactions on Visualization and Computer Graphics2018
- 119 phdthesisSupporting Versatility in Tangible User Interfaces Using Collections of Small Actuated Objects.Université Paris-SaclayDecember 2016
- 120 articleBeyond Mouse and Keyboard: Expanding Design Considerations for Information Visualization Interactions.IEEE TVCG1812December 2012, 2689--2698
- 121 articleTowards an Understanding of Mobile Touch Navigation in a Stereoscopic Viewing Environment for 3D Data Exploration.IEEE Transactions on Visualization and Computer Graphics225May 2016, 1616-1629
- 122 articleDimSUM: Dimension and Scale Unifying Maps for Visual Abstraction of DNA Origami Structures.Computer Graphics Forum373June 2018, 403-413
- 123 articleMultiscale Visualization and Scale-Adaptive Modification of DNA Nanostructures.IEEE Transactions on Visualization and Computer Graphics241January 2018, 1014--1024
- 124 articleMultiscale Molecular Visualization.Journal of Molecular BiologyTo appear2019
- 125 inproceedingsResponse Time in Man-computer Conversational Transactions.Proc. of the Fall Joint Computer Conference, Part ISan Francisco, CaliforniaACM1968, 267--277URL: http://doi.acm.org/10.1145/1476589.1476628
- 126 articleShowing Data about People: A Design Space of Anthropographics.IEEE Transactions on Visualization and Computer Graphics2020
- 127 articleA `dipper' function for texture discrimination based on orientation variance.Journal of Vision81108 2008, 9-9URL: https://dx.doi.org/10.1167/8.11.9
- 128 articleRegistered Reports: A method to increase the credibility of published results.Social Psychology453may 2014, 137--141URL: https://doi.org/10.1027/1864-9335/a000192
- 129 articleMultiscale Visualization and Exploration of Large Bipartite Graphs.Computer Graphics Forum373June 2018, 12
- 130 proceedingsM.Michael SedlmairP.Petra IsenbergT.Tobias IsenbergN.Narges MahyarH.Heidi LamProceedings of the Sixth Workshop on ``Beyond Time and Errors: Novel Evaluation Methods for Visualization'' (BELIV 2016, October 24, Baltimore, Maryland, USA).New YorkACM2016
- 131 inproceedingsUnderstanding the Use of The Vistorian: Complementing Logs with Context Mini-Questionnaires.Visualization for the Digital HumanitiesPhoenix, United StatesOctober 2017
- 132 articleResponse Time and Display Rate in Human Performance with Computers.ACM Comput. Surv.163September 1984, 265--285URL: http://doi.acm.org/10.1145/2514.2517
- 133 bookInformation Visualization.Boston, MA, USAAddison-Wesley Publishing Company2000
- 134 inproceedingsSupporting the Design and Fabrication of Physical Visualizations.Proc. CHIToronto, Ontario, CanadaACM2014, 3845--3854
- 135 articlePerceiving group behavior: Sensitive ensemble coding mechanisms for biological motion of human crowds..Journal of Experimental Psychology: Human Perception and Performance3922013, 329
- 136 articleFour types of ensemble coding in data visualizations.Journal of Vision16503 2016, 11-11URL: https://dx.doi.org/10.1167/16.5.11
- 137 miscTableau Software.Last accessed Feb 20182018, URL: http://www.tableau.com
- 138 manualR: A Language and Environment for Statistical Computing.R Foundation for Statistical ComputingVienna, Austria2019, URL: https://www.R-project.org
- 139 articleProgressive Data Science: Potential and Challenges.CoRRabs/1812.080322018, URL: http://arxiv.org/abs/1812.08032
- 140 articleLife after NHST: How to describe your data without ``p-ing'' everywhere.Basic and Applied Social Psychology3752015, 260--273
- 141 articlePondering the Concept of Abstraction in (Illustrative) Visualization.IEEE Transactions on Visualization and Computer Graphics249September 2018, 2573--2588
- 142 inproceedingsSpecial Interest Group on Transparent Statistics Guidelines.CHI 2018 - Conference on Human Factors in Computing SystemsMontreal QC, FranceACM PressApril 2018, 1-4
- 143 bookInformation Visualization -- Perception for Design.Morgan Kaufmann Series in Interactive TechnologiesSan Francisco, CA, USAMorgan Kaufmann Publishers2000
- 144 articleDegrees of Freedom in Planning, Running, Analyzing, and Reporting Psychological Studies: A Checklist to Avoid p-Hacking.Frontiers in Psychology72016, 1832URL: https://www.frontiersin.org/article/10.3389/fpsyg.2016.01832
- 145 articleEmbedded Data Representations.IEEE Transactions on Visualization and Computer Graphics2017, 461 - 470
- 146 articleIllustrative Molecular Visualization with Continuous Abstraction.Computer Graphics Forum303May 2011, 683--690URL: https://tobias.isenberg.cc/VideosAndDemos/Zwan2011IMV