
Keywords
Computer Science and Digital Science
- A5.1.1. Engineering of interactive systems
- A5.1.2. Evaluation of interactive systems
- A5.1.9. User and perceptual studies
- A5.3. Image processing and analysis
- A5.4. Computer vision
- A5.5.4. Animation
- A5.6. Virtual reality, augmented reality
- A5.6.1. Virtual reality
- A5.8. Natural language processing
- A6.1.1. Continuous Modeling (PDE, ODE)
- A6.1.4. Multiscale modeling
- A6.1.5. Multiphysics modeling
- A6.2.4. Statistical methods
- A6.3.3. Data processing
- A7.1.3. Graph algorithms
- A9.4. Natural language processing
- A9.7. AI algorithmics
Other Research Topics and Application Domains
- B1.1.8. Mathematical biology
- B1.2. Neuroscience and cognitive science
- B1.2.1. Understanding and simulation of the brain and the nervous system
- B1.2.2. Cognitive science
- B1.2.3. Computational neurosciences
- B2.1. Well being
- B2.5.1. Sensorimotor disabilities
- B2.5.3. Assistance for elderly
- B2.7.2. Health monitoring systems
- B9.1.2. Serious games
- B9.3. Medias
- B9.5.2. Mathematics
- B9.5.3. Physics
- B9.6.8. Linguistics
- B9.9. Ethics
1 Team members, visitors, external collaborators
Research Scientists
- Bruno Cessac [Team leader, Inria, Senior Researcher, HDR]
- Aurelie Calabrese [Inria, Starting Research Position, until Sep 2021]
- Pierre Kornprobst [Inria, Senior Researcher, HDR]
- Hui-Yin Wu [Inria, Starting Faculty Position]
PhD Students
- Alexandre Bonlarron [Inria, from Oct 2021]
- Simone Ebert [Univ Côte d'Azur]
- Jerome Emonet [Inria, from Oct 2021]
- Evgenia Kartsaki [Université de Newcastle upon Tyne - Angleterre, until Feb 2021]
- Florent Robert [Univ Côte d'Azur, from Oct 2021]
Technical Staff
- Jeremy Termoz Masson [Inria, Engineer, from Jun 2021]
Interns and Apprentices
- Johanna Delachambre [Inria, Apprentice]
- Jerome Emonet [Inria, until Jun 2021]
- Vincent Fournet [Inria, from Mar 2021 until Aug 2021]
- Nicolas Fricker [Univ Côte d'Azur, from Mar 2021 until May 2021]
- Vivien Gagliano [Inria, from Jun 2021 until Aug 2021]
- Sebastian Gallardo-Diaz [Inria, from May 2021 until Oct 2021]
- Francois Nicol [Univ Côte d'Azur, from Mar 2021 until May 2021]
Administrative Assistant
- Marie-Cecile Lafont [Inria]
Visiting Scientist
- Ignacio Patricio Ampuero Saavedra [Universidad Técnica Federico Santa María, Oct 2021]
External Collaborator
- Eric Castet [CNRS, from Apr 2021]
2 Overall objectives
Vision is a key function to sense the world and perform complex tasks. It has high sensitivity and strong reliability, given that most of its input is noisy, changing, and ambiguous. A better understanding of biological vision can thus bring about scientific, medical, societal, and technological advances, contributing towards well-being and quality of life. Especially considering the aging of the population in developed countries, where the number of people with impaired vision is increasing dramatically
In these countries, the majority of people with vision loss are adults who are legally blind, but not totally blind; instead, they have what is referred to as low vision. Low vision is a condition caused by eye disease, in which visual acuity is 3/10 or poorer in the better seeing eye (corrected normal acuity being 10/10) and cannot be corrected or improved with glasses, medication or surgery. Severe acuity reduction, reduced contrast sensitivity and visual field loss are the three types of visual impairment leading to low vision. Broadly speaking, visual field loss can be divided into macular loss (central scotoma) and peripheral loss (tunnel vision), resulting from the development of retinopathy, causing damages to the retina (e.g., retinitis pigmentosa).
Common forms of retinopathy include maculopathies, such as diabetic maculopathy, myopic maculopathy or Age-related Macular Degeneration (AMD). They are non-curable retinal diseases that affect mainly the macula, causing Central visual Field Loss (CFL). Patients suffering from such pathologies will develop a blind region called scotoma, located at the center of their visual field and spanning about 20° or more (Figure 1). To better visualize the impact of such a large hole in your visual field, try stretching your index and little finger as far as possible from each other at arm’s length; the span is about 15°.

Figure depicts a picture of a person through the eyes of a person with CFL (a scotoma blurs the image).
Central blind spot (i.e., scotoma), as perceived by an individual suffering from Central Field Loss (CFL) when looking at someone's face.
In contrast to visual deficits such as myopia, hypermetropia, or cataract, these pathologies cannot be compensated by glasses, lens or surgery and necessitates specific, ongoing research and techniques, for diagnosis, rehabilitation, aids or therapy. This calls for the need of integrated efforts to understand the human visual system, investigating the impact of visual pathologies at both a neuronal and perceptual level, as well as the development of novel solutions for diagnosis, rehabilitation, and assistance technologies. In particular, we investigate a number of methodologies, including :
- Image enhancement: There is a high interest to use these methods coming from image processing and computer graphics in the design of vision aid systems, such as to simplify complex scenes, augment important visual indices, or compensate missing information. The choice of enhancement technique needs to be adapted to the perceptual skills and needs of each patient.
-
Biophysical modeling: Mathematical models are used to explain observations, predict behaviours and propose new experiments. This requires a constant interaction with neuroscientists. In Biovision team we use this approach to better understand vision in normal and pathological conditions (Figure 2).
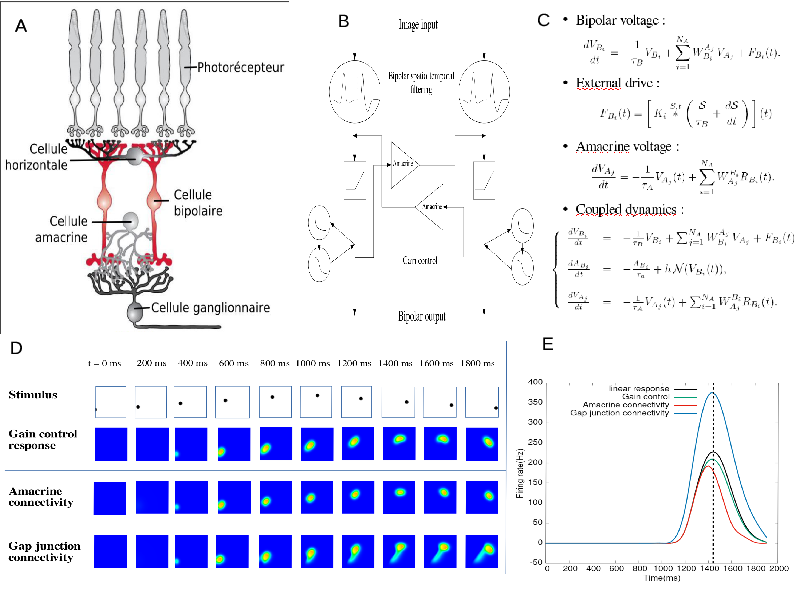
The process of retina modelling. A) Inspired from the retina structure in biology, we, B) designe a simplified architecture keeping retina components that we want to better understand. C) From this we derive equations that we can study mathematically and/or with numerical simulations (D). In E we see an example. Here, our retina model's shows how the response to a parabolic motion where the peak of response resulting from amacrine cells connectivity or gain control is in advance with respect to the peak in response without these mechanisms. This illustrates retinal anticipation.
Figure 2: The process of retina modelling. A) The retina structure from biology. B) Designing a simplified architecture keeping retina components that we want to better understand (here, the role of Amacrine cells in motion anticipation); C) Deriving mathematical equations from A and B. D, E). Results from numerical modelling and mathematical modelling. Here, our retina model's response to a parabolic motion where the peak of response resulting from amacrine cells connectivity or gain control is in advance with respect to the peak in response without these mechanisms. This illustrates retinal anticipation.
- Virtual and augmented reality: 3D graphics and animations technologies allow the creation of “mixed reality” on a spectrum of partially to fully virtual 3D environments. Augmented reality involves injecting 3D content as an overlay on a screen or transparent lens; virtual reality refers to immersing the viewer in a fully virtual world. Mixed reality applications can be experienced with headsets, smart glasses, or even mobile devices. They have strong applications towards study of user attention and behavior, immersive storytelling experiences, and in the context of low vision, to increase accessibility of visual media content by combining image processing techniques (Figure 3).
- Retinal imaging: Microperimetry refers to the precise and automated assessment of the visual field sensitivity. Pairing both anatomical and functional measurements, microperimetry is an essential tool to define field loss extent and progression. Indeed, it allows to perform two essential types of testing: (1) a scotometry (i.e., a precise measure of field loss position, size and magnitude), by presenting light stimuli of varying luminance in specific locations and for a given duration of time; (2) a fixation exam, by presenting a fixation target and recording the eye position for a given time period (usually 20-30 sec). Therefore, this retinal imaging technique is a core measure of Biovision's work with visually impaired patients.
- Eye-tracking: In explorations of oculomotor behavior, eye tracking allows to record the exact position of the gaze at any time point, providing measures of eye movement patterns, such as fixation duration, number of fixations and saccade duration. Because of calibration issues, using eye tracking with patients suffering from loss of macular function is a real challenge. In this aspect, members of Biovision have extensive experience, in addition to collaborating with health institutes, as well as cognitive and neuroscientists for the design of eye-tracking studies with low-vision patients.
In this context, Biovision aims to develop fundamental research as well as technology transfer along three axes of research and to form a strong synergy, involving a large network of national and international collaborators with neuroscientists, physicians, and modelers (Figure 3).
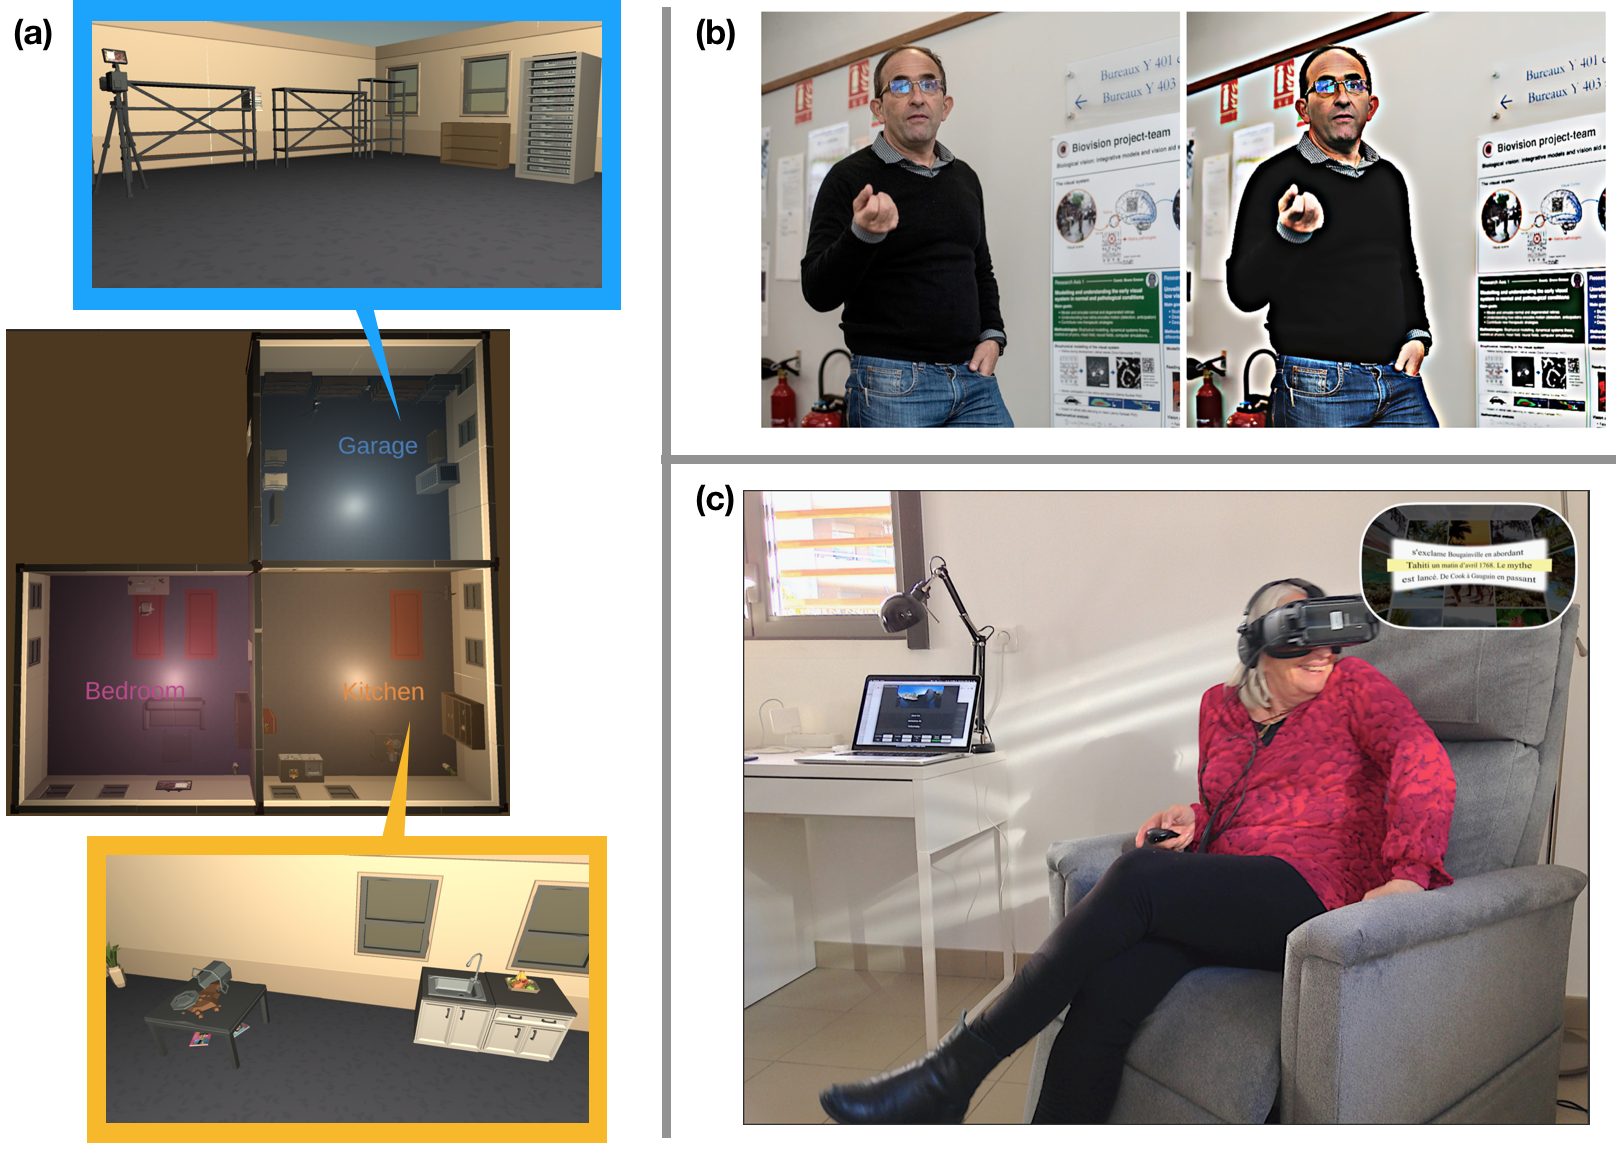
Figure depicts three images as described in the caption.
Multiple methodologies in graphics and image processing have applications towards low-vision technologies including (a) 3D virtual environments for studies of user perception and behavior, and creating 3D stimuli for model testing, (b) image enhancement techniques to magnify and increase visibility of contours of objects and people, and (c) personalization of media content such as text in 360 degrees visual space using VR headsets.
3 Research program
3.1 Axis 1 - Understanding the normal visual system at neuronal and perceptual levels
A holistic point of view is emerging in neuroscience, where one can simultaneously observe how vision works on different levels in the hierarchy of the visual system. An explosion of interest in multi-scale functional analysis and connectomics in brain science, and the rapid advancement in perceptual studies of visual systems are at the forefront of this movement. These studies call for new theoretical and integrated models where the goal is to model visual functions from motion integration at the retical-cortical level, to perception of and reaction to both basic stimuli and complex media content. In Biovision, we contribute to a better understanding of the visual system with those main goals:
- Better understanding the early visual system, retina, thalamus (LGN), cortex V1, with an emphasis on the retina, from a modelling perspective. In tight collaboration with neurobiologists labs, we want to extract computational principles ruling the way how retina encodes a visual scene thanks to its multi-layered structure, made of a wide variety of functional circuits involving specific cells and synapses. Our analysis is at the interface between biology, physics, mathematics and computer science, and involves multiple scales, from ion channels to the whole retina. This is necessary to figure out how local changes, induced e.g. by pharmacology, development, pathologies (see next section) impact the retina processing. We also want to understand how the information flow coming out of the retina drives the thalamus (LGN) and cortical (V1) response especially when handling motion: anticipation of a trajectory, detection of surprise (e.g. sharp change in a trajectory), fast motion (e.g. saccades).
- Reading, moving, behaving in 3D virtual environments. Here, the goal is to better understand how normal sighted people behave or react in specific, controlled conditions. Using virtual reality headsets with eye trackers, we are able to generate specific synthetic 3D environments where eye and head movements can be monitored. Emotional and behavioral reactions can equally be observed using specific captors such as electrodermal activity meters. This opens the possibility of adapting the 3D and visual content to the subject's reaction and feedback. Studies under controlled 3D environments provide a benchmark of contextual data for normally sighted people. In Biovision, we address such challenges as the modeling of user attention and emotion for interactive tasks in virtual reality (such as navigation and object manipulation), and the study of reading behavior and related occular motion patterns for automatically generated textual content.
- Analysis of visual media and user perception. Automated techniques to analyze visual content such as videos, images, complex documents, and 3D stimuli directly address challenges in understanding the impact of motion, style, and content on user perception. While deep learning has been used for various visual classification tasks, it has limitations for the qualitative analysis of visual content due to the difficulty of interpretability. Through multidisciplinary collaboration with researchers in computer science, linguistics and media studies, we can formalise visual properties of film or other visual media 45, and establish pipelines for automated content analysis, design embeddings for deep learning models to enhance interpretability, and use findings to the benefit of qualitative media studies.
3.2 Axis 2 - Understanding the impact of low vision at neuronal and perceptual levels
Following the same spirit as in Axis 1, we wish to study pathology's impact at multiple scales. Similarly, we want to develop new theoretical and integrated models of vision, from the microscopic level to perception. Notably, in Biovision, we have a particular interest in understanding how Central visual Field Loss (CFL) impacts attentional and oculo-motor behaviors. In this axis we aim at:
- Modeling of retinal prostheses stimulation and cortical responses. Retinal impairments leading to low vision start at the microscopic scale (cell scale or smaller, e.g. ion channel) and progressively affects the whole retina with cells degeneration, excessive cells growth (like Mueller cells), reshaping, appearance of large scale electric oscillations 35… These evolutive degeneracies obviously impact sight but have also to be taken into when proposing strategies to cure or assist low vision people. For example, when using electrical prostheses electric diffusion enlarges the size of evoked phosphenes 40 and the appearance of spontaneous electric oscillations can screen the electric stimulation 29. One of the key idea of our team (see previous section) is that the multi-scale dynamics of retina, in normal or pathological conditions, can be addressed from the point of view of dynamical systems theory completed with large scale simulations. In this spirit we are currently interested in the modeling of retinal prostheses stimulation and cortical responses in collaboration with F. Chavane team (INT) 28. We are also interested to develop models for the dynamical evolution of retinal degeneracies.
- Understanding eccentric vision pointing for selection and identification. The CFL caused by non-curable retinal diseases such as AMD induces dramatic deficits in several high-level perceptual abilities: mainly text reading, face recognition, and visual search of objects in cluttered environments, thus degrading the autonomy and the quality of life of these people. To adapt to this irreversible handicap, visually impaired people must learn how to use the peripheral parts of their visual field optimally. This requires the development of an “eccentric viewing (EV)” ability allowing low-vision persons to “look away” from the entity (e.g., a face) they want to identify. As a consequence, an efficient improvement of EV should target one of the most fundamental visuomotor functions in humans: pointing at targets with an appropriate combination of hand, head and eyes. We claim that this function should be re-adapted and assisted in priority. To do so, we want to understand the relation between sensori-motor behavior (while performing pointing tasks) and the pathology characteristics (from anatomo-functional retinal imaging). In particular, better understanding how EV could be optimized for each patient is at the core of the ANR DEVISE (see Sec. 9.3.1). This work will have an strong impact on the design of rehabilitation methods and vision-aid systems.
- Understanding how low vision impacts attentional and oculo-motor behaviors during reading. Difficulty with reading remains the primary complaint of CFL patients seeking rehabilitation 30. Considering its high relevance to quality of life and independence, especially among the elderly, reading should be maintained at all costs in those individuals. For struggling readers with normal vision (e.g., dyslexics, 2nd language learners), reading performance can be improved by reducing text complexity (e.g., substituting difficult words, splitting long sentences), i.e., by simplifying text optimally. However, this approach of text simplification has never been applied to low vision before. One of our goal is to investigate the different components of text complexity in the context of CFL, combining experimental investigations of both higher-level factors (linguistics) and lower-level ones (visual). The outcome results will constitute groundwork for precise guidelines to design reading aid systems relying on automated text simplification tools, especially targeted towards low vision. In addition to this experimental approach, modelling will also be used to try and decipher reading behaviour of the visually impaired. Our goal being to model mathematically pathological eye movements during reading 32, 31, taking into account the perceptual constraint of the scotoma and adjust the specific influence of linguistic parameters, using results from our experimental investigation on text complexity with CFL.
- Attentional and behavioural studies using virtual reality. Studying low-vision accessibility to visual media content is a major challenge due to the difficulty of (1) having quantifiable metrics on user experience, which varies between individuals, and (2) providing well-controlled environments to develop such metrics. Virtual reality offers such opportunities to create a fully-customisable and immersive 3D environment for the study of user perception and bahaviour. Integrated sensors such as gaze tracking, accelerometers, and gyroscopes allow to some degree the tracking of user head, limb (from handheld controllers), and eye movement. Added sensors can further extend our capabilities to understand the impact of different user experiences, such as the addition of electrodermal sensors to gain insight into cognitive load and emotional intensity.
3.3 Axis 3 - Diagnosis, rehabilitation, and low-vision aids
In 2015, 405 million people were visually impaired around the globe, against ‘only‘ 285 million in 2010. Because of aging and its strong correlation with eye disease prevalence, this number is only expected to grow. To address this global health problem, actions must be taken to design efficient solutions for diagnosis, personalized rehabilitation methods, and vision-aid systems handling real-life situations. In Biovision, we envision synergistic solutions where, e.g., the same principles used in our rehabilitation protocols could be useful in a vision-aid system.
- Exploring new solutions for diagnosis. Our goal is to allow for earlier and more decisive detection of visual pathologies than current methods to prevent the development of some pathologies by earlier interventions in the form of treatment or rehabilitation. These methods will rely on a fine analysis of subjects doing a specific task (e.g., pointing or reading). They will result from our understanding of the relation between the anatomo-functional characteristics of the pathology and the sensori-motor performance of the subjects.
- Designing rehabilitation methods in virtual reality (VR). Current rehabilitation methods used by ophthalmologists, optometrists, or orthoptists often impose non-ecological constraints on oculomotor behaviours (for example by keeping the head still) and rely on repetitive exercises which can be unpleasant and hardly motivating. One particular focus we have is to train eccentric vision for patients suffering from CFL. Our objective is to design novel visual rehabilitation protocols using virtual reality, to offer immersive and engaging experiences, adapted to the target audience and personalized depending on their pathology. This work requires a large combination of skills, from the precise identification of the sensori-motor function we target, to the design of an engaging immersive experience that focuses on this function, and of course the long testing phase necessary to validate the efficacy of a rehabilitation method. It has to be noted that our goal is not to use VR simply to reproduce existing conventional therapies but instead develop new motivating serious games allowing subjects to be and behave in real-life scenarios. Beyond, we also want to take inspiration from what is done in game development (e.g., game design, level design, narratology).
- Developing innovative vision-aid digital systems to empower patients with improved perceptual capacities. Based on our understanding of the visual system and subjects behavior in normal and pathological conditions, we want to develop digital systems to help low-vision people by increasing the accessibility of their daily-life activities. We have a particular focus on text and multi-modal content accessibility (e.g., books and magazines) again for people with CFL, for whom the task of reading becomes sometimes impossible. The solutions we develop seek to integrate linguistic, perceptual and ergonomic concepts. We currently explore solutions on different medias (e.g., tablets, VR).
4 Application domains
4.1 Applications of low-vision studies and technologies
- Rehabilitation: Serious games use game mechanics in order to achieve goals such as in training, education, or awareness. In our context, we consider serious games as a way to help low-vision patients in performing rehabilitation exercises. Virtual and augmented reality technology is a promising platform to develop such rehabilitation exercises targeted to specific pathologies due to their potential to create fully immersive environments, or inject additional information in the real world. For example, with Age-Related Macular Degeneration (AMD), our objective is to propose solutions allowing rehabilitation of visuo-perceptual-motor functions to optimally use residual portions of the peripheral retina and obtain efficient eccentric viewing.
- Vision aid-systems: A variety of aids for low-vision people are already on the market. They use various kinds of desktop (e.g. CCTVs), handheld (mobile applications), or wearable (e.g. OxSight, Helios) technologies, and offer different functionalities including magnification, image enhancement, text to speech, face and object recognition. Our goal is to design new solutions allowing autonomous interaction primarily using mixed reality – virtual and augmented reality. This technology could offer new affordable solutions developped in synergy with rehabilitation protocols to provide personalized adaptations and guidance.
- Cognitive research: Virtual and augmented reality technology represents a new opportunity to conduct cognitive and behavioural research using virtual environments where all parameters can be psychophysically controlled. Our objective is to re-assess common theories by allowing patients to freely explore their environment in more ecological conditions.
4.2 Applications of vision modeling studies
-
Neuroscience research. Making in-silico experiments is a way to reduce the experimental costs, to test hypotheses and design models, and to test algorithms. Our goal is to develop a large-scale simulations platform of the normal and impaired retinas. This platefom, called Macular, allows to test hypotheses on the retina functions in normal vision (such as the role of amacrine cells in motion anticipation 12, or the expected effects of pharmacology on retina dynamics 38). It is also to mimic specific degeneracies or pharmacologically induced impairments, as well as to emulate electric stimulation by prostheses.
In addition, the platform provides a realistic entry to models or simulators of the thalamus or the visual cortex, in contrast to the entries usually considered in modelling studies.
- Education. Macular is also targeted as a useful tool for educational purposes, illustrating for students how the retina works and responds to visual stimuli.
4.3 Applications of multimedia analysis and synthesis
- Media studies and social awareness. Investigating interpretable models of media analysis will allow us to provide tools to conduct qualitative media studies on large amounts of data in relation to existing societal challenges and issues. This includes understanding the impact of media design on accessibility for patients of low-vision, as well as raising awareness towards biases in media towards various minority groups.
- Content creation and assisted creativity. Models of user perception can be integrated in tools for content creators, such as to simulate low-vision conditions for architecture or media design. Furthermore, generative media technologies such as autoencoder neural networks can be integrated in assistive
5 Highlights of the year
A. Calabrèse left Inria in October 2021 to start working as a permanent researcher (CRCN) in the Laboratory of Cognitive Psychology (UMR 7290) in Marseille after she passed the CRCN CNRS national competitive exam.
5.1 Awards
V. Fournet received the prize for best research internship by the Fondation de l'Ecole Polytechnique, for his internship on "Automatisation de l’analyse d’images rétiniennes pour quantifier les zones fonctionnelles du champ visuel d’un patient malvoyant", co-supervised by P. Kornprobst and A. Calabrèse.
6 New software and platforms
During this year the following software has been developed.
6.1 New software
6.1.1 Macular
-
Name:
Numerical platform for simulations of the primary visual system in normal and pathological conditions
-
Keywords:
Retina, Vision, Neurosciences
-
Scientific Description:
At the heart of Macular is an object called "Cell". Basically these "cells" are inspired by biological cells, but it's more general than that. It can also be a group of cells of the same type, a field generated by a large number of cells (for example a cortical column), or an electrode in a retinal prosthesis. A cell is defined by internal variables (evolving over time), internal parameters (adjusted by cursors), a dynamic evolution (described by a set of differential equations) and inputs. Inputs can come from an external visual scene or from other synaptically connected cells. Synapses are also Macular objects defined by specific variables, parameters, and equations. Cells of the same type are connected in layers according to a graph with a specific type of synapses (intra-layer connectivity). Cells of a different type can also be connected via synapses (inter-layer connectivity).
All the information concerning the types of cells, their inputs, their synapses and the organization of the layers are stored in a file of type .mac (for "macular") defining what we call a "scenario". Different types of scenarios are offered to the user, which he can load and play, while modifying the parameters and viewing the variables (see technical section).
Macular is built around a central idea: its use and its graphical interface can evolve according to the user's objectives. It can therefore be used in user-designed scenarios, such as simulation of retinal waves, simulation of retinal and cortical responses to prosthetic stimulation, study of pharmacological impact on retinal response, etc. The user can design their own scenarios using the Macular Template Engine (see technical section).
-
Functional Description:
Macular is a simulation platform for the retina and the primary visual cortex, designed to reproduce the response to visual stimuli or to electrical stimuli produced by retinal prostheses, in normal vision conditions, or altered (pharmacology, pathology, development).
-
Release Contributions:
First release.
-
News of the Year:
First release, APP
- URL:
-
Contact:
Bruno Cessac
-
Participants:
Bruno Cessac, Evgenia Kartsaki, Selma Souihel, Teva Andreoletti, Alex Ye, Sebastian Gallardo-Diaz, Ghada Bahloul, Tristan Cabel, Erwan Demairy, Pierre Fernique, Thibaud Kloczko, Come Le Breton, Jonathan Levy, Nicolas Niclausse, Jean-Luc Szpyrka, Julien Wintz, Carlos Zubiaga Pena
6.1.2 GUsT-3D
-
Name:
Guided User Tasks Unity plugin for 3D virtual reality environments
-
Keywords:
3D, Virtual reality, Interactive Scenarios, Ontologies, User study
-
Functional Description:
We present the GUsT-3D framework for designing Guided User Tasks in embodied VR experiences, i.e., tasks that require the user to carry out a series of interactions guided by the constraints of the 3D scene. GUsT-3D is implemented as a set of tools that support a 4-step workflow to :
(1) annotate entities in the scene with names, navigation, and interaction possibilities, (2) define user tasks with interactive and timing constraints, (3) manage scene changes, task progress, and user behavior logging in real-time, and (4) conduct post-scenario analysis through spatio-temporal queries on user logs, and visualizing scene entity relations through a scene graph.
-
Contact:
Hui-Yin Wu
-
Participants:
Hui-Yin Wu, Marco Antonio Alba Winckler, Lucile Sassatelli, Florent Robert
-
Partner:
I3S
6.1.3 PTVR
-
Name:
Perception Toolbox for Virtual Reality
-
Keywords:
Visual perception, Behavioral science, Virtual reality
-
Functional Description:
Some of the main assets of PTVR are: (i) The “Perimetric” coordinate system allows users to place their stimuli in 3D easily, (ii) Intuitive ways of dealing with visual angles in 3D, (iii) Possibility to define “flat screens” to replicate and extend standard experiments made on 2D screens of monitors, (iv) Save experimental results and behavioral data such as head and gaze tracking. (v) User-friendly documentation with many animated figures in 3D to easily visualize 3D subtleties, (vi) Many “demo” scripts whose observation in the VR headset is very didactic to learn using PTVR, (vii) Focus on implementing standard and innovative clinical tools for visuomotor testing and visuomotor readaptation (notably for low vision).
- URL:
-
Authors:
Eric Castet, Christophe Hugon, Jeremy Termoz Masson, Johanna Delachambre, Hui-Yin Wu, Pierre Kornprobst
-
Contact:
Pierre Kornprobst
7 New results
We present here the new scientific results of the team over the course of the year. For each entry, members of Biovision are marked with a .
7.1 Understanding the normal visual system at neuronal and perceptual levels
7.1.1 Receptive field estimation in large visual neuron assemblies using a super resolution approach
Participants: Daniela Pamplona, Gerrit Hilgen, Matthias H. Hennig, Bruno Cessac, Evelyne Sernagor, Pierre Kornprobst.
1 Ecole Nationale Supérieure de Techniques Avancées, Institut Polytechnique de Paris, France
2 Institute of Neuroscience (ION), United Kingdom
3 Institute for Adaptive and Neural Computation, University of Edinburgh, United Kingdom
Description: Computing the Spike-Triggered Average (STA) is a simple method to estimate linear receptive field (RF) in sensory neurons. For random, uncorrelated stimuli the STA provides an unbiased RF estimate, but in practice, white noise at high resolution is not an optimal stimulus choice as it usually evokes only weak responses. Therefore, for a visual stimulus, images of randomly modulated blocks of pixels are often used. This solution naturally limits the resolution at which an RF can be measured. Here we present a simple super-resolution technique that can be overcome these limitations. We define a novel stimulus type, the shifted white noise (SWN), by introducing random spatial shifts in the usual stimulus in order to increase the resolution of the measurements. In simulated data we show that the average error using the SWN was 1.7 times smaller than when using the classical stimulus, with successful mapping of 2.3 times more neurons, covering a broader range of RF sizes. Moreover, successful RF mapping was achieved with brief recordings of light responses, lasting only about one minute of activity, which is more than 10 times more efficient than the classical white noise stimulus. In recordings from mouse retinal ganglion cells with large scale multi-electrode arrays, we successfully mapped 21 times more RF than when using the traditional white noise stimuli. In summary, randomly shifting the usual white noise stimulus significantly improves RF estimation, and requires only short recordings.
Figure 4 illustrates our method. In 2021, we have been working on writing the paper which is currently under review. For more information, see a preliminary version: 39
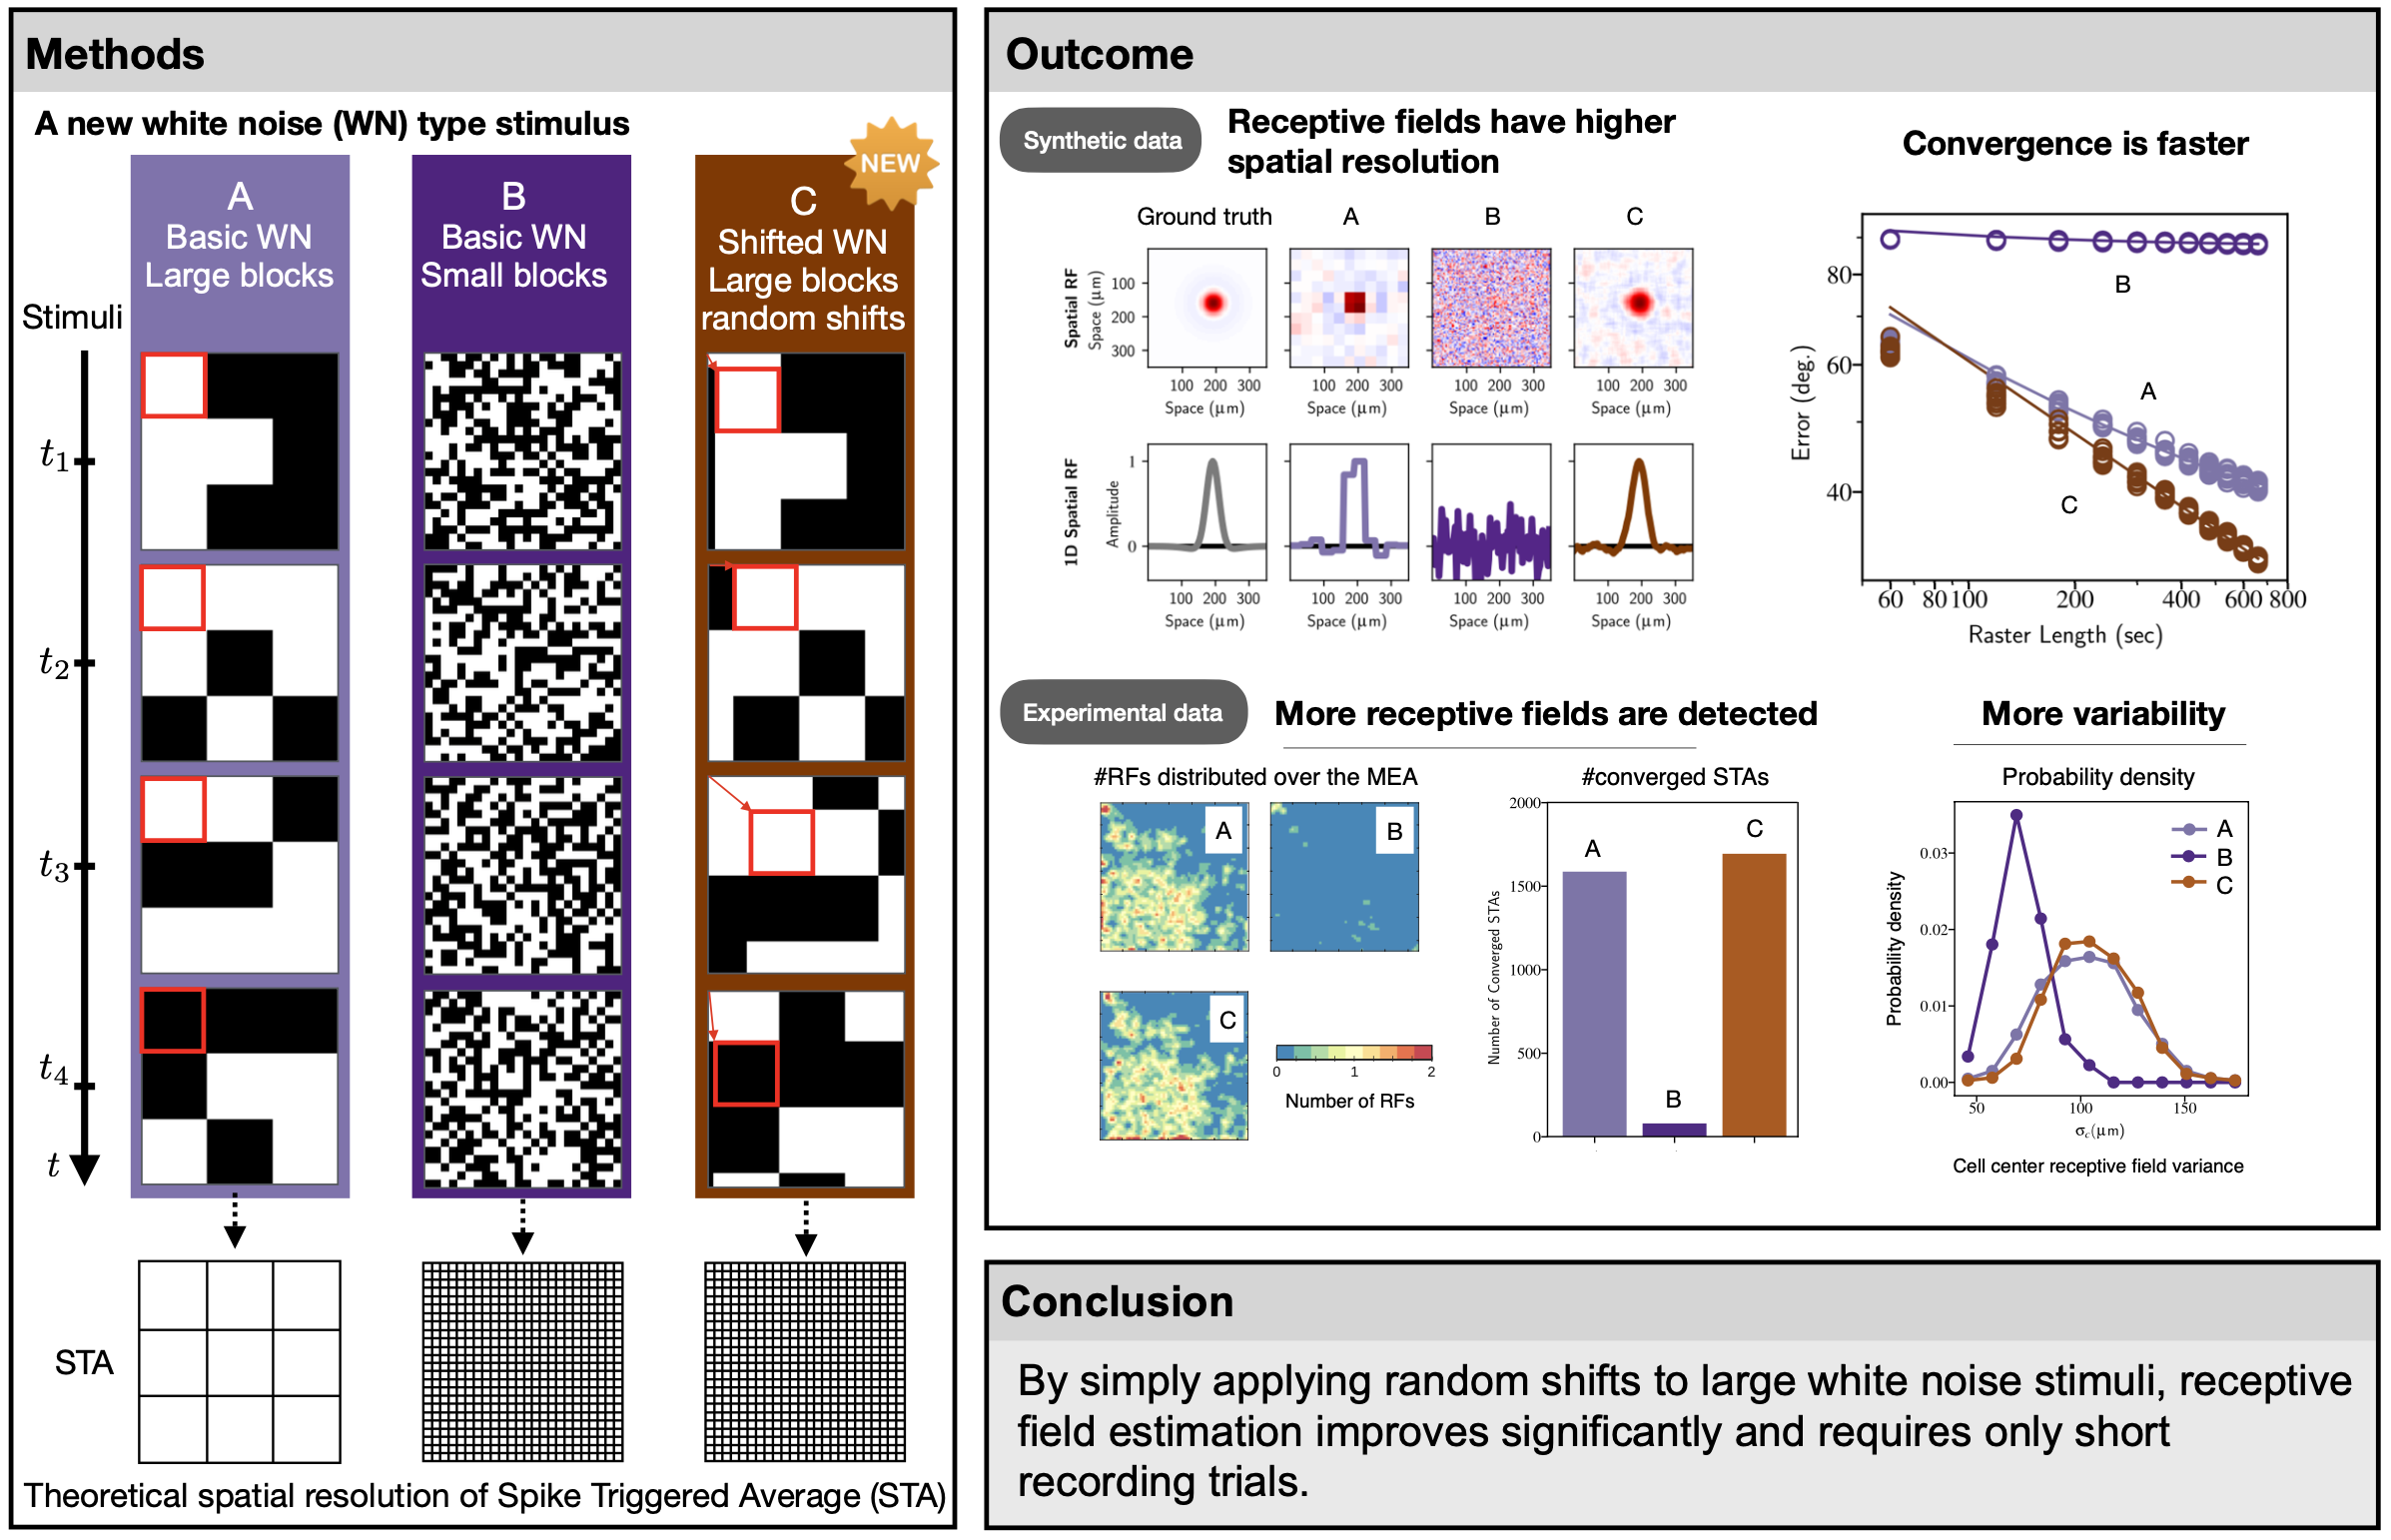
This figure illustrates how one estimates the receptive field of retinal ganglion cells with our approach. One presents a sequences of images composed of black and white squares of fixed size (checker board) which, in addition and in contrast to classical methods, are randomly shifted vertically and horizontally. As we show, this largely improves the resolution of the computed receptive field.
Graphical abstract of receptive field estimation in large visual neuron assemblies using a super resolution approach.
7.1.2 Retinal processing: insights from mathematical modelling
Participants: Bruno Cessac.
Description: The retina is the entrance of the visual system. Although based on common biophysical principles the dynamics of retinal neurons is quite different from their cortical counterparts, raising interesting problems for modellers. In this work we have addressed mathematically stated questions in this spirit.
-
How does the structure of the retina, in particular, amacrine lateral connectivity condition the retinal response to dynamic stimuli ? With the help of a dynamical model based on the layered structure of the retina (Fig. 5) this question is addressed at two levels.
- Level 1. Single cell response to stimuli. Using methods from dynamical systems theory, we are able to compute the receptive field of Ganglion cells resulting from the layered structure of Fig. 5. This is expressed in terms of an evolution operator whose eigenmodes characterise the response of Ganglion cells to spatio-temporal stimuli with potential mechanisms such as resonances, waves of activity induced by a propagating stimulus. We also discuss the effect of non linear rectification on the receptive field.
- Level 2. Collective response to stimuli and spike statistics. What is the structure of the spatio-temporal correlations induced by the conjunction of the spatio-temporal stimulus and the retinal network, in particular, the amacrine lateral connectivity ? While the overlap of BCells receptive field has a tendency to correlate Ganglion cells activity, it is usually believed that the amacrine network has the effect to decorrelate these activities. We investigate this aspect mathematically and show that this decorrelation happens only under very specific hypotheses on the amacrine network. In contrast, we show how non linearities in dynamics can play a significant role in decorrelation.
- How could spatio-temporal stimuli correlations and retinal network dynamics shape the spike train correlations at the output of the retina ? Here, we review some recent results in our group showing how the concept of spatio-temporal Gibbs distributions and linear response theory can be used to construct canonical probability distributions for spike train statistics. In this setting, one establishes a linear response for a network of interacting spiking cells, that can mimic a set of RG cells coupled via effective interactions corresponding to the A cells network influence. This linear response theory not only gives the effect of a non stationary stimulus to first order spike statistics (firing rates) but also its effect on higher order correlations.
- We also briefly discuss some potential consequences of these results. Retinal prostheses; Convolutional networks, Implications for cortical models, Neuro-geometry.
Figure 5 illustrates the retina model used to develop our results. For more details see our paper accepted in J. Imaging, special issue “Mathematical Modeling of Human Vision and its Application to Image Processing”, 202111.
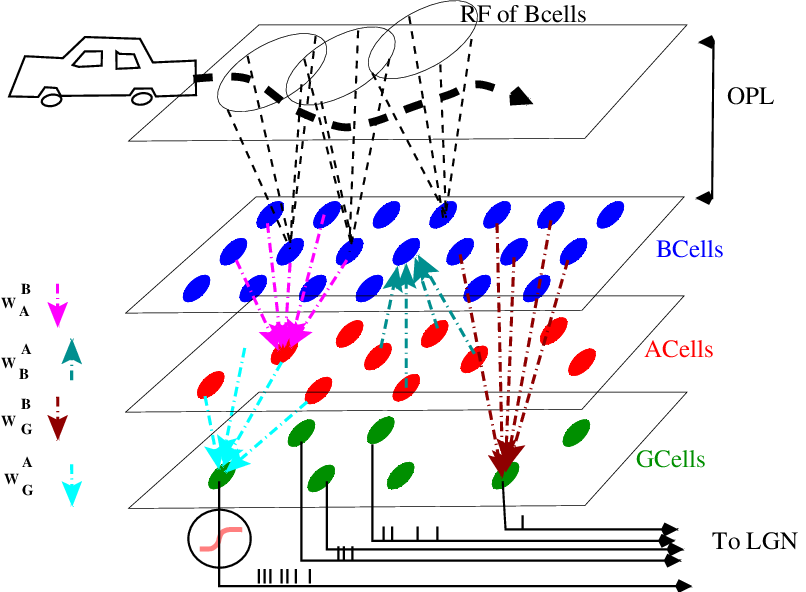
Structure of the retina model used in the paper. A moving object moves along a trajectory. Its image is projected by the eye optics to the upper retina layers (Photoreceptors and H cells) and stimulates them. Then the layers of Bipolar (B cells), Amacrines (A Cells) and Ganglion (G cells), process this signal which is eventually converted into a spike train sent to the visual cortex.
7.1.3 The non linear dynamics of retinal waves
Participants: Bruno Cessac, Dora Matzakou-Karvouniari.
1 EURECOM, Sophia Antipolis, France.
Description: We investigate the dynamics of stage II retinal waves via a dynamical system model, grounded on biophysics, and analyzed with bifurcation theory. We model in detail the mutual cholinergic coupling between Starburst Amacrine Cells (SACs).
We show how the nonlinear cells coupling and bifurcation structure explain how waves start, propagate, interact and stop. We argue that the dynamics of SACs waves is essentially controlled by two parameters slowly evolving in time: one, , controlling the excitatory cholinergic cells coupling, and the other, , controlling cell's hyperpolarisation and refractoriness. Thanks to a thorough bifurcation diagram in the space , we actually arrive at a quite surprising and somewhat counter intuitive result: mostly, the variety observed in waves dynamics comes from the fact that they start in a tiny region in the space delimited by bifurcation lines, where waves initiation is quite sensitive to perturbations such as noise. Although this region is tight, the slow dynamics returns to it in a recurrent way, regenerating the potentiality to trigger new waves sensitive to perturbations.
In addition, this scenario holds on an interval of acetylcholine coupling compatible with the variations observed in experimental studies. We derive transport equations for , now considered as propagating fields shaping waves dynamics. From this, we are able to compute the wave speed as a function of acetylcholine coupling, as well as to show the existence of a critical value of this coupling, below which no wave can propagate. As we argue, these transport equations bare interesting analogies with the Kardar-Parisi-Zhang (KPZ) equations of interface growth on one hand, and Self-Organized Criticality on the other hand, opening up perspectives for future research. Figure 6 illustrates our results. For more details, see this (link), submitted, 17.
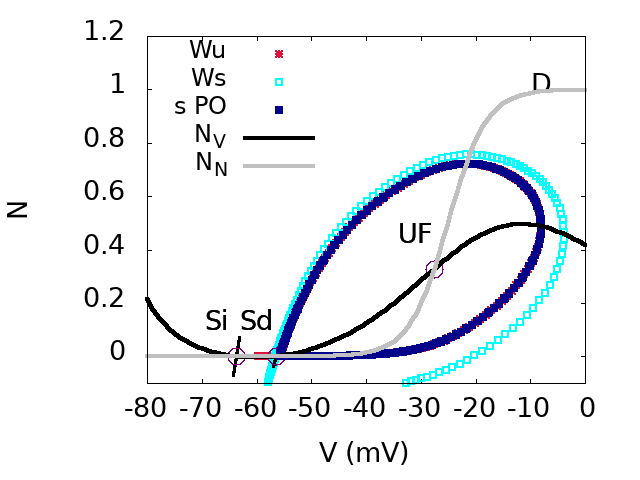
Top. bifurcation diagram of the SACs model in the plane (effective sAHP conductance) and (effective Ach conductance). Inset: Zoom on region D.
Bottom. From top to bottom, from left to right. Phase portraits of regions A,B,D,C.
7.1.4 A novel approach to the functional classification of retinal ganglion cells
Participants: Gerrit Hilgen, Evgenia Kartsaki, Viktoriia Kartysh, Bruno Cessac, Evelyne Sernagor.
1 Biosciences Institute, Newcastle University, Newcastle upon Tyne, UK
2 Health & Life Sciences, Applied Sciences, Northumbria University, Newcastle upon Tyne UK
3 Ludwig Boltzmann Institute for Rare and Undiagnosed Diseases (LBI-RUD), 1090 Vienna, Austria
4 Research Centre for Molecular Medicine (CeMM) of the Austrian Academy of Sciences, 1090 Vienna, Austria
5 SED INRIA Sophia-Antipolis
Description: Retinal neurons come in remarkable diversity based on structure, function and genetic identity. Classifying these cells is a challenging task, requiring multimodal methodology. Here, we introduce a novel approach for retinal ganglion cell (RGC) classification, based on pharmacogenetics combined with immunohistochemistry and large-scale retinal electrophysiology. Our novel strategy allows grouping of cells sharing gene expression and understanding how these cell classes respond to basic and complex visual scenes. Our approach consists of increasing the firing level of RGCs co-expressing a certain gene (Scnn1a or Grik4) using excitatory DREADDs (Designer Receptors Exclusively Activated by Designer Drugs) and then correlate the location of these cells with post hoc immunostaining, to unequivocally characterize anatomical and functional features of these two groups. We grouped these isolated RGC responses into multiple clusters based on the similarity of their spike trains. With our approach, combined with immunohistochemistry, we were able to extend the pre-existing list of Grik4 expressing RGC types to a total of 8 and, for the first time, we provide a phenotypical description of 14 Scnn1a-expressing RGCs. The insights and methods gained here can guide not only RGC classification but neuronal classification challenges in other brain regions as well.
Figure 7 illustrates our results. For more details, see the paper submitted to to Royal Society Open Biology19.
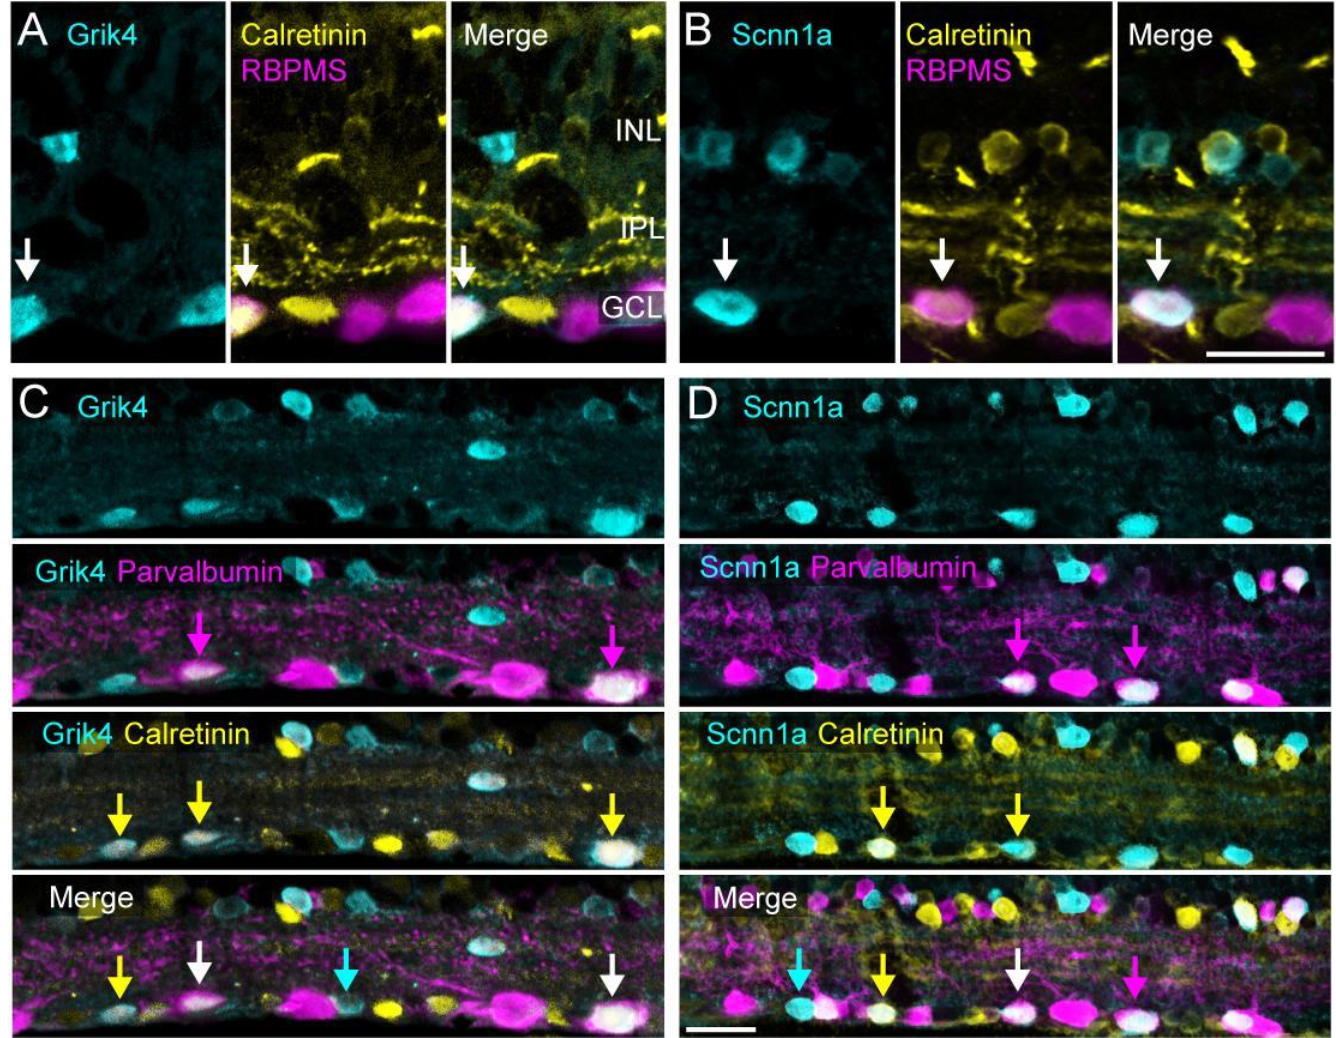
This figure shows experimental results from E. Sernagor lab (performed by G. Hilgen et E. Sernagor) showing how specific genes (Grik4 and Scnn1a) are expressed in mice retina, at the level of Retinal Ganglion Cells types.
Experimental results from E. Sernagor lab (performed by G. Hilgen et E. Sernagor) showing how specific genes (Grik4 and Scnn1a) are expressed in mice retina, at the level of Retinal Ganglion Cells types. INL = inner nuclear layer, IPL = inner plexiform layer, GCL = ganglion cell layer. Scale bar is D = 20 .
7.1.5 On the potential role of lateral connectivity in retinal anticipation
Participants: Selma Souihel, Bruno Cessac.
Description: Our visual system has to constantly handle moving objects. Static images do not exist for it, as the en-vironment, our body, our head, our eyes are constantly moving. The process leading from the photons reception in the retina to the cortical response takes about milliseconds. Most of this delay is due to photo-transduction. Though this might look fast, it is actually too slow. A tennis ball moving at 30 m/s - 108 km/h (the maximum measured speed is about 250 km/h) covers between and 3 m during this time, so, without a mechanism compensating this delay it wouldn’t be possible to play tennis (not to speak of survival, a necessary condition for a species to reach the level whereplaying tennis becomes possible). The visual system is indeed able to extrapolate the trajectory of a moving object to perceive it at its actual location. This corresponds to anticipation mechanisms taking place in the visual cortex and in the retina, with different modalities.
In this paper we analyse the potential effects of lateral connectivity (amacrine cells and gap junctions) on motion anticipation in the retina. Our main result is that lateral connectivity can - under conditions analysed in the paper - trigger a wave of activity enhancing the anticipation mechanism provided by local gain control. We illustrate these predictions by two examples studied in the experimental literature: differential motion sensitive cells and direction sensitive cells where direction sensitivity is inherited from asymmetry in gap junctions connectivity. We finally present reconstructions of retinal responses to 2D visual inputs to assess the ability of our model to anticipate motion in the case of three different 2D stimuli.
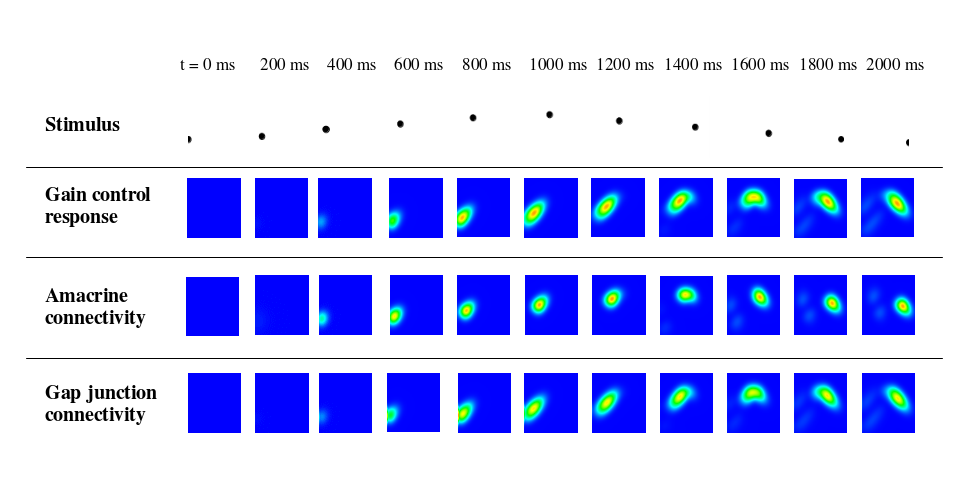
This figure shows the effect of anticipatory mechanisms. We present a dot moving along a parabolic trajectory to the model (first row). The response is a spot which follow the trajectory of the moving dot, but is slightly in advance with respect to it, corresponding to retinal anticipation. We show this anticipation when (second row) gain control takes place; (third row) with lateral ACells connectivity, and, last row, in the presence asymmetric gap junctions.
Figure 8 illustrates our results. For more details, see the paper published in the Journal of Mathematical Neuroscience, BioMed Central, 2021, 11. 12
7.1.6 Linear response for spiking neuronal networks with unbounded memory
Participants: Bruno Cessac, Ignacio Ampuero, Rodrigo Cofré.
1 Departamento de Informática, Universidad Técnica Federico Santa María, Valparaíso, Chile
2 CIMFAV-Ingemat, Facultad de Ingeniería 2340000, Universidad de Valparaíso, Valparaíso, Chile
Description: We consider a spiking neuronal network model where the non-linear dynamics and neurons interactions naturally produce spatio-temporal spikes correlations. We assume that these neurons reach a stationary state without stimuli and from a given time are submitted to a time-dependent stimulation (See Fig. 9). How are the spatio-temporal spike correlations modified by this stimulus ? We address this question in the context of linear response theory using methods from ergodic theory and so-called chains with complete connections, extending the notion of Markov chains to infinite memory, providing a generalized notion of Gibbs distribution. We show that spatio-temporal response is written in term of a history-dependent convolution kernel applied to the stimuli. We compute explicitly this kernel in a specific model example and analyse the validity of our linear response formula by numerical means. This relation allow us to predict the influence of a weak amplitude time dependent external stimuli on spatio-temporal spike correlations, from the spontaneous statistics (without stimulus) in a general context where the memory in spike dynamics can extend arbitrarily far in the past. Using this approach, we show how the linear response is explicitly related to the collective effect of the stimuli, intrinsic neuronal dynamics, and network connectivity on spike train statistics.
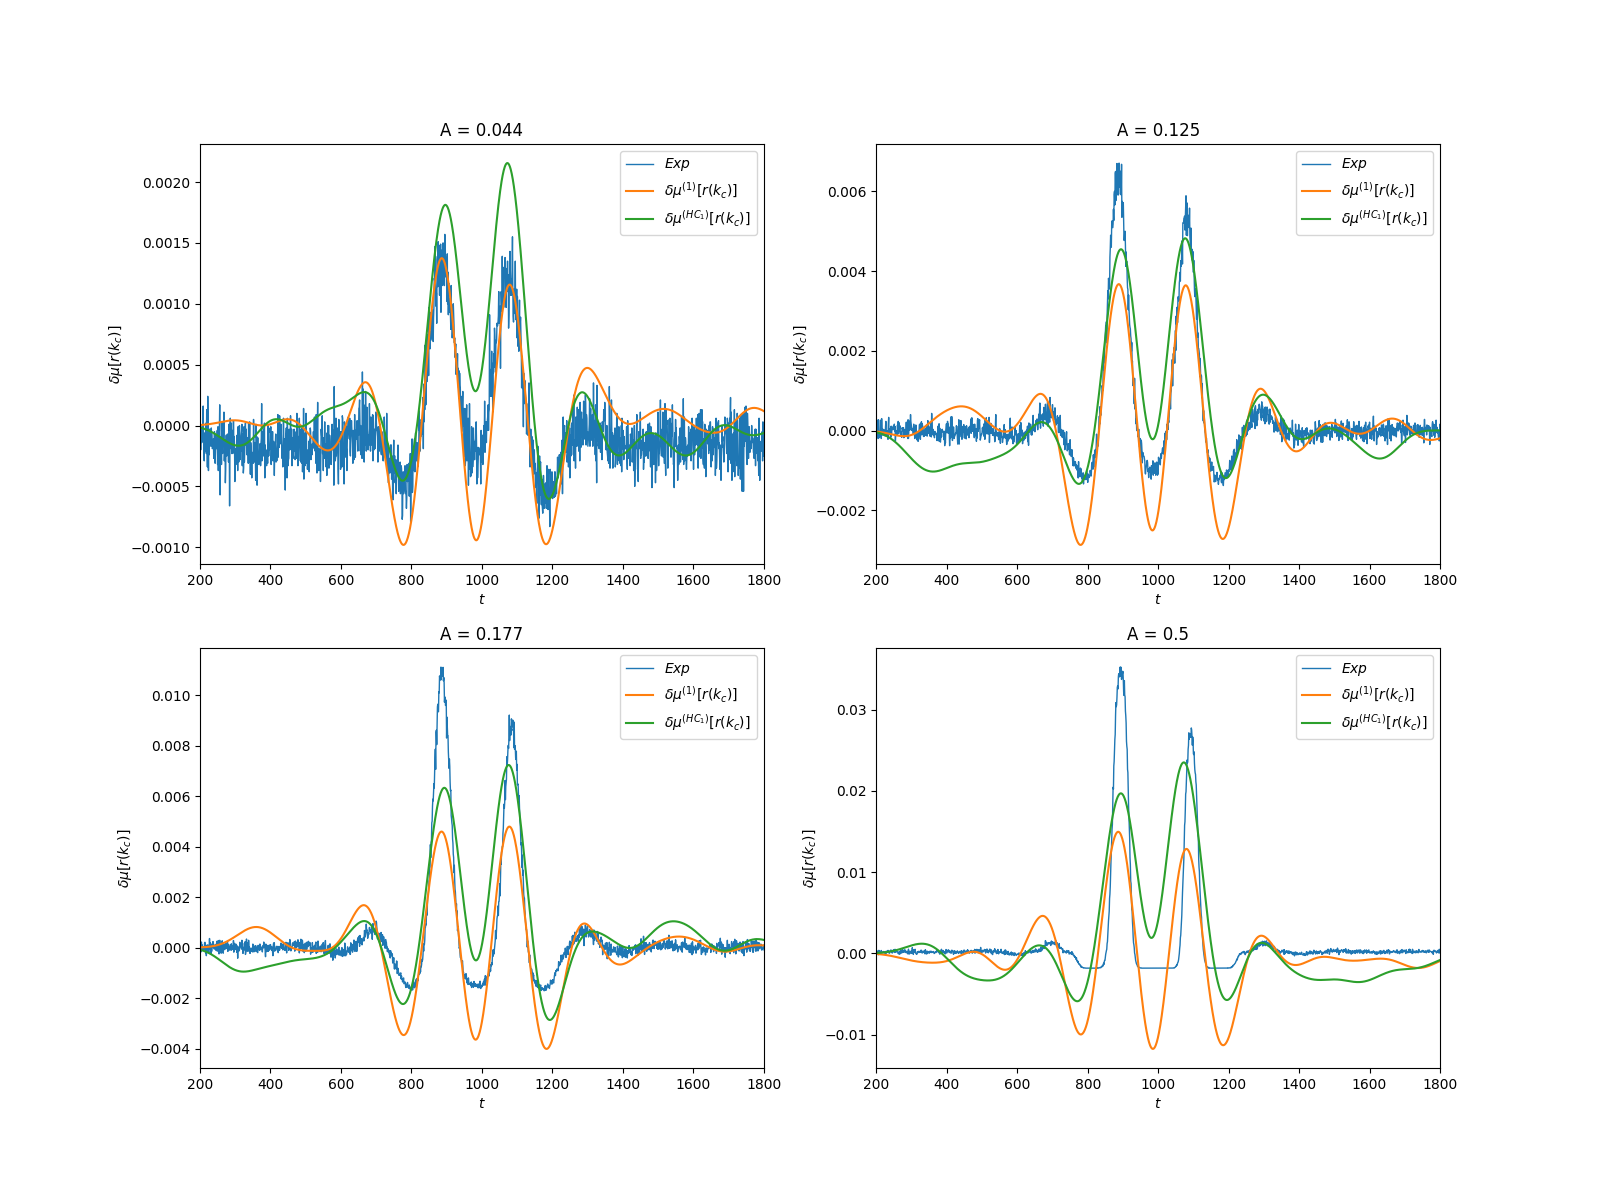
This figure shows how a moving object, sensed by a network of spiking neurons connected together, not only modifies the firing rates of neurons but also their correlations. This variation can be computed in the context of linear response theory and compared to numerical experiments.
For more detail, see the paper published in Entropy, MDPI, 2021, 23 (2), pp.155. ⟨10.3390/e23020155⟩ 10.
7.1.7 Creating embodied experiences in Virtual Reality
Participants: Hui-Yin Wu, Florent Robert, Marco Winckler , Lucile Sassatelli.
1 Université Côte d'Azur, France
2 CNRS I3S Laboratory, France
3 Institut Universitaire de France, France
4 Centre Inria d'Université Côte d'Azur, WIMMICS team, France
Other student participants: Théo Fafet, Brice Graulier, Barthelemy Passin-Cauneau
Description: Virtual reality (VR) offers extraordinary opportunities in user behavior research to study and observe how people interact in immersive 3D environments. A major challenge of designing these 3D experiences and user tasks, however, lies in bridging the inter-relational gaps of perception between the designer, the user, and the 3D scene. Based on Paul Dourish's theory of embodiment, these gaps of perception are: ontology between the scene representation and the user and designer perception, intersubjectivity from designer to user in task communication, and intentionality from the user's intentions to the designer's interpretations. This relationship is illustrated in Figure 10
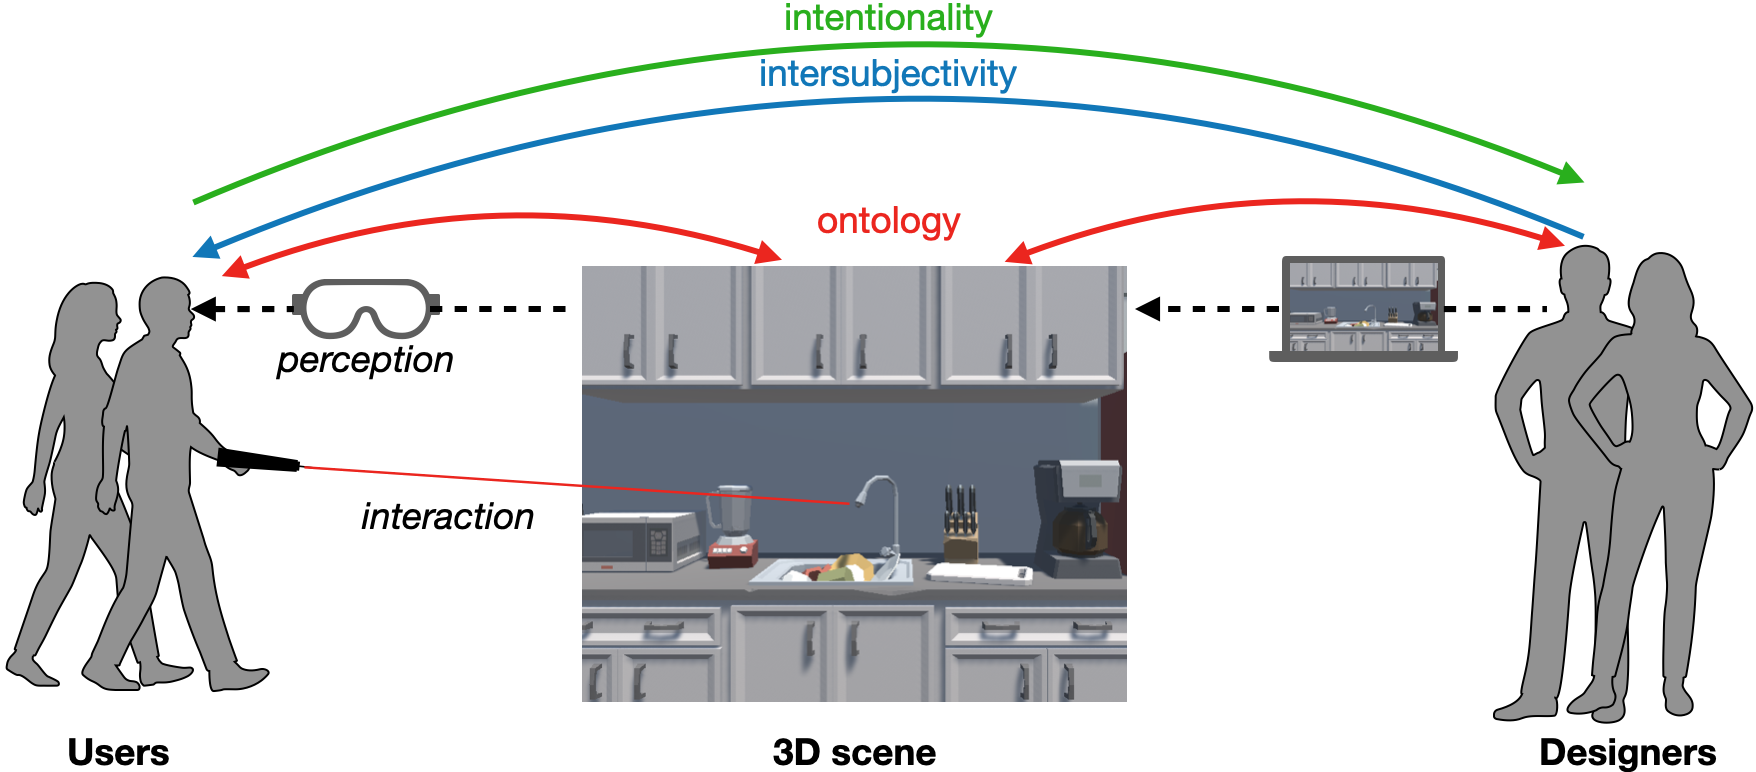
The figure depicts a 3D scene in the middle with two categories of users: scene designers on the right and users who experiences the scene on the left. Red arrows indicating “ontology” point from both sets to the 3D scene. Blue arrows indicating “intersubjectivity” point from the designers to the users. Finally, green arrows indicating “intentionality” point from the users to designers. A dotted arrow goes from the Designers, through a computer, to the 3D scene, indicating that the scene is created by Designers using computational tools. Another dotted arrow labelled “perception” goes from the 3D scene through a headset to the Users. Users hold a controller with a laser pointing towards the 3D scene, labelled as “interaction”.
We present the GUsT-3D framework for designing Guided User Tasks in embodied VR experiences, i.e., tasks that require the user to carry out a series of interactions guided by the constraints of the 3D scene. GUsT-3D is implemented as a set of tools that support a 4-step workflow to (1) annotate entities in the scene with names, navigation, and interaction possibilities, which can then be visualized as a scene graph (Figure 11), (2) define user tasks with interactive and timing constraints, (3) manage scene changes, task progress, and user behavior logging in real-time, and (4) conduct post-scenario analysis through spatio-temporal queries using ontology definitions.
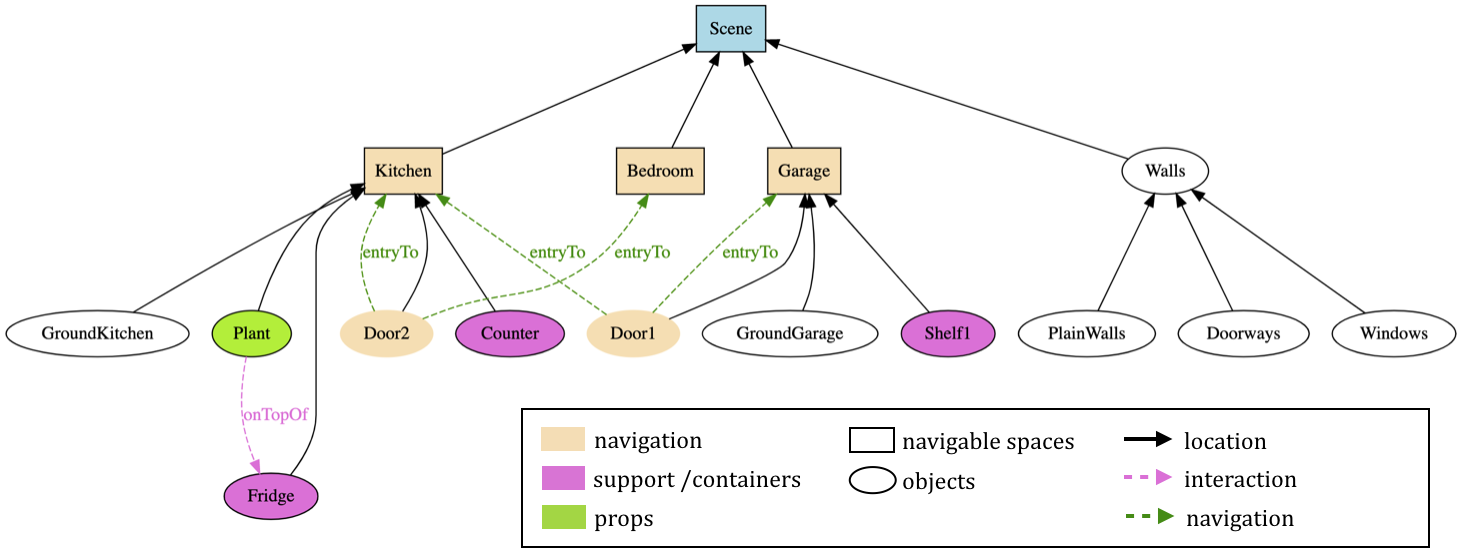
The figure depicts a tree-like structure with various entities as nodes. Object nodes (e.g., plant, table, wall
An example spatio-temporal query can be seen in Figure 12. This allows real-time guidance for typical interactive tasks such as seek and retrieval in VR environments.
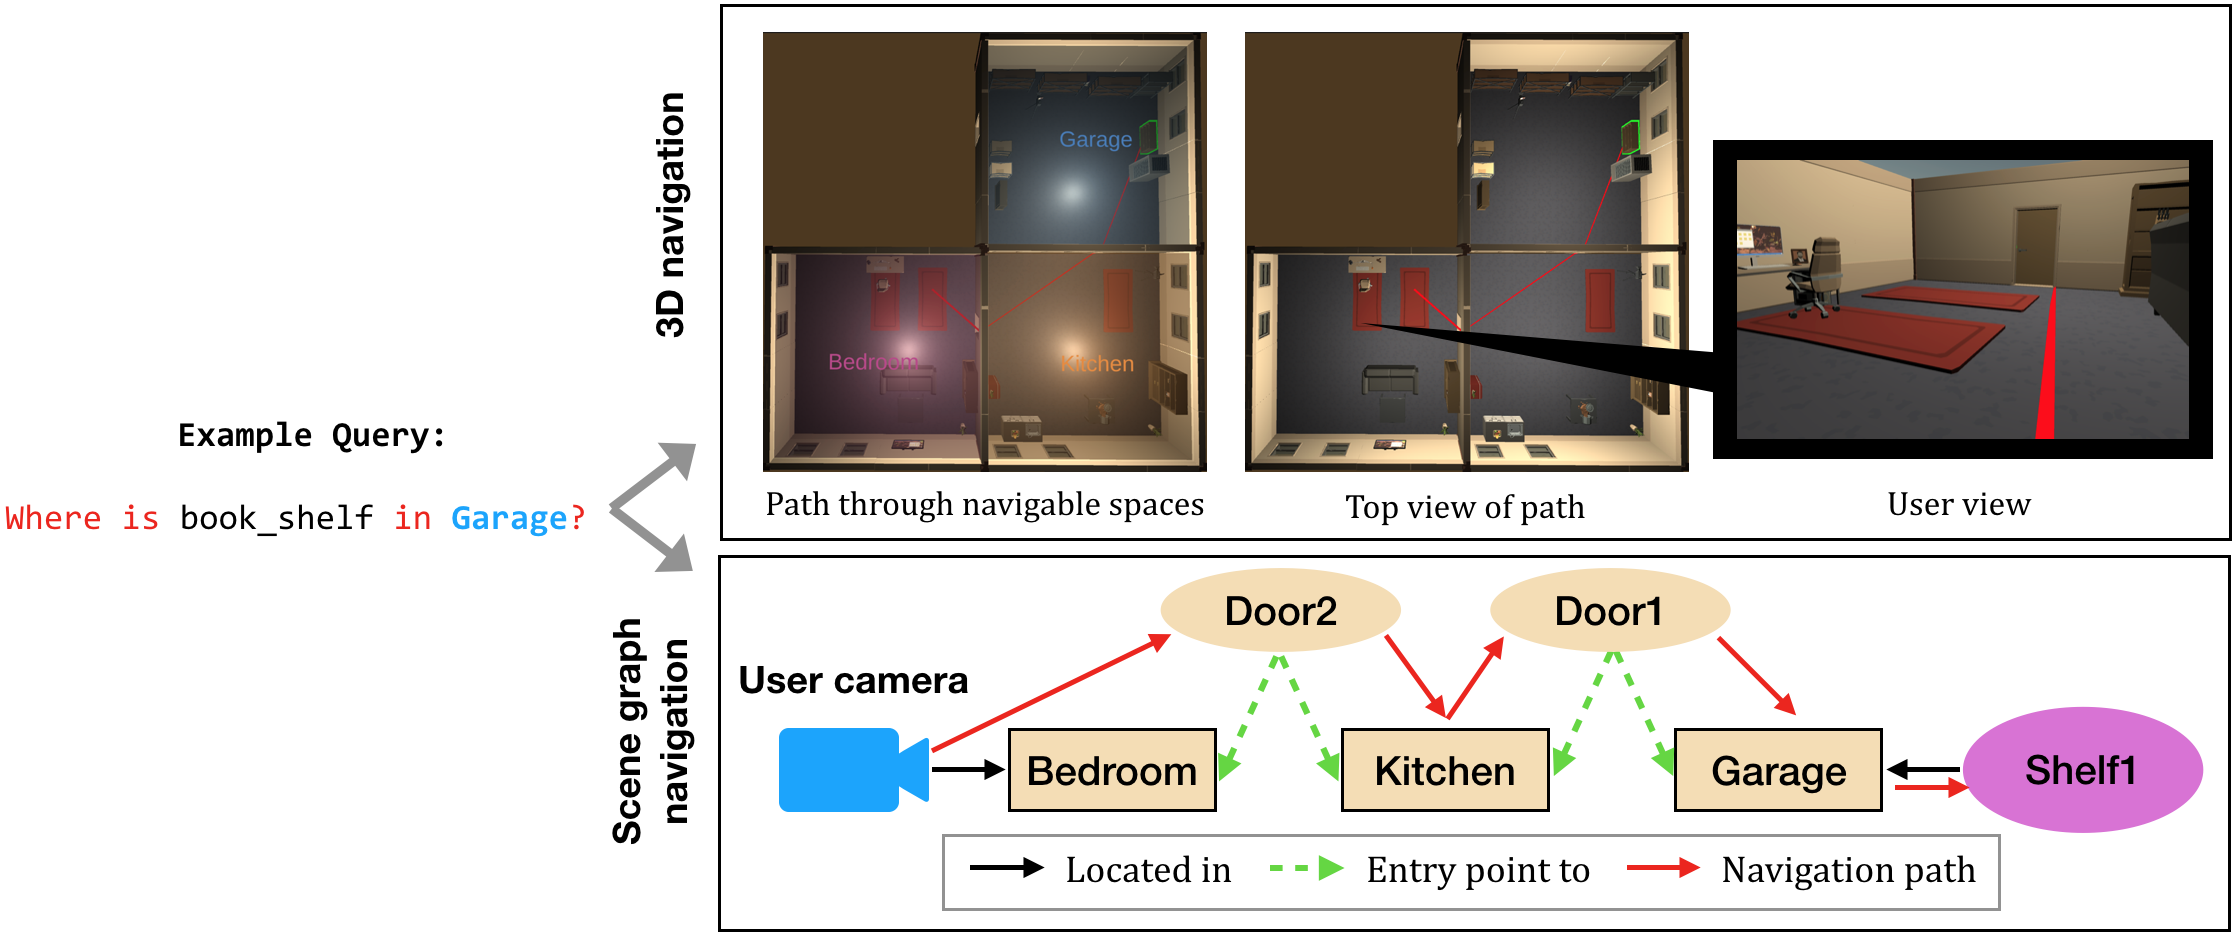
The query “Where is bookshelf in garage?” results in two parts of results: the upper part of the figure shows the 3D scene with the query object highlighted in green and a red navigable path from the user's current position to the target. The lower part of the figure shows the navigation and interaction path of the user to reach the target.
To illustrate the diverse possibilities enabled by our framework, we present two case studies with an indoor scene and an outdoor scene, and conducted a formative evaluation involving 6 expert interviews to assess the framework and the implemented workflow. Summative results of the user surveys are shown in Figure 13. Analysis of the responses show that the GUsT-3D framework fits well into a designer's creative process, providing a necessary workflow to create, manage, and understand VR embodied experiences of target users.
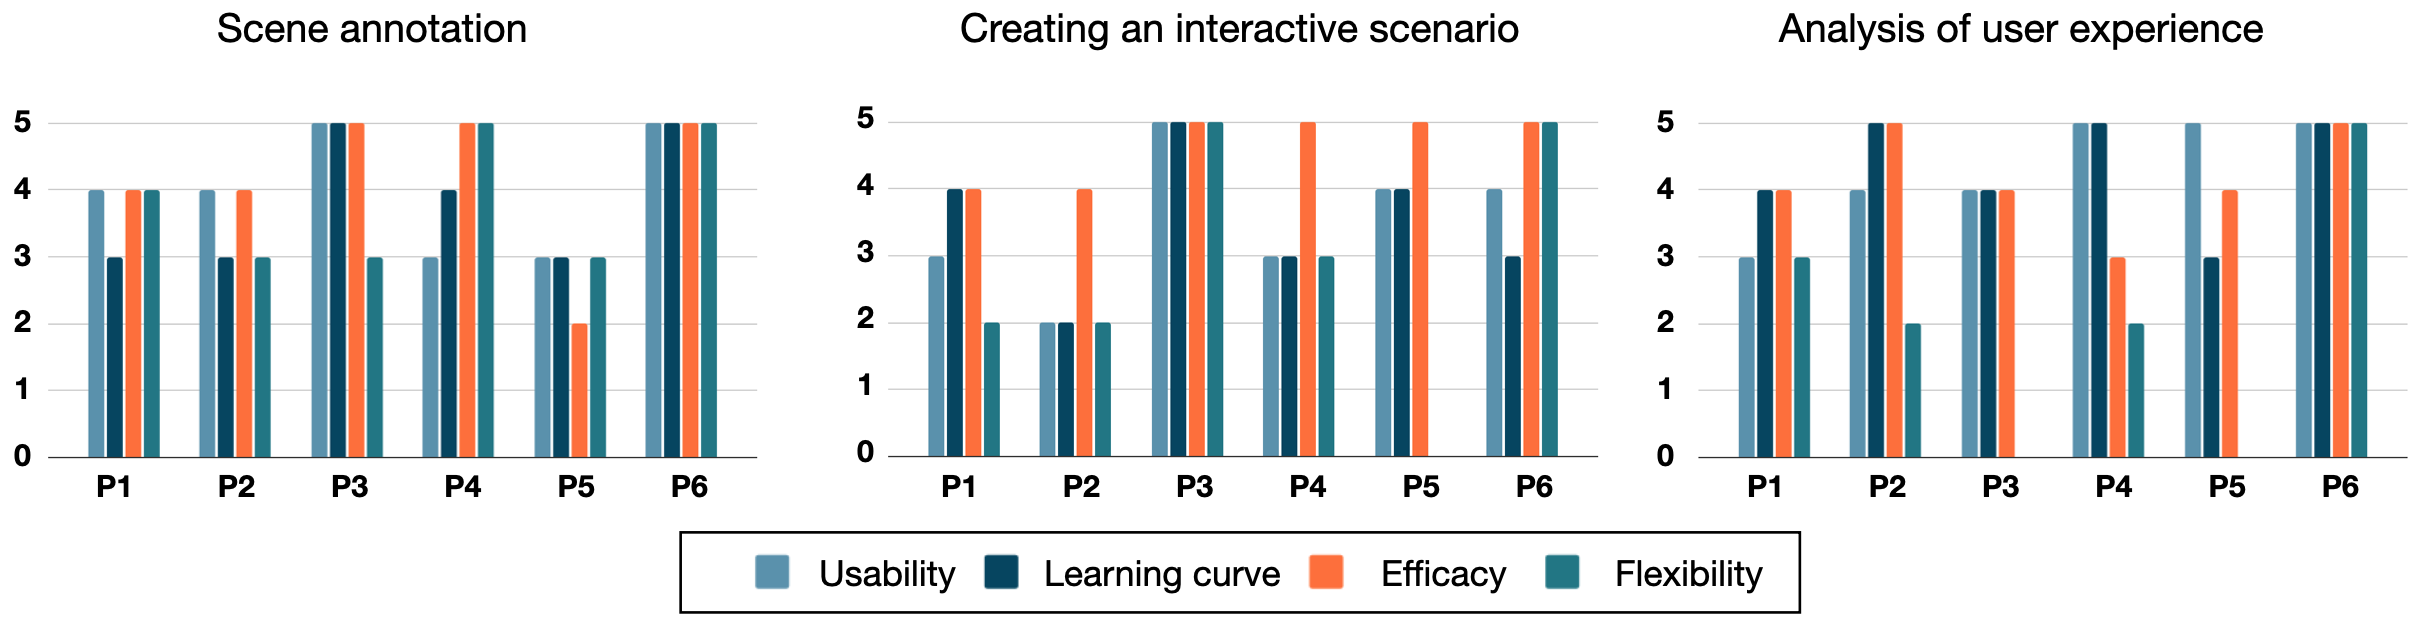
The figure shows three bar graphs, one for each of the three tasks “Scene Annotation”, “Creating an interactive scenario”, and “Analysis of user experience”. Four colors for bars represent the metrics of usability, learning cureve, efficacy, and flexibility. Each bar graph shows how the six users rank the metric on the task.
Florent Robert presented his work on designing the domain specific language in this work at the Journées Françaises en Informatique Graphique (JFIG) 15. This work has been accepted for publication in Proceedings of ACM on Human-Computer Interactions and will be presented at the ACM SIGCHI Symposium on Engineering Interactive Computing Systems. The software 6.1.2 is currently being registered for the CeCILL libre license.
7.2 Understanding the impact of low vision at neuronal and perceptual levels
7.2.1 Creating Attention-Driven 3D Environments for Low Vision (CREATTIVE3D)
Participants: Hui-Yin Wu (coordinator), Éric Castet , Bruno Cessac, Auriane Gros , Pierre Kornprobst, Stephen Ramanoël , Lucile Sassatelli, Marco Winckler .
1 Aix-Marseille University, Marseille, France
2 Université Côte d'Azur, France
3 CNRS CoBTEK Laboratory, France
4 CHU Nice, France
5 CNRS LAMHESS Laboratory, France
6 CNRS I3S Laboratory, France
7 Institut Universitaire de France, France
8 Centre Inria d'Université Côte d'Azur, WIMMICS team, France
Student participants: Florent Robert, Vivien Gagliano, Alessandro Pepegna, Anastasiia Kozlova, Meryem Boufalah, Loïc Filippi
Description: this is a newly accepted ANR JCJC project with targeted start date in 2022. The project aims to create an integrated framework for diverse and adapted 3D content creation, driven by models of user attention. In application, it targets low-vision training and rehabilitation with VR technology in complex traffic crossing scenarios, making for a strong health and social impact on the autonomy and the well-being of millions of people living with visual impairments. An overview of the project's prospective objectives can be found in Figure 14.
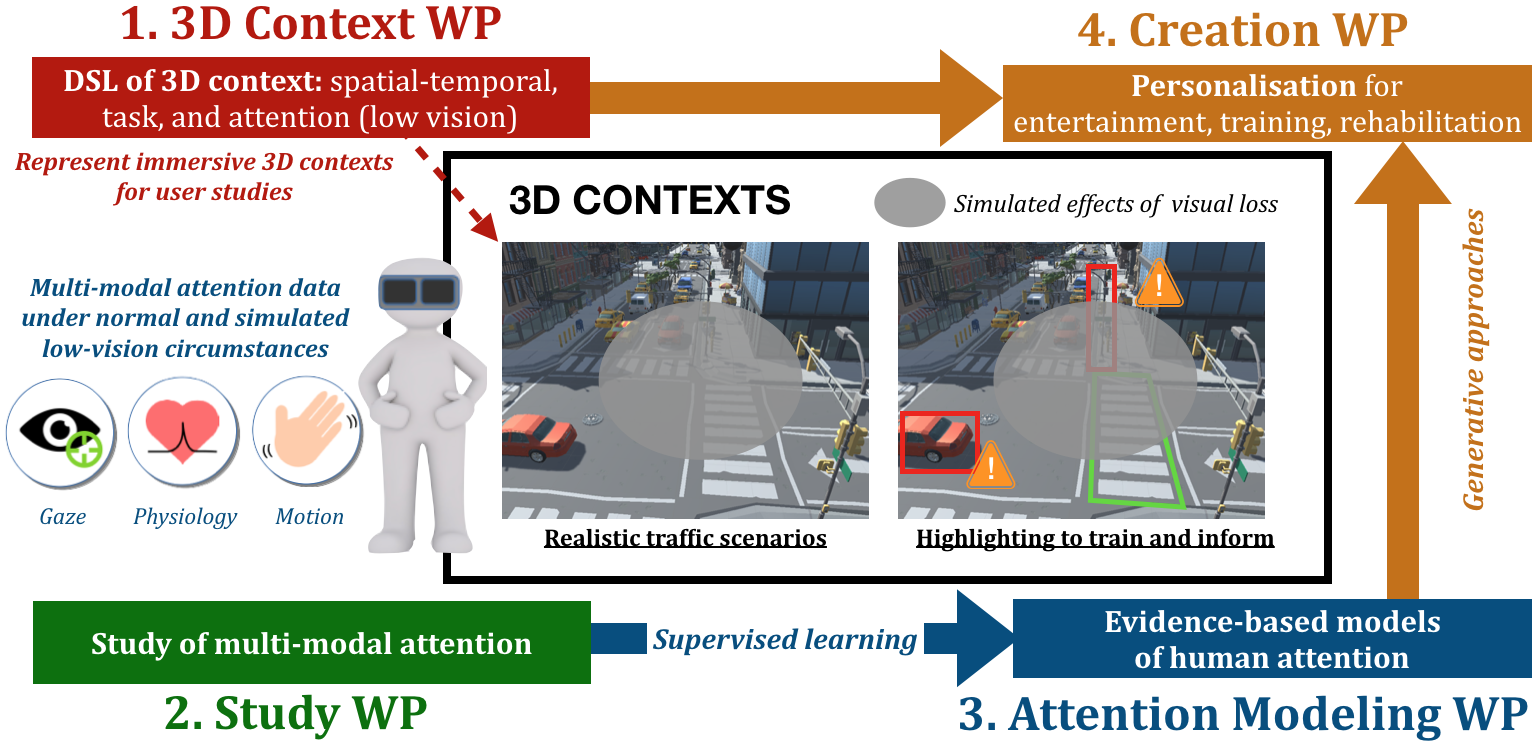
The figure depicts the four work packages as a 4-step workflow surrounding a centre figure of a 3D street scene with a simulated scotoma (a region that is greyed out). The scene also features from highlights and indications for the user.
Results: Through M2 student projects and internship supervision, we have begun exploring two axes:
Analysis and visualization of eye tracking data in virtual reality
: We establish a workflow for the collection, analysis, and visualization of eye tracking data for the HTC Vive Eye Pro headset. The workflow includes the following steps:
- Synchronization of head and eye tracking data caused by a mismatch between equipment timestamps and latency in transferring data to the software: We offer a preliminary solution to establish a synchronization point by comparing timestamps between two data streams and interpolate the different data point frequencies.
- Data validity verification: eye tracking data often presents noise and inaccuracies due to limitations in the precision of current eye tracking solutions. We implement a rule-based algorithm that excludes eye tracking data based on (1) the eye tracker's own confidence level, (2) eye openness level, and (3) any missing data from either the left or right eye.
- Categorizing types of gaze activities (fixations and saccades) and calculation of the convergence of gaze rays: A simple velocity-based algorithm was implemented to classify fixations, and then the vergence – the intersection point between left and right gaze vectors – was calculated by seeking the average of the points of the nearest distance between the gaze vectors. Compared to the proprietary solution provided by Tobii, which identifies a "virtual eye" in the middle of the two eyes with a directional vector, we found that gaze calculated through convergence is only accurate up to 1.5 meter distance due to limitations of the equipment.
- Visualization: using the collected, processed, and classified data, we then visulaize the "points of regard" within the 3D scene as spheres, with their size representing the duration of a fixation. We also began preliminary explorations to visualize gaze data as saliency maps.
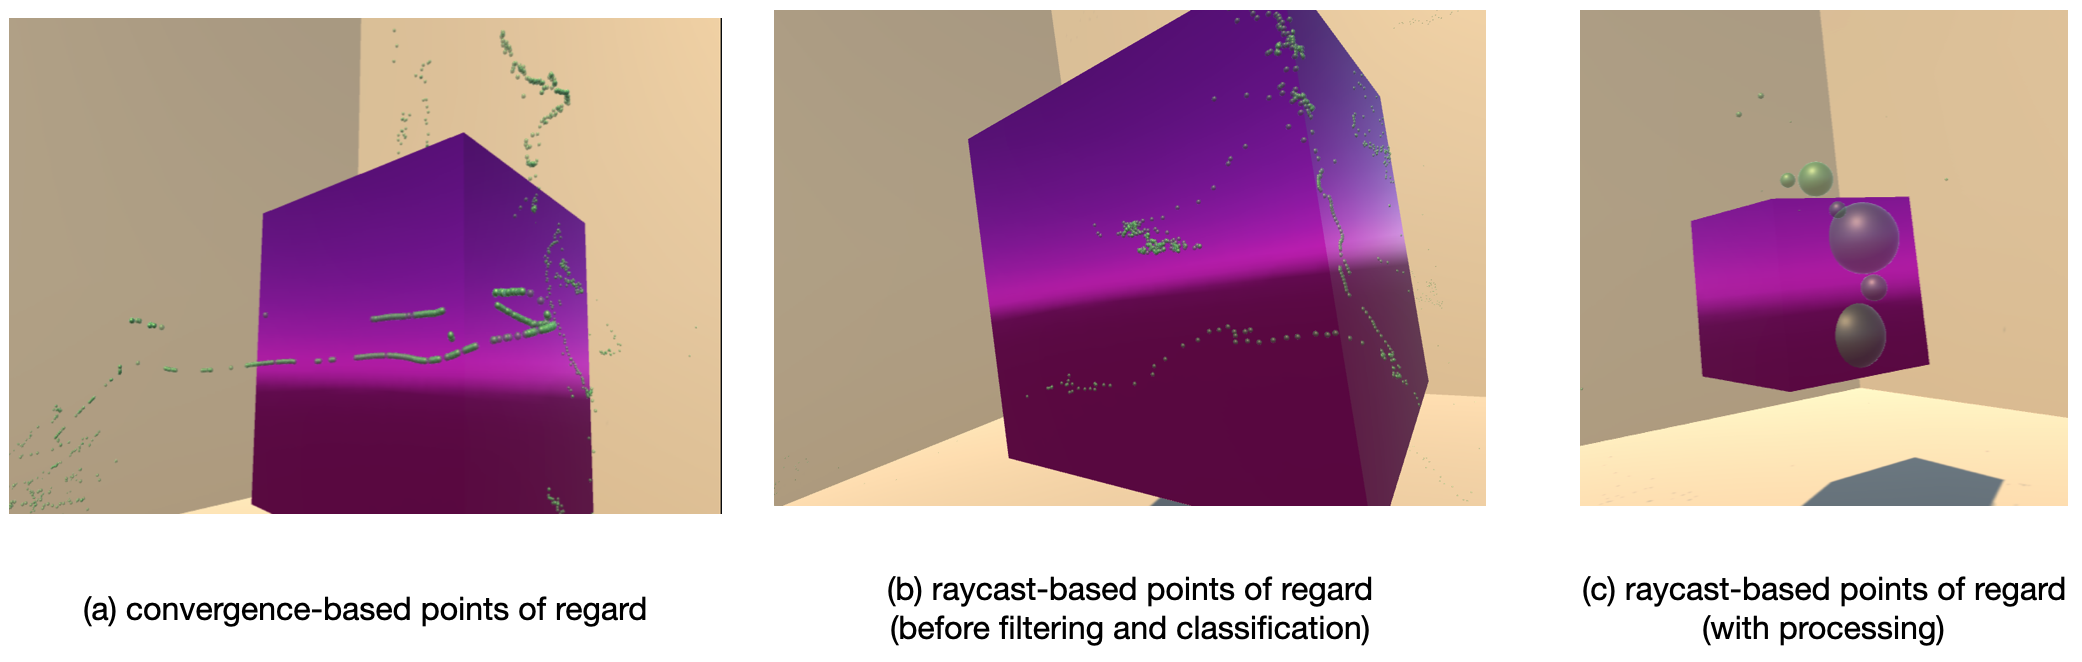
The figure features a scene of a cube in three configurations from the three variations of gaze processing techniques described in the caption. The first cube has granular gaze points mostly floating in the air around the cube. The second cube has granular gaze points falling on the cube and walls. The third aggregated gaze points of varying size around the cube.
An interface was designed to collect these steps as an integrated workflow to collect, filter, process, and visualize gaze data in complex 3D environments. The final results of the visualization in a simple scene can be seen in Figure 15. The workflow allows users to flexibly replace components (such as the fixation classification algorithm) to further evolve the workflow for different purposes or improve the quality of the data.
This is part of the internship project carried out by V. Gagliano and subsequently maintained by F. Robert. The internship manuscript can be found here: 27
Procedural generation of traffic intersection scenes in 3D environments for Virtual Reality
: we explore the procedural generation of static traffic intersections involving pedestrian crossings for studying user attention in dangerous navigation tasks. This mini-project involved four steps:
- Survey various categories of intersections and pedestrian crossing scenes: we set out from four fundamental shapes of crossings: (cross), (T-shaped), (a
90 turn), and (straight road). - Implement a constraint-based algorithm to generate road types with randomized traffic directions, crossing positions, and lights.
- Animate the scene with cars and timed light changes.
The output of this mini-project can be seen in Figure 16 comparing the output of three different street scene representations.
This is part of a semester project carried out by masters students A. Pepegna, A. Kozlova, M. Boufalah, L. Filippi and subsequently maintained by F. Robert.
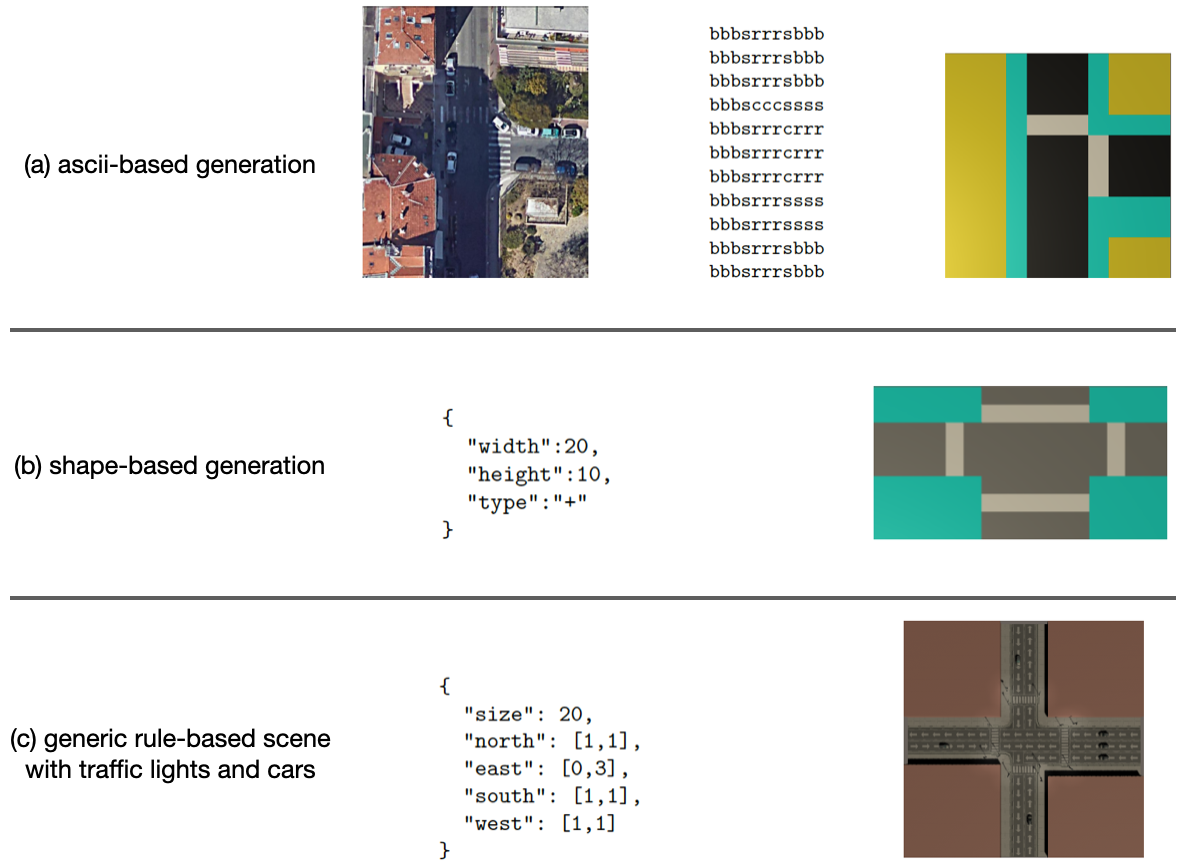
The top figure shows a naive ASCII based scene generator from a real scene. The second and third figures show a JSON syntax to generate roads of a certain shape, or depending on the number of lanes entering and exiting the interaction from each direction.
Other news and development on the project can be followed from official website.
7.2.2 Simulating Visibility and Reading Performance in Low Vision
Participants: Y-Z Xiong, Aurélie Calabrèse, Q. Lei, G.E. Legge.
1 Department of Psychology, University of Minnesota, Minneapolis, MN, United States2 Department of Psychology, Wichita State University, Wichita, KS, United States
Description: Low vision reduces text visibility and causes difficulties in reading. A valid low-vision simulation could be used to evaluate the accessibility of digital text for readers with low vision. We examined the validity of a digital simulation for replicating the text visibility and reading performance of low-vision individuals. In terms of methods, low-vision visibility was modeled with contrast sensitivity functions (CSFs) with parameters to represent reduced acuity and contrast sensitivity. Digital filtering incorporating these CSFs were applied to digital versions of the Lighthouse Letter Acuity Chart and the Pelli-Robson Contrast Sensitivity Chart. Reading performance (reading acuity, critical print size, and maximum reading speed) was assessed with filtered versions of the MNREAD reading acuity Chart. Thirty-six normally sighted young adults completed chart testing under normal and simulated low-vision conditions. Fifty-eight low-vision subjects (thirty with macular pathology and twenty-eight with non-macular pathology) and fifteen normally sighted older subjects completed chart testing with their habitual viewing. We hypothesized that the performance of the normally sighted young adults under simulated low-vision conditions would match the corresponding performance of actual low-vision subjects. Results show that when simulating low-vision conditions with visual acuity better than 1.50 logMAR (Snellen 20/630) and contrast sensitivity better than 0.15 log unit, the simulation adequately reduced the acuity and contrast sensitivity in normally sighted young subjects to the desired low-vision levels. When performing the MNREAD test with simulated low vision, the normally sighted young adults had faster maximum reading speed than both the Non-macular and Macular groups, by an average of 0.07 and 0.12 log word per minute, respectively. However, they adequately replicated the reading acuity as well as the critical print size, up to 2.00 logMAR of both low-vision groups. As a whole, this study shows that a low-vision simulation based on clinical measures of visual acuity and contrast sensitivity can provide good estimates of reading performance and the accessibility of digital text for a broad range of low-vision conditions.
This work was published in Frontiers in Neuroscience 14.
7.3 Diagnosis, rehabilitation and low vision aids
7.3.1 A new vessel-based method to estimate automatically the position of the non-functional fovea on altered retinography from maculopathies
Participants: Vincent Fournet, Aurelie Calabrèse, Séverine Dours, Frédéric Matonti, Eric Castet, Pierre Kornprobst.
1 Aix-Marseille Université (CNRS, Laboratoire de Psychologie Cognitive, Marseille, France)
2 Institut d’Education Sensoriel (IES) Arc-en-Ciel
3 Centre Monticelli Paradis d'Ophtalmologie
Context: This contribution is part of a larger initiative in the scope of ANR DEVISE. We aim at measuring and analyzing the 2D geometry of each patient's "visual field," notably the characteristics of his/her scotoma (e.g., shape, location w.r.t fovea, absolute vs. relative) and gaze fixation data. This work is based on data acquired from a Nidek MP3 micro-perimeter installed at Centre Monticelli Paradis d'Ophtalmologie. In 2021, the focus was on the estimation of the fovea position from perimetric images (see below) and on the development of a first graphical user interface to manipulate MP3 data.
Description: In the presence of maculopathies, due to structural changes in the macula region, the fovea is usually located in pathological fundus images using normative anatomical measures (NAM). This simple method relies on two conditions: that images are acquired under standard testing conditions (primary head position and central fixation) and that the optic disk is visible entirely on the image. However, these two conditions are not always met in the case of maculopathies, en particulier lors de taches de fixations. Here, we propose a new registration-based fovea localization (RBFL) approach (see Fig. 17). The spatial relationship between fovea location and vessel characteristics (density and direction) is learned from 840 annotated healthy fundus images and then used to predict the precise fovea location in new images. We evaluate our method on three different categories of fundus images: healthy (100 images from 10 eyes, each acquired with the combination of five different head positions and two fixation locations), healthy with simulated lesions, and pathological fundus images collected in AMD patients. Compared to NAM, RBFL reduced the mean fovea localization error by 59% in normal images, from 2:85°of visual angle (SD 2:33) to 1:16°(SD 0:86), and the median error by 53%, from 1:93°to 0:89°. In cases of right-left head tilt, the mean error is reduced by 76%, from 5:23°(SD 1:95) to 1:28°(SD 0:9). With simulated lesions of 400 deg, the proposed RBFL method still outperforms NAM with a 10% mean error decrease, from 2:85°(SD 2:33) to 2:54°(SD 1:9). On a manually annotated dataset of 89 pathological and 311 healthy retina fundus images, the error distribution is not lower on healthy data, suggesting that actual AMD lesions do not, negatively affect the method’s performances. The vascular structure provides enough information to precisely locate the fovea in fundus images in a way that is robust to head tilt, eccentric fixation location, missing vessels, and real macular lesions.
For more information: 18.
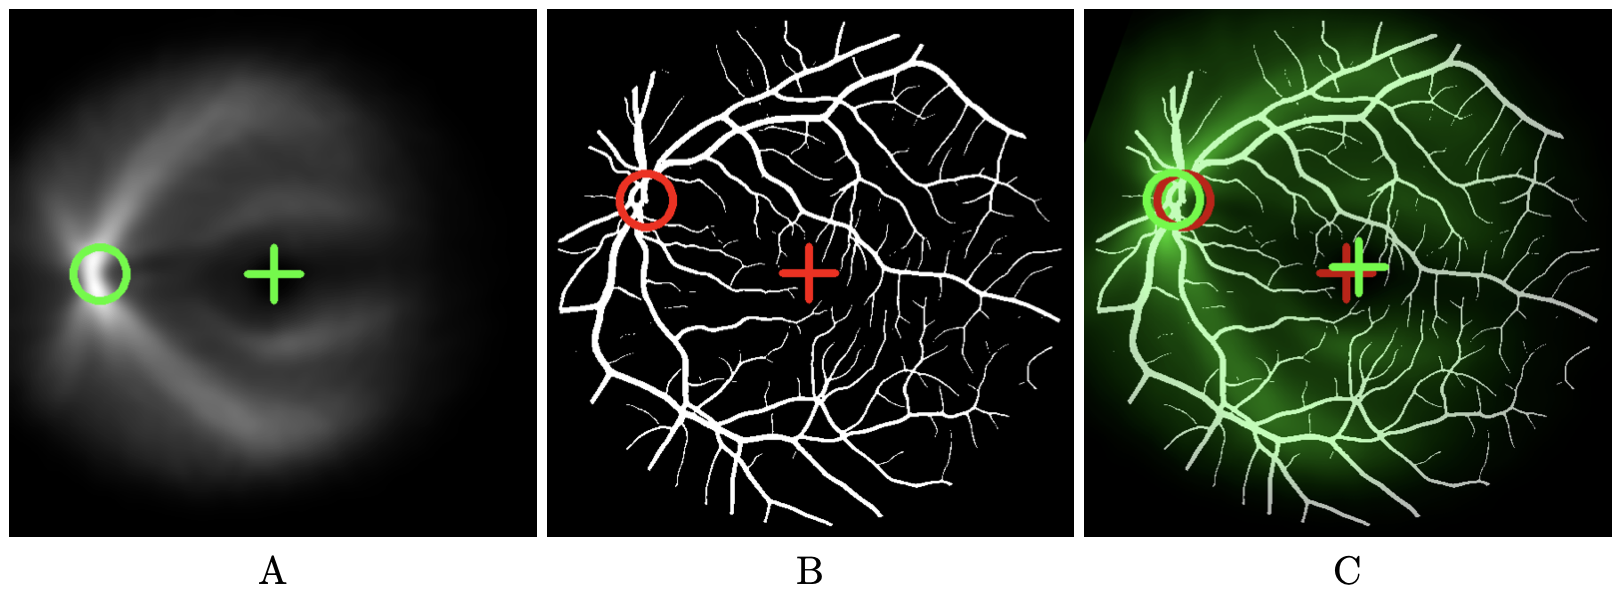
This figures illustrates how our method to detect the fovea works. It contains three images. The left image shows the vessel density map. This map is obtained by realigning and then averaging a set of vessel maps for which fovea and optic disk position are known. The are realigned based upon fixed positions of fovea and optic disk which are marked by a green cross and a green circle respectively. The middle image shows the vessel map where the fovea position is unknown. In our example, the ground truth is available allowing error estimates. Red cross indicates the true position of the fovea we are looking for. The right image shows the vessel density map in green-scale color superimposed on the vessels map after registration. The fovea position of the vessel density map after registration serves as an estimate for the fovea position. It is represented by a green cross. When ground truth is available (red cross), error can be estimated (distance between green and red crosses).
Illustration of the registration-based fovea localization method considering only vessel spatial distribution. (A) Vessel density map obtained by realigning and averaging a set of vessel maps, with the reference fovea and optic disk position marked by a cross and a circle respectively, (B) Vessel map in which the fovea has to be located. Here we assume that the ground truth is available allowing error estimates. Red cross indicates the true position of the fovea. (C) Vessel density map in green color superimposed on the vessels map after registration. The fovea position of the vessel density map (green cross) serves as an estimate for the fovea position. When ground truth is available (red cross), error can be estimated (distance between green and red crosses).
7.3.2 Pushing the limits of reading performance screening with Artificial Intelligence: Towards large-scale evaluation protocols for the visually impaired
Participants: Alexandre Bonlarron, Aurelie Calabrèse, Jean-Charles Régin, Pierre Kornprobst.
1 Université Côte d'Azur (France), I3S, Constraints and Application Lab
Context: Reading has become an essential clinical measure for judging the effectiveness of treatments, surgical procedures, or rehabilitation techniques 41. The MNREAD acuity chart 37 - a standardized reading test prominently used worldwide in clinical and research settings - serves as the foundation for this work. The major problem is to have sufficient standardized language material. We started to explore this problem in 2020, and this is now the focus of Alexandre Bonlarron's Ph.D., who started in October 2021.
Description: Our project is guided by one application goal, the automatic generation of text under constraints, a complex problem. We are not trying to write a story, but sentences that make sense and respect strict constraints. The problem we are trying to solve is dominated by several constraints (syntactic, semantic, and geometric). We believe we can model them mathematically in an optimization problem. This is why it seems judicious to us, at first, to concentrate on methods of the multi-valued decision diagrams (MDDs) type such as those developed by J.-C. Régin and which have already proved their worth in the automatic generation of musical extracts. In parallel, in 2021, we started to develop a new platform for reading performance screening (grant: ADT InriaRead) which we will use to validate experimentally the new sentences generated but also automatize and simplify diagnosis greatly.
7.3.3 Towards Accessible News Reading Design in Virtual Reality for Low Vision
Participants: Hui-Yin Wu, Aurélie Calabrèse, Pierre Kornprobst.
Description: Low-vision conditions resulting in partial loss of the visual field strongly affect patients' daily tasks and routines, and none more prominently than the ability to access text. Though vision aids such as magnifiers, digital screens, and text-to-speech devices can improve overall accessibility to text, news media, which is non-linear and has complex and volatile formatting, is still inaccessible, barring low-vision patients from easy access to essential news content. This work positions virtual reality as the next step towards accessible and enjoyable news reading. We review the current state of low-vision reading aids and conduct a hands-on study of eight reading applications in virtual reality to evaluate how accessibility design is currently implemented in existing products. From this we extract a number of design principles related to the usage of virtual reality for low-vision reading. We then present a framework that integrates the design principles resulting from our analysis and study, and implement a proof-of-concept for this framework using browser-based graphics to demonstrate the feasibility of our proposal with modern virtual reality technology (see Fig. 18).
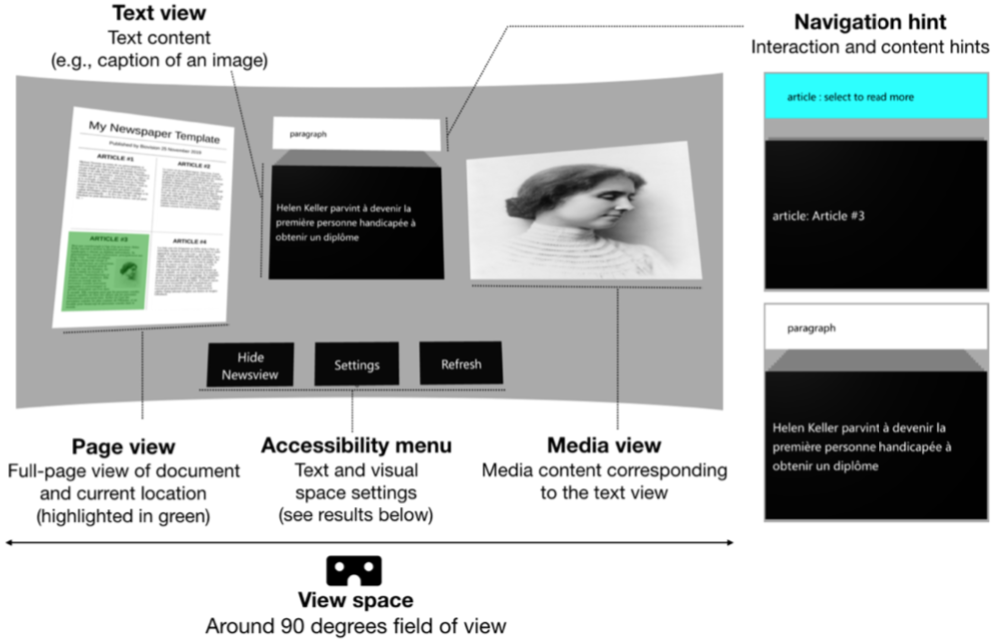
The figure shows our interface with has four main parts: the global news document on the left, the central text reading area, the visual media on the right, and the accessibility menu at the bottom. To the right, labels indicate the navigation hints above the text.
Application prototype: The global overview of the newspaper page is shown side- by-side with the enlarged text and images of the highlighted region. Navigation hints above the card show what type of content is displayed (e.g., photo, heading, paragraph) and whether the card can be selected (i.e., highlighted in light blue) to reveal further content. Text and images of the newspaper are purely for demonstrating a proof-of-concept.
Notably, through literature review and hands-on study of existing applications, we noted eight points of advantages, as elaborated in Table 1.
| Comfort | Users have no obligation to sit at a desk, bent over the text (e.g., with handheld magnifiers), nor fight with lighting conditions. |
| Mobility | Headsets can be used in various reading environments without additional cables or surfaces. |
| Visual field | The field of view of modern VR headsets is 90-110 |
| Multifunction | Modern VR headsets all come with web browsers, online capabilities, and downloadable applications. |
| Multimedia | Affords text, image, audio, video, and 3D content. |
| Interaction | Interaction methods can be customized, encompassing controller, voice, head movement, and gesture. |
| Immersion | Provides a private virtual space that is separate from the outside world offering privacy and freedom to personalise the space 42. |
| Affordability | Compatible with most modern smartphones, a Google Cardboard© costs as low as $15, and an Oculus Go© $200. |
In addition, we also identified six major points of low-vision accessibility design for VR reading platforms: (1) global and local navigation, (2) adjustable print and layout, (3) smart text contrasting, (4) accessibility menu, (5) hands-free control, and (6) image enhancement. These were also evaluated in eight existing applications (Table 2).
|
|
Device | Genre | Content | Accessibility | ||
| MZ | PS | AB | ||||
|
|
GVR,CB | books | app limited | |||
| Chimera | GVR | books | epub | • | ||
| [HTML]E5E4E2ComX VR | CB | comics | app limited | • | ||
| ImmersionVR Reader | GVR,GO | books | epubs & pdf | • | • | |
| [HTML]E5E4E2Madefire Comics | GVR,CB,DD | comics | app limited | • | ||
| Sphere Toon | VI | comics | app limited | • | ||
| [HTML]E5E4E2Virtual Book Viewer | GO | books | pdfs & images | • | ||
| Vivepaper | V,CB | books | app limited | |||
|
|
Finally, for preparation of user evaluations, we collected a set of 90 articles from the French Vikipedia site (a version of Wikipedia adapted to the reading level of children), and using ParseTree verified that they have the same linguistic properties as the iRest test for low-vision reading. 43.
The reading platform is planned for release as an open toolbox using browser-based graphics (WebGL) that implements the design principles from our study. A proof-of-concept is created using this toolbox to demonstrate the feasibility of our proposal with modern virtual reality technology.
This work was published in Multimedia Tools and Applications 9. The software produced for this work is licenced under CeCILL libre number IDDN FR.001.110012.000.S.P.2021.000.31235.
7.3.4 Multilayered Analysis of Newspaper Structure and Design
Participants: Hui-Yin Wu, Pierre Kornprobst.
Context: The development of accessible and enjoyable news reading (see Sec. 7.3.3) requires an understanding of newspaper layout so that the information can be presented in a more efficient way to patients. In 2019, we proposed a first approche to segment and classify the different components of a newspaper page (see 44 and information below). In 2021, we started to revisit this work, which will be continued in 2022.
Description: Understanding newspaper structure and design remains a challenging task due to the complex composition of pages with many visual and textual elements. Current approaches have focused on simple design types and analyzed only broad classes for the components in a page. In this paper, we propose an approach to obtain a comprehensive understanding of a newspaper page through a multi-layered analysis of structure and design. Taking images of newspaper front pages as input, our approach uses a combination of computer vision techniques to segment newspapers with complex layouts into meaningful blocks of varying degrees of granularity and convolutional neural network (CNN) to classify each block. The final output presents a visualization of the various layers of design elements present in the newspaper (see Fig. 19). Compared to previous approaches, our method introduces a much larger set of design-related labels (23 labels against less than 10 before), resulting in a very fine description of the pages, with high accuracy (83%). As a whole, this automated analysis would have potential applications such as cross-medium content adaptation, digital archiving, and UX design.
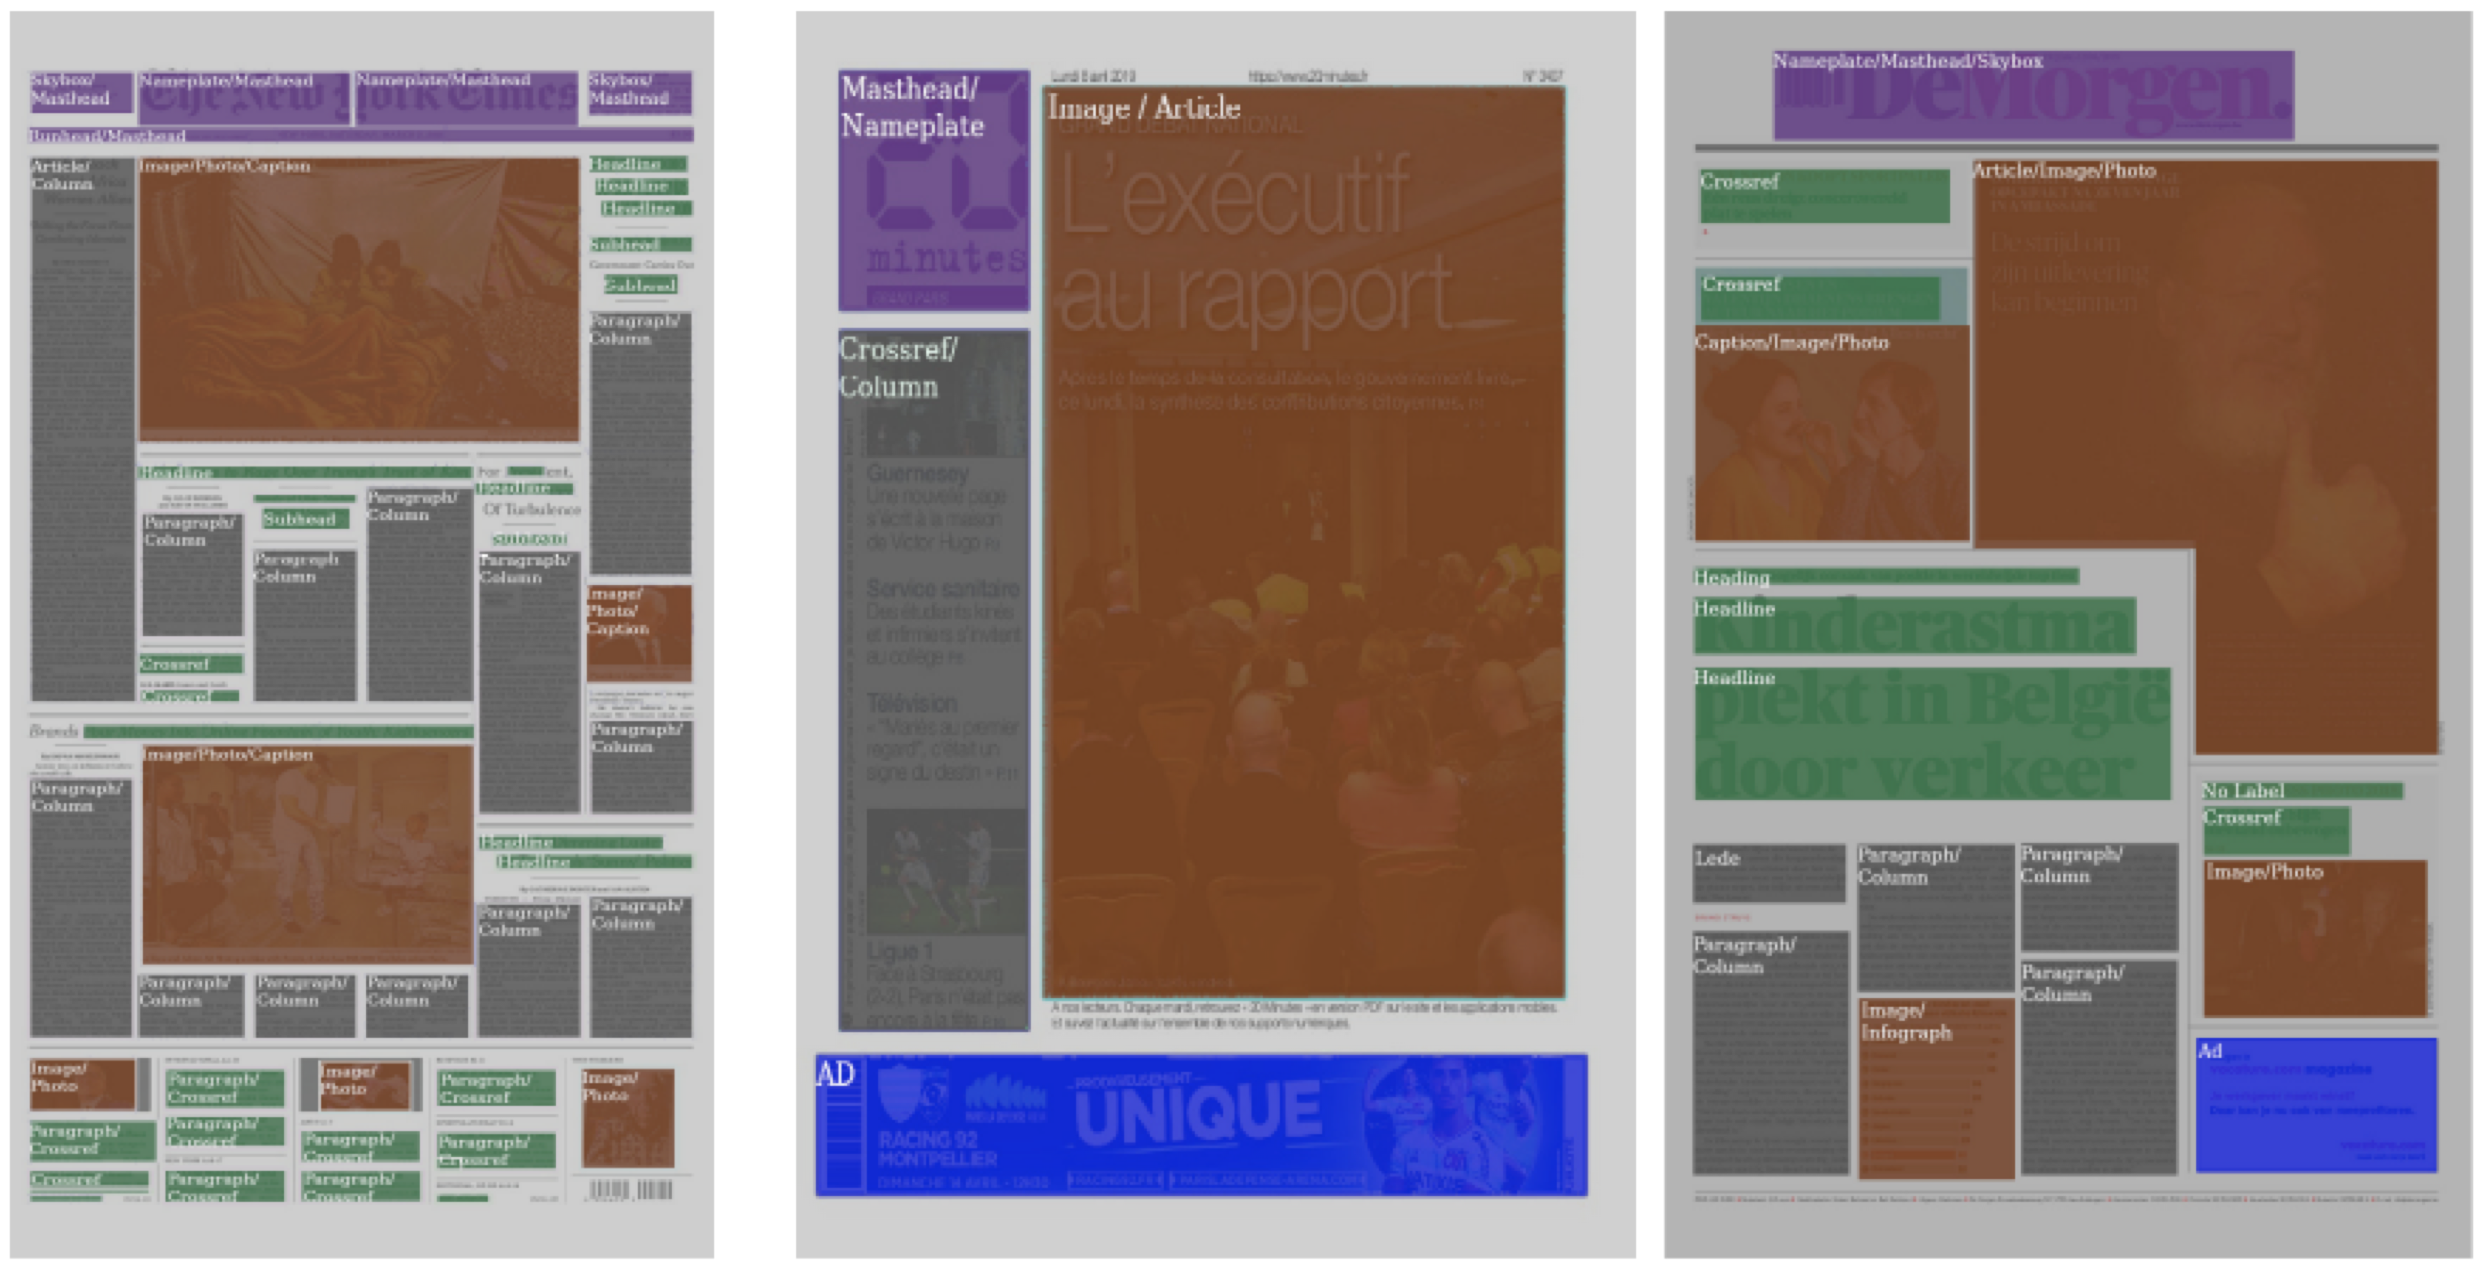
This figure shows the classification results on three different newspapers in our test set. Colors indicate primary categories as masthead elements (purple), text column (gray), ads (blue), images (brown) and minor text elements (green).
Visualization of the classification results on three different newspapers in our test set. Colors indicate primary categories as masthead elements (purple), text column (gray), ads (blue), images (brown) and minor text elements (green). Original images copyright of (from left to right) New York Times, 20 Minutes, and DeMorgan, courtesy of Newseum.
7.3.5 Improving digital news reading experience: A computational design approach targeting reading comfort and accessibility
Participants: Sebastian Gallardo, Pierre Kornprobst, Dorian Mazauric.
1 Université Côte d'Azur (France), Inria, ABS Team
Description: The digital era transforms the newspaper industry, offering new digital user experiences for all readers. However, to be successful, newspaper designers stand before a tricky design challenge: translating the design and aesthetics from the printed edition (which remains a reference for many readers) and the functionalities from the online edition (continuous updates, responsiveness) to create the e-newspaper of the future, making a synthesis based on usability, reading comfort, engagement. In this spirit, our project aims to develop a novel inclusive digital news reading experience that will benefit all readers: you, me, and low vision people for whom newspapers are a way to be part of a well-evolved society. To do so, we foresee an approach where a layout can be easily modified and optimized according to different criteria related to, e.g., aesthetics (e.g., balance, alignment, regularity) and visual accessibility (e.g., critical print size). In 2021, we started to explore this problem with two main goals: (i) investigate new computational measures to quantify the aesthetics of a newspaper page and (ii) formalize the generation of layout as a packing problem, which we solved using two types of methods: a branch and bound type method and genetic algorithms. Preliminary results obtained on simple layouts are encouraging.
8 Bilateral contracts and grants with industry
8.1 Bilateral contracts with industry
Helping visually impaired employees to follow presentations in the company: Towards a mixed reality solution
Participants: Riham Nehmeh, Carlos Zubiaga, Julia-Elizabeth Luna, Arnaud Mas, Alain Schmid, Christophe Hugon, Pierre Kornprobst.
1 InriaTech, UCA Inria, France
2 EDF, R&D PERICLES – Groupe Réalité Virtuelle et Visualisation Scientifique, France
3 EDF, Lab Paris Saclay, Département SINETICS, France
4 R&DoM
Duration: 3 months
Objective: The objective of the work is to develop a proof-of-concept (PoC) targeting a precise use-case scenario defined by EDF (contract with InriaTech, supervised by Pierre Kornprobst). The use-case is one of an employee with visual impairment willing to follow a presentation. The idea of the PoC is a vision-aid system based on a mixed-reality solution. This work aims at (1) estimating the feasibility and interest of such kind of solution and (2) identifying research questions that could be jointly addressed in a future partnership.
APP Deposit: SlidesWatchAssistant IDDN.FR.001.080024.000.S.P.2020.000.31235)
9 Partnerships and cooperations
9.1 International initiatives
Participants: Bruno Cessac.
9.1.1 Associate Teams in the framework of an Inria International Lab or in the framework of an Inria International Program
MAGMA
-
Title:
Modelling And understandinG Motion Anticipation in the retina
-
Duration:
2019 – 2022
-
Coordinator:
Bruno Cessac, Maria-José Escobar (mariajose.escobar@usm.cl)
-
Partners:
- Advanced Center for Electrical and Electronic Engineering (AC3E), Universidad Técnica Federico Santa María Valparaiso (Chile)
- Centro Interdisciplinario de Neurociencia de Valparaíso (CINV)
-
Inria contact:
Bruno Cessac
-
Summary:
Motion processing represents a fundamental visual computation ruling many visuomotor features such as motion anticipation which compensates the transmission delays between retina and cortex, and is fundamental for survival. We want to strengthen an existing collaborative network between the Universidad de Valparaiso in Chile and the Biovision team, gathering together skills related with physiological recording in the retina, data analysis numerical platforms and theoretical tools to implement functional and biophysical models aiming at understanding the mechanisms underlying anticipatory response and the predictive coding observed in the mammalian retina, with a special emphasis on the role of lateral connectivity (amacrine cells and gap junctions).
9.2 International research visitors
9.2.1 Visits of international scientists
Rodrigo Cofré and Ignacio Ampuero (CIMFAV) visited us in November 2021, in the context of the associated team MAGMA.
9.3 National initiatives
Participants: Bruno Cessac, Pierre Kornprobst.
9.3.1 ANR
ShootingStar
- Title: Processing of naturalistic motion in early vision
-
Programme:
ANR
-
Duration:
April 2021 - March 2025
-
Coordinator:
Mark WEXLER (CNRS‐INCC),
-
Partners:
- Institut de Neurosciences de la Timone (CNRS and Aix-Marseille Université, France)
- Institut de la Vision (IdV), Paris, France
- Unité de Neurosciences Information et Complexité, Gif sur Yvette, France
- Laboratoire Psychologie de la Perception - UMR 8242, Paris
-
Inria contact:
Bruno Cessac
-
Summary:
The natural visual environments in which we have evolved have shaped and constrained the neural mechanisms of vision. Rapid progress has been made in recent years in understanding how the retina, thalamus, and visual cortex are specifically adapted to processing natural scenes. Over the past several years it has, in particular, become clear that cortical and retinal responses to dynamic visual stimuli are themselves dynamic. For example, the response in the primary visual cortex to a sudden onset is not a static activation, but rather a propagating wave. Probably the most common motions in the retina are image shifts due to our own eye movements: in free viewing in humans, ocular saccades occur about three times every second, shifting the retinal image at speeds of 100-500 degrees of visual angle per second. How these very fast shifts are suppressed, leading to clear, accurate, and stable representations of the visual scene, is a fundamental unsolved problem in visual neuroscience known as saccadic suppression. The new Agence Nationale de la Recherche (ANR) project “ShootingStar” aims at studying the unexplored neuroscience and psychophysics of the visual perception of fast (over 100 deg/s) motion, and incorporating these results into models of the early visual system.
DEVISE
-
Title:
From novel rehabilitation protocols to visual aid systems for low vision people through Virtual Reality
-
Programme:
ANR
-
Duration:
2021–2025
-
Coordinator:
Eric Castet (Laboratoire de Psychologie Cognitive, Marseille)
-
Partners:
- CNRS/Aix Marseille University – AMU, Cognitive Psychology Laboratory
- AMU, Mediterranean Virtual Reality Center
-
Inria contact:
Pierre Kornprobst
-
Summary:
The ANR DEVISE (Developing Eccentric Viewing in Immersive Simulated Environments) aims to develop in a Virtual Reality headset new functional rehabilitation techniques for visually impaired people. A strong point of these techniques will be the personalization of their parameters according to each patient’s pathology, and they will eventually be based on serious games whose practice will increase the sensory-motor capacities that are deficient in these patients.
10 Dissemination
Participants: Bruno Cessac, Aurélie Calabrèse, Pierre Kornprobst, Hui-Yin Wu, Alexandre Bonlarron, Johanna Delachambre, Simone Ebert, Jérome Emonet, Evgenia Kartsaki, Florent Robert.
10.1 Promoting scientific activities
10.1.1 Scientific events: organisation
General chair, scientific chair
- B. Cessac organized the “mini-cours” of the Neuromod institute, (see webpage for dates, topics and presentations).
- B. Cessac was the organizer of the conference "The dynamics of vision", as part of the DynamicsDays
- B. Cessac was chairman in the conference Mouvements des yeux et activités cérébrales held in December 2021.
10.1.2 Scientific events: selection
Member of the conference program committees
- A. Calabrèse has been elected as a member of the ARVO Conference Program Committee in May 2021. For three years, she will participate in the content selection of this top international event of the field of low vision research and ophthalmology (+11,000 attendees).
- A. Calabrèse was invited to serve in both the Program Committee and the Organizing Committee of the READI workshop (Tools and Resources for REAding DIfficulties) which will take place during the LREC 2022 conference in June 2022 in Marseille.
- H.-Y. Wu was a member of the program committee for the International Conference on Interactive Digital Storytelling (ICIDS 2021) and Symposium on Virtual Reality (SVR 2021).
10.1.3 Journal
Member of the editorial boards
- P. Kornprobst has been associate editor for the Computer Vision and Image Understanding Journal (CVIU) since Jul 2016.
Reviewer - reviewing activities
- H.-Y. Wu was a peer-reviewer for Multimedia Tools and Applications (IF: 2.75) and Computers & Graphics (IF: 1.93).
10.1.4 Invited talks
- A. Calabrèse was invited to give a talk at the 20-21 Vision Health Research Network Virtual meetings, Montréal, Canada in January 2021.
- B. Cessac was invited for a talk at the NeuroMath Lab, Sao Paulo, Brasil, in June 2021. Link to the slides.
- B. Cessac was invited for a talk at the DynamicsDays in August 2021.
- B. Cessac was invited for a talk at the Congrès de la Société de Physiologie Nice 2021 in September 2021.
- B. Cessac was invited for a talk at the Courant Institute, New York, USA, in December 2O21. Link to the slides.
- H.-Y. Wu gave an In'Tro talk on her research to members of Inria (Sophia-Antipolis and Montpellier) in May 2021.
10.1.5 Research administration
- B. Cessac is an invited member of the Comité de Suivi et de Pilotage of the EUR Spectrum (representative of the Neuromod Institute).
- B. Cessac is a member of the board and a member of the Scientific Council of the Institute of Neurosciences and Neuromod Modeling since 2018.
- P. Kornprobst has been an elected member of the Academic Council of UCA (Conseil d'Administration) since Dec. 2019.
10.2 Teaching - Supervision - Juries
10.2.1 Teaching
- Master 1: B. Cessac (24 hours, cours) Introduction to Modelling in Neuroscience, master Mod4NeuCog, UCA, France.
- Master 1: Simone Ebert (15 hours, TD), Introduction to Modelling in Neuroscience, master Mod4NeuCog, UCA, France.
- License 2: J. Emonet (22 hours), Introduction à l'informatique, License SV, UCA, France.
- License 3: J. Emonet (16 hours), Programmation python et environnement linux, License BIM, UCA, France.
- License 3: J. Emonet (20 hours), Biostatistiques, License SV, UCA, France.
- Master 2: H.-Y. Wu (with M. Winckler), Techniques d'interaction et multimodalité, 32 hours, Master en Informatique (SI5) mineure IHM, Polytech Nice Sophia, UCA, France
- École Préparatoire 2: H.-Y. Wu (with F. Baude), Programmation objet-orientée (Java), 24 hours, Polytech Nice Sophia, UCA, France
10.2.2 Supervision
- PhD in progress: Alexandre Bonlarron. "Pushing the Limits of Reading Performance Screening with Artificial Intelligence: Towards Large-Scale Evaluation Protocols for the Visually Impaired", Started in October 2021. Co-supervised by A. Calabrèse and J.-C. Régin.
- PhD in progress: Simone Ebert. “Dynamical Synapses in the Retinal Network”, Started in October 2020. Supervised by B. Cessac. Funding UCA Institut Neuromod.
- PhD in progress: Jérome Emonet, "A Computational Model of the Retino-Thalamo-Cortical Pathway", Started in October 2021. Supervised by B. Cessac in collaboration with A. Destexhe. Funding ANR ShootingStar.
- PhD in progress: Evgenia Kartsaki. “How Specific Classes of Retinal Cells Contribute to Vision: A Computational Model”, Started in October 2017- defence in March 2022. Co-supervised by B. Cessac and E. Sernagor, (Newcastle).
- PhD in progress: Florent Robert. "Analyzing and Understanding Embodied Interactions in Extended Reality Systems", Started in October 2021. Co-supervised by M. Winckler, H.-Y. Wu, and L. Sassatelli.
- Apprenticeship: Johanna Delachambre. Engineering Projects in Virtual Reality for ANR DEVISE, M2 UCA MIAGE. Started in November 2020. Co-supervised by P. Kornprobst and H.-Y. Wu.
- Internships:
- B. Cessac (with A. Destexhe), co-supervision of Jérome Emonet, Master 2, Sciences de la Vie on "A computational model of the retino-cortical pathway". (January-June 2021).
- P. Kornprobst (with M. Marti), co-supervision of Eddy Abada on "La Forêt de Brocéliande : Conception d’un jeu adapté aux patients souffrant de dégénérescence maculaire liée à l’âge", Master 1, Mention Humanités et Industries Créatives Parcours Management, Jeux Vidéo, Image et Créativité (March - September 2021).
- P. Kornprobst (with A. Calabrèse), co-supervision of Vincent Fournet on "Automatisation de l’analyse d’images rétiniennes pour quantifier les zones fonctionnelles du champ visuel d’un patient malvoyant", Ecole Polytechnique, 3rd year (April - August 2021). This internship received the prize for best research internship by the Fondation de l'Ecole Polytechnique.
- P. Kornprobst (with D. Mazauric), co-supervision of Sebastian Gallardo on "Optimizing newspaper layout with design-preserving magnification: Study of a new combinatorial/geometric packing problem", Universidad Técnica Federico Santa María, Valparaíso, Chile (March - September 2021).
- P. Kornprobst (with A. Calabrèse and J.-C. Régin), co-supervised Alexandre Bonlarron on "Automatic production of constrained text from a corpus", M2 in computer science in Université Côte d'Azur (March - September 2021).
- A. Calabrèse (with E. Castet and P. Kornprobst), co-supervised Séverine Dours on "Examens de fixation et acquisitions de photos de la rétine pour le développement d’un logiciel de traitement d’images" (March - May 2021).
- H.-Y. Wu (with L. Sassatelli), co-supervision of Yoldoz Tabei (M1 in ENSTA) on lower body pose detection in film data (May - August 2021).
- H.-Y. Wu (with M. Winckler and L. Sassatelli), co-supervision of Florent Robert (Polytech Nice Sophia, UCA, SI5 mineur IHM) on creating a virtual reality serious game using a domain specific language for interactive 3D environments, M2 in Université Côte d'Azur (March - September 2021).
- H.-Y. Wu supervised Vivien Gagliano (M1 in ENSIIE) on the analysis and visualization of eye tracking data in virtual reality (June - August 2021).
- Projet fin d'études (PFE) / Travail d'Étude et de Recherche (TER): student end-of-study projects with roughly 1 month period of full time work, finishing with a project report and defense presentation:
- P. Kornprobst (with A. Calabrèse) co-supervised students from Polytech Nice Sophia, UCA, Nicolas Lanoux (spécialité informatique, option Web et Intelligence Artificielle), Mateo Borlat et Julien Kaplan (spécialité informatique, option Interaction Homme Machine) on "Automatisation de l’analyse d’images rétiniennes pour quantifier les zones fonctionnelles du champ visuel d’un patient malvoyant".
- H.-Y. Wu (with P. Kornprobst), co-supervision of Meryem Boufalah (M2 Informatique et Interaction, Université Côte d'Azur) on "Layout segmentation and classification of visual style elements in newspapers"
- H.-Y. Wu (with L. Sassatelli), co-supervision of Clément Monestier, Julien Raige-Verger, and Loïc Rizzo (Polytech Nice Sophia, UCA, SI5 mineur AL / DS) on "Designing a tool for annotation and visualization of multimodal film datasets"
- H.-Y. Wu (with M. Winckler), co-supervision of Ryana Karaki, Martin Bouteiller, Vivian Losciale and Frederic Metereau (Polytech Nice Sophia, UCA, SI5 mineur IHM) on "Creating semantic representations of the real world in augmented reality"
- H.-Y. Wu, supervision of Alessandro Pepegna, Anastasiia Kozlova, Meryem Boufalah, Loïc Filippi (M1 Informatique, Université Côte d'Azur) on "Procedural generation of traffic intersection scenes in 3D environments for Virtual Reality"
- H.-Y. Wu (with L. Sassatelli), co-supervision of Rémi Yacoub, Nabil Yacoub, and Chaeyeon Shim (M1 Informatique, Université Côte d'Azur) on "Designing a tool for annotation and visualization of multimodal film datasets"
10.2.3 Juries
- B. Cessac has been the president of the jury of the PhD defence of Halgurd Taher entitled "Next generation neural mass models: working memory, all-brain modelling and multi-timescale phenomena ".
- B. Cessac has been a member of the Comité de Suivi Individuel (CSI) of Halgurd Taher, PhD candidate at Inria, MathNeuro project team, working on "Next generation neural mass models: working memory, all-brain modelling and multi-timescale phenomena" and co-supervised by S. Olmi.
- P. Kornprobst has been the president of the jury of the HDR defence of Antitza Dantcheva (STARS team) entitled "Computer vision for deciphering and generating faces" (Sept. 2021).
- P. Kornprobst has been a member of the Comité de Suivi Individuel (CSI) of Abid Ali, PhD candidate at Inria, Stars project-team, working on "Action detection for improving the diagnosis of autism" and co-supervised by François Brémond and Susanne Thummler.
- P. Kornprobst has been a member of the Comité de Suivi Individuel (CSI) of Rui Dai, PhD candidate at Inria, Stars project-team, working on "Action Detection for Untrimmed Videos based on Deep Neural Networks" and supervised by François Brémond.
- H.-Y. Wu was an invited member on the PhD committee of Miguel Romero, PhD candidate at I3S, SIS team, titled "Streaming Virtual Reality: Learning for Attentional Models and Network Optimization", from Université Côte d'Azur, France.
10.2.4 Articles and contents
- H.-Y. Wu and J. Delachambre (with L. Sassatelli and M. Winckler) published the book chapter "Through the Eyes of Women in Engineering" in Texts of Discomfort16 as part of a virtual reality application we created to raise public awareness towards issues of gender equality in engineering sciences.
10.3 Popularization
10.3.1 Interventions
- A. Calabrèse gave a Café In Presentation about her research to members of Inria (Sophia-Antipolis and Montpellier) in September 2021. Link to the video
- H.-Y. Wu participated in the half-day "Chiche!" media training workshop on scientific communication for outreach in high school classrooms.
11 Scientific production
11.1 Major publications
- 1 articleLinear response for spiking neuronal networks with unbounded memory.Entropy232L'institution a financé les frais de publication pour que cet article soit en libre accèsFebruary 2021, 155
- 2 articleMicrosaccades enable efficient synchrony-based coding in the retina: a simulation study.Scientific Reports624086April 2016
- 3 articleA biophysical model explains the spontaneous bursting behavior in the developing retina.Scientific Reports91December 2019, 1-23
- 4 articleBio-Inspired Computer Vision: Towards a Synergistic Approach of Artificial and Biological Vision.Computer Vision and Image Understanding (CVIU)April 2016
- 5 articleReading Speed as an Objective Measure of Improvement Following Vitrectomy for Symptomatic Vitreous Opacities.Ophthalmic Surgery, Lasers and Imaging RetinaAugust 2020
- 6 inproceedingsText Simplification to Help Individuals With Low Vision Read More Fluently.LREC 2020 - Language Resources and Evaluation ConferenceMarseille, FranceMay 2020, 11 - 16
- 7 articleThe inhibitory effect of word neighborhood size when reading with central field loss is modulated by word predictability and reading proficiency.Scientific ReportsDecember 2020
- 8 articleOn the potential role of lateral connectivity in retinal anticipation.Journal of Mathematical Neuroscience11January 2021
- 9 articleTowards Accessible News Reading Design in Virtual Reality for Low Vision.Multimedia Tools and ApplicationsMay 2021
11.2 Publications of the year
International journals
International peer-reviewed conferences
Scientific book chapters
Reports & preprints
Other scientific publications
11.3 Cited publications
- 28 mastersthesisSimulating the cortical activity evoked by artificial retinal implants.MA ThesisENSEA-InriaAugust 2019
- 29 articleOptogenetic approaches to retinal prosthesis.Visual Neuroscience314-5August 2014, 345–354
- 30 articleCharacterizing functional complaints in patients seeking outpatient low-vision services in the United States.Ophthalmology1218Aug 2014, 1655-62
- 31 articleClustering of Eye Fixations: A New Oculomotor Determinant of Reading Speed in Maculopathy.Invest Ophthalmol Vis Sci577Jun 2016, 3192-202
- 32 articleEye movements and reading speed in macular disease: the shrinking perceptual span hypothesis requires and is supported by a mediation analysis.Invest Ophthalmol Vis Sci556Jun 2014, 3638-45
- 33 unpublishedThe non linear dynamics of retinal waves.December 2021, working paper or preprint
- 34 bookWhere the action is: the foundations of embodied interaction.USAMIT press2004
- 35 articleMeclofenamic acid improves the signal to noise ratio for visual responses produced by ectopic expression of human rod opsin.Molecular vision232017, 334-345
- 36 articleDoes print size matter for reading? A review of findings from vision science and typography.Journal of Vision11508 2011
- 37 articleA new reading-acuity chart for normal and low vision.Ophthalmic and Visual Optics/Noninvasive Assessment of the Visual System Technical Digest, (Optical Society of America, Washington, DC., 1993.)31993, 232--235
- 38 articleA biophysical model explains the spontaneous bursting behavior in the developing retina.Scientific Reports91December 2019, 1-23
- 39 techreportLarge visual neuron assemblies receptive fields estimation using a super-resolution approach.RR-9383Inria - Sophia antipolisDecember 2020
- 40 articleProbing the functional impact of sub-retinal prosthesis.eLife5e126872016
- 41 articleReading Speed as an Objective Measure of Improvement Following Vitrectomy for Symptomatic Vitreous Opacities.Ophthalmic Surg Lasers Imaging Retina518Aug 2020, 456-466
- 42 inproceedingsHow People with Low Vision Access Computing Devices: Understanding Challenges and Opportunities.Proceedings of the 18th International ACM SIGACCESS Conference on Computers and AccessibilityASSETS '16New York, NY, USAReno, Nevada, USAACM2016, 171--180
- 43 articleStandardized assessment of reading performance: the New International Reading Speed Texts IReST.Investigative Ophthalmology & Visual Science53Aug 2012, 5452--5461
- 44 techreportMultilayered Analysis of Newspaper Structure and Design.RR-9281UCA, InriaJuly 2019
- 45 articleThinking Like a Director: Film Editing Patterns for Virtual Cinematographic Storytelling.ACM Transactions on Multimedia Computing, Communications and Applications1442018, 1-23