
Keywords
Computer Science and Digital Science
- A3.1.7. Open data
- A3.1.10. Heterogeneous data
- A3.1.11. Structured data
- A3.2.4. Semantic Web
- A3.2.5. Ontologies
- A3.2.6. Linked data
- A5.1. Human-Computer Interaction
- A5.1.1. Engineering of interactive systems
- A5.1.2. Evaluation of interactive systems
- A5.1.5. Body-based interfaces
- A5.1.6. Tangible interfaces
- A5.1.9. User and perceptual studies
- A5.2. Data visualization
- A5.5.4. Animation
- A5.6.1. Virtual reality
- A5.6.2. Augmented reality
Other Research Topics and Application Domains
- B3.1. Sustainable development
- B3.3. Geosciences
- B3.5. Agronomy
- B5.9. Industrial maintenance
- B9.2. Art
- B9.5.3. Physics
- B9.5.6. Data science
- B9.6.7. Geography
- B9.7.2. Open data
- B9.11. Risk management
1 Team members, visitors, external collaborators
Research Scientists
- Emmanuel Pietriga [Team leader, INRIA, Senior Researcher, HDR]
- Caroline Appert [CNRS, Senior Researcher, HDR]
- Olivier Chapuis [CNRS, Researcher]
- Vanessa Pena Araya [INRIA, Researcher]
Faculty Member
- Anastasia Bezerianos [UNIV PARIS SACLAY, Professor, HDR]
PhD Students
- Théo Bouganim [Inria, from Oct 2022, Co-advised with Ioana Manolescu, EPC Cedar]
- Vincent Cavez [INRIA]
- Mehdi Chakhchoukh [UNIV PARIS SACLAY]
- Gaëlle Clavelin [Telecom ParisTech, from Dec 2022, co-advised with Eric Lecolinet, Telecom ParisTech]
- Emmanuel Courtoux [UNIV PARIS SACLAY]
- Camille Dupré [BERGER-LEVRAULT, CIFRE, from Sep 2022]
- Raphaël James [UNIV PARIS SACLAY, ATER]
Technical Staff
- Ludovic David [Inria, Engineer, from Dec 2022]
- Rim Hajri [Inria, Engineer, until Aug 2022]
- Dylan Lebout [Inria, Engineer, until Oct 2022]
Interns and Apprentices
- Julien Berry [Université Paris-Saclay, Intern, from Jun 2022 until Aug 2022]
- Sophie Chen [Université Paris-Saclay, Intern, from Mar 2022 until Aug 2022, SED engineer]
- Camille Dupré [UNIV PARIS SACLAY, from Mar 2022 until Aug 2022]
- Johann Equilbec [Université Paris-Saclay, Intern, from Mar 2022 until Aug 2022]
- Xiang Wei [LISN, from Mar 2022 until Aug 2022]
Administrative Assistant
- Katia Evrat [INRIA]
2 Overall objectives
In an increasing number of domains, computer users are faced with large datasets, that are often interlinked and organized according to elaborate structures thanks to new data models such as those that are arising with the development of, e.g., the Web of Data. Rather than seeing the inherent complexity of those data models as a hindrance, we aim at leveraging it to design new interactive systems that can better assist users in their data understanding and processing tasks.
These “Data-centric Interactive Systems” aim at providing users with the right information at the right time, presenting it in the most meaningful manner, and letting users efficiently manipulate, edit and share these data with others. This entails minimizing the effort required to retrieve and relate data from relevant sources; displaying data using visual presentation techniques that match the data's characteristics and the users' tasks; and providing users with means of interacting with the data that effectively support their train of thought.
Our approach is based on the idea of bringing the fields of Web data management 23 and Human-computer interaction 43, 66 closer together, based on the strong belief that they have the potential to cross-fertilize one another. User interface design is essential to the management and understanding of large, heterogeneous and interlinked datasets. Interlinked datasets enriched with even a small amount of semantics have the potential to help create interfaces that let users analyze and manipulate data in a more efficient manner by providing them with, e.g., more relevant query results and giving them efficient means to navigate and relate those results. Our ultimate, long-term goal is to design interactive systems that make it as straightforward to manipulate large webs of data as spreadsheets do for tabular data.
3 Research program
3.1 Introduction
Our ability to acquire or generate, store, process, interlink and query data has increased spectacularly over the last few years. The corresponding advances are commonly grouped under the umbrella of so called Big Data. Even if the latter has become a buzzword, these advances are real, and they are having a profound impact in domains as varied as scientific research, commerce, social media, industrial processes or e-government. Yet, looking ahead, technologies related to what we now call the Web of Data (a.k.a the Semantic Web) have the potential to create an even larger revolution in data-driven activities, by making information accessible to machines as semi-structured data 22 that eventually becomes actionable knowledge. Indeed, novel Web data models considerably ease the interlinking of semi-structured data originating from multiple independent sources. They make it possible to associate machine-processable semantics with the data. This in turn means that heterogeneous systems can exchange data, infer new data using reasoning engines, and that software agents can cross data sources, resolving ambiguities and conflicts between them 64. Datasets are becoming very rich and very large. They are gradually being made even larger and more heterogeneous, but also much more useful, by interlinking them, as exemplified by the Linked Data initiative 41.
These advances raise research questions and technological challenges that span numerous fields of computer science research: databases, communication networks, security and trust, data mining, as well as human-computer interaction. Our research is based on the conviction that interactive systems play a central role in many data-driven activity domains. Indeed, no matter how elaborate the data acquisition, processing and storage pipelines are, data eventually get processed or consumed one way or another by users. The latter are faced with large, increasingly interlinked heterogeneous datasets that are organized according to complex structures, resulting in overwhelming amounts of both raw data and structured information. Users thus require effective tools to make sense of their data and manipulate them.
We approach this problem from the perspective of the Human-Computer Interaction (HCI) field of research, whose goal is to study how humans interact with computers and inspire novel hardware and software designs aimed at optimizing properties such as efficiency, ease of use and learnability, in single-user or cooperative work contexts. More formally, HCI is about designing systems that lower the barrier between users' cognitive model of what they want to accomplish, and computers' understanding of this model. HCI is about the design, implementation and evaluation of computing systems that humans interact with 43, 66. It is a highly multidisciplinary field, with experts from computer science, cognitive psychology, design, engineering, ethnography, human factors and sociology.
In this broad context, ILDA aims at designing interactive systems that display 30, 49, 73 the data and let users interact with them, aiming to help users better navigate and comprehend large datasets represented visually 459, as well as relate and manipulate them 63.
Our research agenda consists of the three complementary axes detailed in the following subsections. Designing systems that consider interaction in close conjunction with data structure and semantics is pivotal to all three axes. This will help drive navigation in, and manipulation of, the data, so as to optimize the communication bandwidth between users and data.
3.2 Novel Forms of Display for Groups and Individuals
Participants: Caroline Appert, Anastasia Bezerianos, Olivier Chapuis, Vanessa Peña-Araya, Emmanuel Pietriga, Vincent Cavez, Mehdi Chakhchoukh, Gaëlle Clavelin, Emmanuel Courtoux, Camille Dupré, Raphaël James, Ludovic David, Dylan Lebout, Sophie Chen.
Data sense-making and analysis is not limited to individual users working with a single device, but increasingly involves multiple users working together in a coordinated manner in multi-display environments: workstations, wall displays, handheld devices, mixed reality. We investigate how to empower users working with complex data by leveraging novel types of displays and combinations of displays, designing visualizations adapted to their capabilities.
The foundational question addressed here is what to display when, where and how, so as to provide effective support to users in their data understanding and manipulation tasks. ILDA targets contexts in which workers have to interact with complementary views on the same data, or with views on different-but-related datasets, possibly at different levels of abstraction. Being able to combine or switch between representations of the data at different levels of detail and merge data from multiple sources in a single representation is central to many scenarios. This is especially true in both of the application domains we consider: mission-critical systems (e.g., natural disaster crisis management) and the exploratory analysis of scientific data (e.g., correlate theories and heterogeneous observational data for an analysis of a given celestial body in Astrophysics).
A significant part of our research has focused on multi-scale interfaces. We designed and evaluated novel interaction techniques, but also worked actively on the development of open-source UI toolkits for multi-scale interfaces. These interfaces let users navigate large but relatively homogeneous datasets at different levels of detail, on both workstations 62, 26, 58, 57, 56, 27, 55, 25, 61 and wall-sized displays 51, 44, 60, 50, 28. This part of the ILDA research program is about extending multi-scale navigation in two directions: 1. Enabling the representation of multiple, spatially-registered but widely varying, multi-scale data layers in Geographical Information Systems (GIS) 19; 2. Generalizing the multi-scale navigation paradigm to interconnected, heterogeneous datasets as found on the Web of Data 4.
The first research problem has been mainly investigated in collaboration with IGN in the context of ANR project MapMuxing, which stands for multi-dimensional map multiplexing, from 2014 to early 2019. Project MapMuxing aimed at going beyond the traditional pan & zoom and overview+detail interface schemes 10, 46, 5, 7, and at designing and evaluating novel cartographic visualizations that rely on high-quality generalization, i.e., the simplification of geographic data to make it legible at a given map scale 69, 70, and symbol specification. Beyond project MapMuxing, we are also investigating multi-scale multiplexing techniques for geo-localized data in the specific context of ultra-high-resolution wall-sized displays, where the combination of a very high pixel density and large physical surface enable us to explore designs that involve collaborative interaction and physical navigation in front of the workspace 19.
The second research problem is about the extension of multi-scale navigation to interconnected, heterogeneous datasets. Generalization has a rather straightforward definition in the specific domain of geographical information systems, where data items are geographical entities that naturally aggregate as scale increases. But it is unclear how generalization could work for representations of the more heterogeneous webs of data that we consider in the first axis of our research program. Those data form complex networks of resources with multiple and quite varied relationships between them, that cannot rely on a single, unified type of representation 4 (a role played by maps in GIS applications).
Relevant publications by team members this year: 15, 17, 18, 19, 14, 20, 21.
3.3 Novel Forms of Input for Groups and Individuals
Participants: Caroline Appert, Anastasia Bezerianos, Olivier Chapuis, Emmanuel Pietriga, Vincent Cavez, Gaëlle Clavelin, Emmanuel Courtoux, Camille Dupré, Raphaël James, Julien Berry.
Analyzing and manipulating large datasets can involve multiple users working together in a coordinated manner in multi-display environments: workstations, handheld devices, wall-sized displays 28. Those users work towards a common goal, navigating and manipulating data displayed on various hardware surfaces in a coordinated manner. Group awareness 40, 36 is central in these situations, as users, who may or may not be co-located in the same room, can have an optimal individual behavior only if they have a clear picture of what their collaborators have done and are currently doing in the global context. We work on the design and implementation of interactive systems that improve group awareness in co-located situations 45, making individual users able to figure out what other users are doing without breaking the flow of their own actions.
In addition, users need a rich interaction vocabulary to handle large, structured datasets in a flexible and powerful way, regardless of the context of work. Input devices such as mice and trackpads provide a limited number of input actions, thus requiring users to switch between modes to perform different types of data manipulation and navigation actions. The action semantics of these input devices are also often too much dependent on the display output. For instance, a mouse movement and click can only be interpreted according to the graphical controller (widget) above which it is moved. We focus on designing powerful input techniques based upon technologies such as tactile surfaces (supported by UI toolkits developed in-house), 3D motion tracking systems, or custom-built controllers 48to complement (rather than replace) traditional input devices such as keyboards, that remain the best method so far for text entry, and indirect input devices such as mice or trackpads for pixel-precise pointing actions.
The input vocabularies we investigate enable users to navigate and manipulate large and structured datasets in environments that involve multiple users and displays that vary in their size, position and orientation 28, 37, each having their own characteristics and affordances: wall displays 51, 3, 24, workstations, tabletops 53, 35, tablets 52, 71, smartphones 74, 31, 67, 68, and combinations thereof 34, 72, 50, 28, as well as augmented reality displays 1, 15, 2133.
We aim at designing rich interaction vocabularies that go far beyond what current touch interfaces offer, which rarely exceeds five gestures such as simple slides and pinches. Designing larger gesture vocabularies requires identifying discriminating dimensions (e.g., the presence or absence of anchor points and the distinction between internal and external frames of reference 52) in order to structure a space of gestures that interface designers can use as a dictionary for choosing a coherent set of controls. These dimensions should be few and simple, so as to provide users with gestures that are easy to memorize and execute. Beyond gesture complexity, the scalability of vocabularies also depends on our ability to design robust gesture recognizers that will allow users to fluidly chain simple gestures that make it possible to interlace navigation and manipulation actions.
We also study how to further extend input vocabularies by combining touch 52, 74, 53 and pen 9, 63 or mid-air gestures 51 with physical objects 42, 65, 48 and classical input devices such as keyboards to enable users to input commands to the system or to involve other users in their workflow (request for help, delegation, communication of personal findings, etc.) 29, 47. Gestures and objects encode a lot of information in their shape, dynamics and direction, that can be directly interpreted in relation with the user, independently from the display output. Physical objects can also greatly improve coordination among actors for, e.g., handling priorities or assigning specific roles.
Relevant publications by team members this year: 15.
3.4 Interacting with Diverse Data
Participants: Caroline Appert, Anastasia Bezerianos, Vanessa Peña-Araya, Emmanuel Pietriga, Mehdi Chakhchoukh, Rim Hajri, Theo Bouganim, Ludovic David, Johann Elquilbec, Xiang Wei.
Research in data management is yielding novel models that enable diverse structuring and querying strategies, give machine-processable semantics to the data and ease their interlinking. This, in turn, yields datasets that can be distributed at the scale of the Web, highly-heterogeneous and thus rich but also quite complex. We investigate ways to leverage this richness from the users' perspective, designing interactive systems adapted to the specific characteristics of data models and data semantics of the considered application area.
To be successful, interaction paradigms that let users navigate and manipulate data on the Web have to be tailored to the radically different way of browsing information enabled by it, where users directly interact with the data rather than with monolithic documents. The general research question addressed in this part of our research program is how to design novel interaction techniques that help users manipulate their data more efficiently. By data manipulation, we mean all low-level tasks related to manually creating new content, modifying and cleaning existing content, merging data from different sources, establishing connections between datasets, categorizing data, and eventually sharing the end results with other users; tasks that are currently considered quite tedious because of the sheer complexity of the concepts, data models and syntax, and the interplay between all of them.
Our approach is based on the conviction that there is a strong potential for cross-fertilization, as mentioned earlier: on the one hand, user interface design is essential to the management and understanding of webs of data; on the other hand, interlinked datasets enriched with even a small amount of semantics can help create more powerful user interfaces, that provide users with the right information at the right time.
We envision systems that focus on the data themselves, exploiting the underlying semantics and structure in the background rather than exposing them – which is what current user interfaces for the Web of Data often do. We envision interactive systems in which the semantics and structure are not exposed directly to users, but serve as input to the system to generate interactive representations that convey information relevant to the task at hand and best afford the possible manipulation actions.
Relevant publications by team members this year: 11, 15, 13, 16, 12.
4 Application domains
4.1 Mission-critical Systems
Mission-critical contexts of use include emergency response & management, and critical infrastructure operations, such as public transportation systems, communications and power distribution networks, or the operations of large scientific instruments such as particle accelerators and astronomical observatories. Central to these contexts of work is the notion of situation awareness 36, i.e., how workers perceive and understand elements of the environment with respect to time and space, such as maps and geolocated data feeds from the field, and how they form mental models that help them predict future states of those elements. One of the main challenges is how to best assist subject-matter experts in constructing correct mental models and making informed decisions, often under time pressure. This can be achieved by providing them with, or helping them efficiently identify and correlate, relevant and timely information extracted from large amounts of raw data, taking into account the often cooperative nature of their work and the need for task coordination. With this application area, our goal is to investigate novel ways of interacting with computing systems that improve collaborative data analysis capabilities and decision support assistance in a mission-critical, often time-constrained, work context.
Relevant publications by team members this year: 19.
4.2 Exploratory Analysis of Scientific Data
Many scientific disciplines are increasingly data-driven, including astronomy, molecular biology, particle physics, or neuroanatomy. While making the right decision under time pressure is often less of critical issue when analyzing scientific data, at least not on the same temporal scale as truly time-critical systems, scientists are still faced with large-to-huge amounts of data. No matter their origin (experiments, remote observations, large-scale simulations), these data are difficult to understand and analyze in depth because of their sheer size and complexity. Challenges include how to help scientists freely-yet-efficiently explore their data, keep a trace of the multiple data processing paths they considered to verify their hypotheses and make it easy to backtrack, and how to relate observations made on different parts of the data and insights gained at different moments during the exploration process. With this application area, our goal is to investigate how data-centric interactive systems can improve collaborative scientific data exploration, where users' goals are more open-ended, and where roles, collaboration and coordination patterns 40 differ from those observed in mission-critical contexts of work.
5 Highlights of the year
- Caroline Appert served as Technical Program Chair for ACM CHI 2022, the ACM SIGCHI flagship international conference on Human-Computer Interaction. CHI 2022
- Renewal of our collaboration with the DESY national research center in Germany about the design and development of user interfaces for the Cherenkov Telescope Array control room. CTA Observatory (Ludovic David, Dylan Lebout, Emmanuel Pietriga)
- Beginning of ANR PRC project Interplay (Caroline Appert, Olivier Chapuis)
5.1 Awards
Best paper runner-up/honorable mention award:
- Investigating the Use of AR Glasses for Content Annotation on Mobile Devices at ACM ISS 2022 15. (Francesco Di Gioia, Eugénie Brasier, Emmanuel Pietriga, Caroline Appert)
6 New software and platforms
6.1 New software
6.1.1 HyperStoryLines
-
Keywords:
Data visualization, Hypergraphs
-
Scientific Description:
HyperStorylines is a technique that generalizes Storylines to visualize the evolution of relationships involving multiple types of entities such as, for example, people, locations, and companies. Datasets which describe such multi-entity relationships are often modeled as hypergraphs, that can be difficult to visualize, especially when these relationships evolve over time. HyperStorylines builds upon Storylines, enabling the aggregation and nesting of these dynamic, multi-entity relationships.
-
Functional Description:
A visualization tool to represent relationships among different types of entities, forming a hypergraph, and that evolve over time.
- URL:
- Publication:
-
Contact:
Vanessa Pena Araya
-
Participants:
Vanessa Pena Araya, Anastasia Bezerianos, Emmanuel Pietriga, Rim Hajri, Laurent Amsaleg
6.1.2 wildmap
-
Name:
Wall-sized Interaction with Large Map Data
-
Keyword:
Geo-visualization
-
Functional Description:
A library to enable the interactive visualization of map data on ultra-high-resolution wall-sized displays using Web-based technologies.
- URL:
-
Contact:
Emmanuel Pietriga
-
Participants:
Emmanuel Pietriga, Olivier Gladin
6.1.3 WallTokens
-
Keyword:
Tangible interface
-
Scientific Description:
angibles can enrich interaction with digital surfaces. Among others, they support eyes-free control or enhance awareness of others' actions. Tangibles have been studied in combination with horizontal surfaces such as tabletops, but not with vertical surfaces such as wall displays. The obvious obstacle is gravity as tangibles cannot be laid on the surface without falling. We present WallTokens, which are easy-to-fabricate tangibles to interact with a vertical surface. A WallToken is a plastic token whose footprint is recognized on a tactile surface. It is equipped with a push-handle that controls a suction cup. This makes it easy for users to switch between sliding or attaching it to the wall. This project is a step towards enabling tangible interaction in a wall display context.
-
Functional Description:
Tools and Software to use the WallTokens. WallTokens are easy-to-fabricate tangibles to interact with a vertical surface. A WallToken is a plastic token whose footprint is recognized on a tactile surface. It is equipped with a push-handle that controls a suction cup. This makes it easy for users to switch between sliding or attaching it to the wall. https://walltokens.lisn.upsaclay.fr/
- URL:
- Publication:
-
Contact:
Olivier Chapuis
-
Participants:
Emmanuel Courtoux, Olivier Chapuis, Caroline Appert
6.2 New platforms
Participants: Caroline Appert, Anastasia Bezerianos, Olivier Chapuis, Vanessa Peña-Araya, Emmanuel Pietriga, Emmanuel Courtoux, Camille Dupré, Raphaël James, Olivier Gladin, Julien Berry, Sophie Chen.
Both the WILD-512K and WILDER platforms are now part of funded project ANR EquipEx+ Continuum (ANR-21-ESRE-0030). Figure 1 illustrates usage of the wildmap software library (see Section 6.1.2) to develop a visualization of worldwide marine traffic using AIS data.
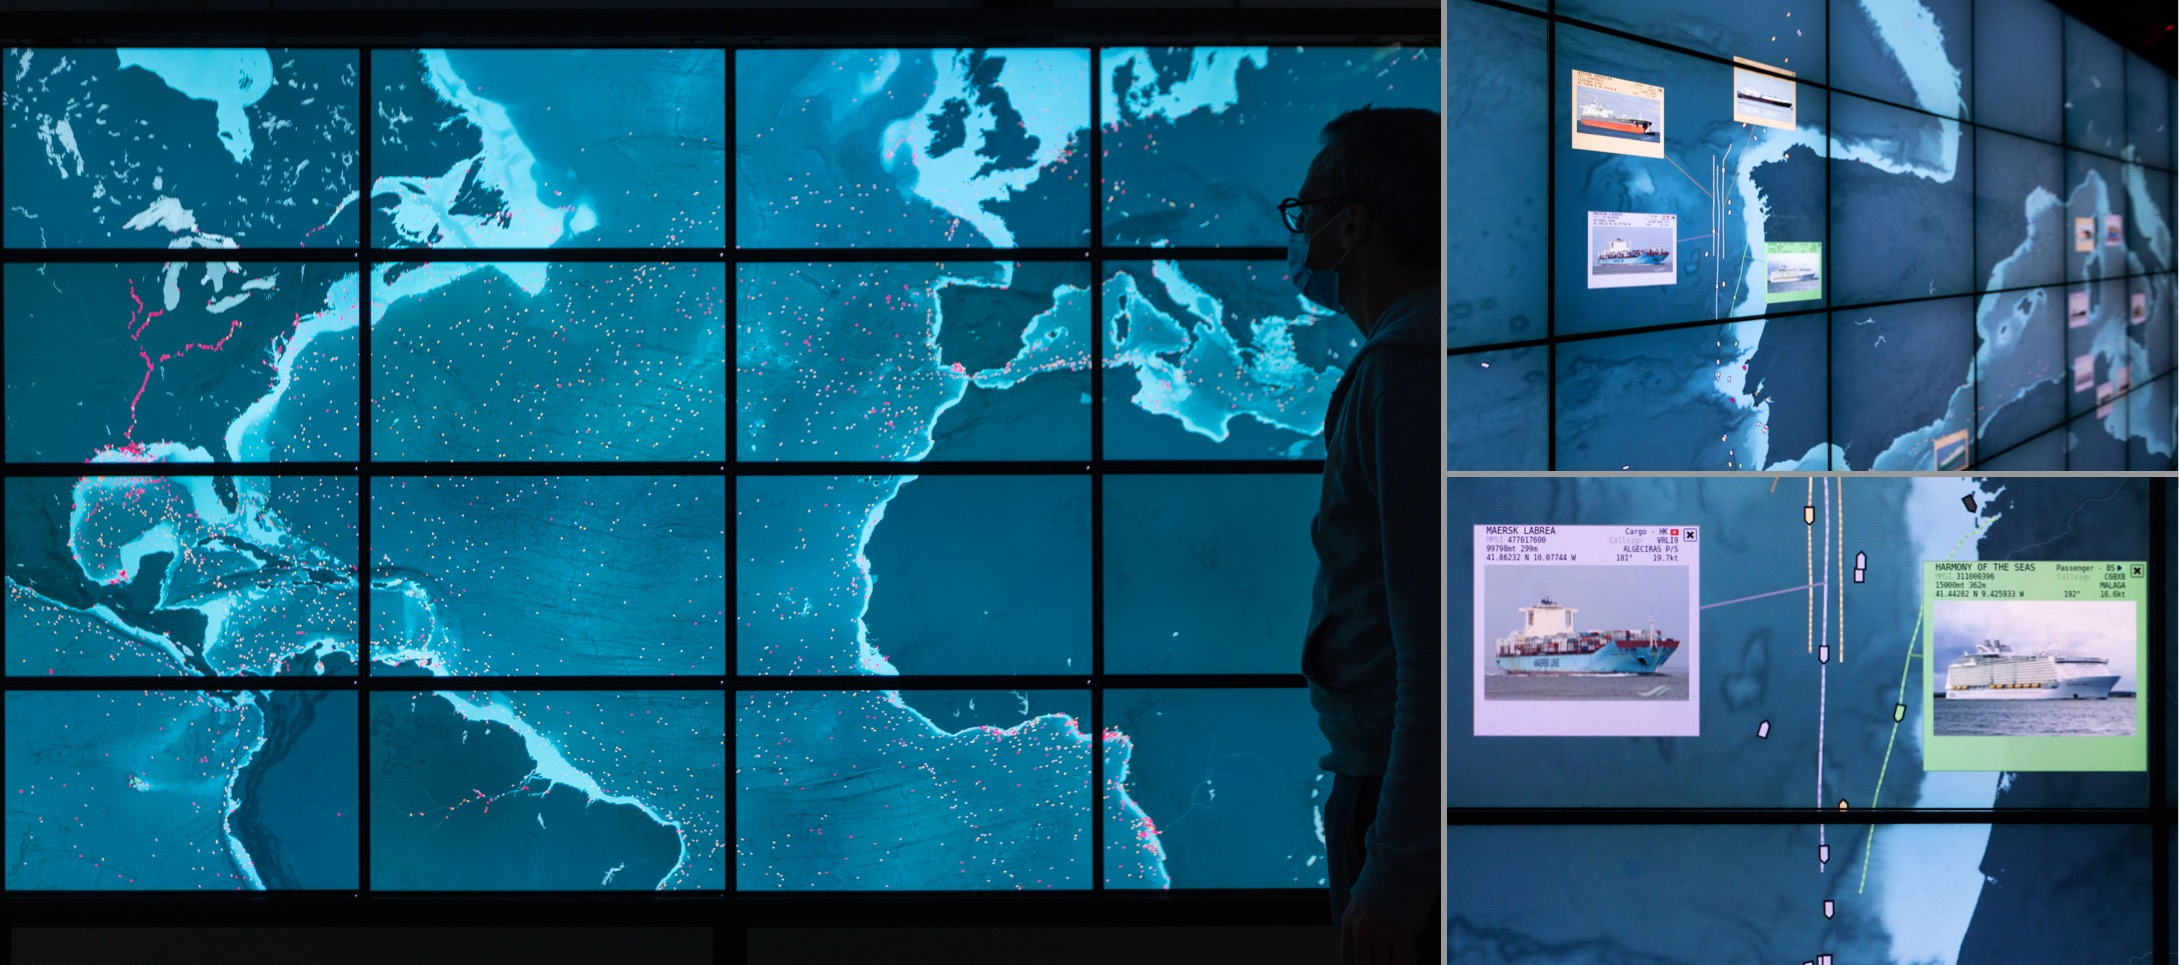
Three pictures of the WILD-512K ultra wall displaying data about ships on a map of the world, at varying levels of detail.
7 New results
Participants: Caroline Appert, Anastasia Bezerianos, Olivier Chapuis, Vanessa Peña-Araya, Emmanuel Pietriga, Mehdi Chakhchoukh.
7.1 Interacting with Novel Forms of Displays
Augmented Reality (AR), as a novel form of display, is becoming one of the main centers of attention in the team. Technology is indeed maturing fast, to the point that we can expect wearable devices (eyewear) with a reasonable form factor and performance in a few years, given recent advances and the effort dedicated to research and development in the industry.
Early work in the team 1 investigated different input techniques for indirect pointing in AR. We then studied how AR could improve interaction with handheld devices 33, where AR is not only used to offload widgets from the phone to the air around it, but to give users more control on input precision as well. This year, with AnnotAR 15 we have investigated a similar hardware combination but for different purposes: content annotation in mobile situations.
The concept is illustrated in Figure 2. This is motivated by the fact that mobile devices such as smartphones and tablets have limited display size and input capabilities that make a variety of tasks challenging. Coupling the mobile device with Augmented Reality eyewear such as smartglasses can help address some of these challenges. In the specific context of digital content annotation tasks, this combination has the potential to enhance the user experience on two fronts. First, annotations can be offloaded into the air around the mobile device, freeing precious screen real-estate, as we had done in 33. Second, as smartglasses often come equipped with a variety of sensors including a camera, users can annotate documents with pictures or videos of their environment, captured on the spot, hands-free, and from the wearer's perspective. AnnotAR is a prototype that we use as a research probe to assess the viability of this approach to digital content annotation. We used AnnotAR to gather users' preliminary feedback in a laboratory setting, and to showcase how it could support real-world use cases. This work won a best paper honorable mention at ACM ISS 2022.
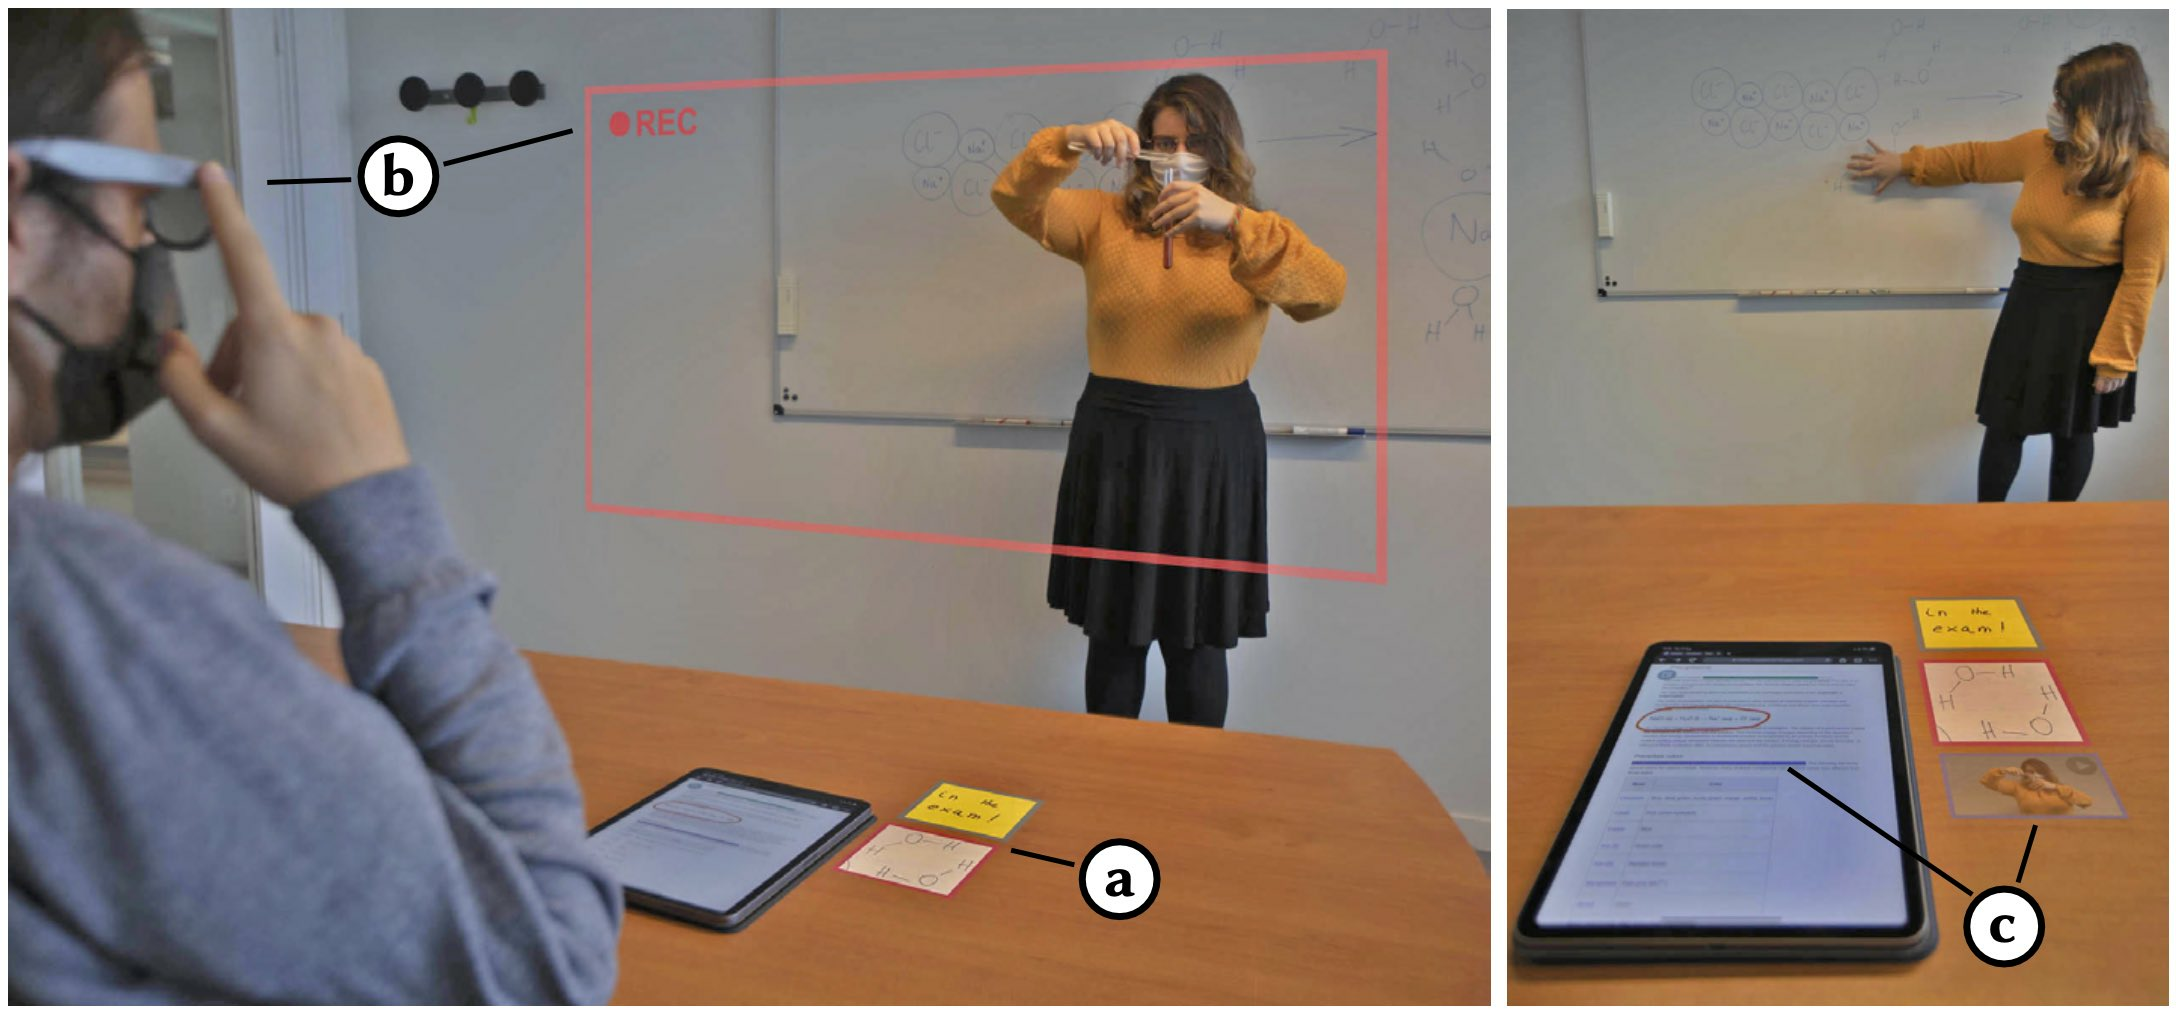
Two photos depicting a student seated at a desk, wearing smartglasses, and watching a Professor perform a chemistry experiment. A tablet lies on the desk in front of the student. Virtual content is displayed next to the tablet as well, thanks to the smartglasses' AR display capabilities.
Taking a step back, we also looked at situations where Augmented Reality might interfere with people's perception of the real world and how we might alleviate this problem 21. Anticipating a future in which people frequently have virtual content displayed in their field of view to augment reality, we reflected upon situations where this virtual content interferes with users' perception of the physical world, with consequences ranging from mere annoyance to serious injuries. We argued for the need to give users agency over virtual augmentations, discussing the concept of de-augmenting augmented reality by selectively removing virtual content from the field of view. As illustrated in Figure 3, de-augmenting lets users target what actually interferes with their perception of the environment while keeping what is of interest. We contributed a framework that captures the different facets of de-augmentation. We also discussed what it entails in terms of technical realization and interaction design, and described three scenarios to illustrate what the user experience could be in a sample of domestic and professional situations.
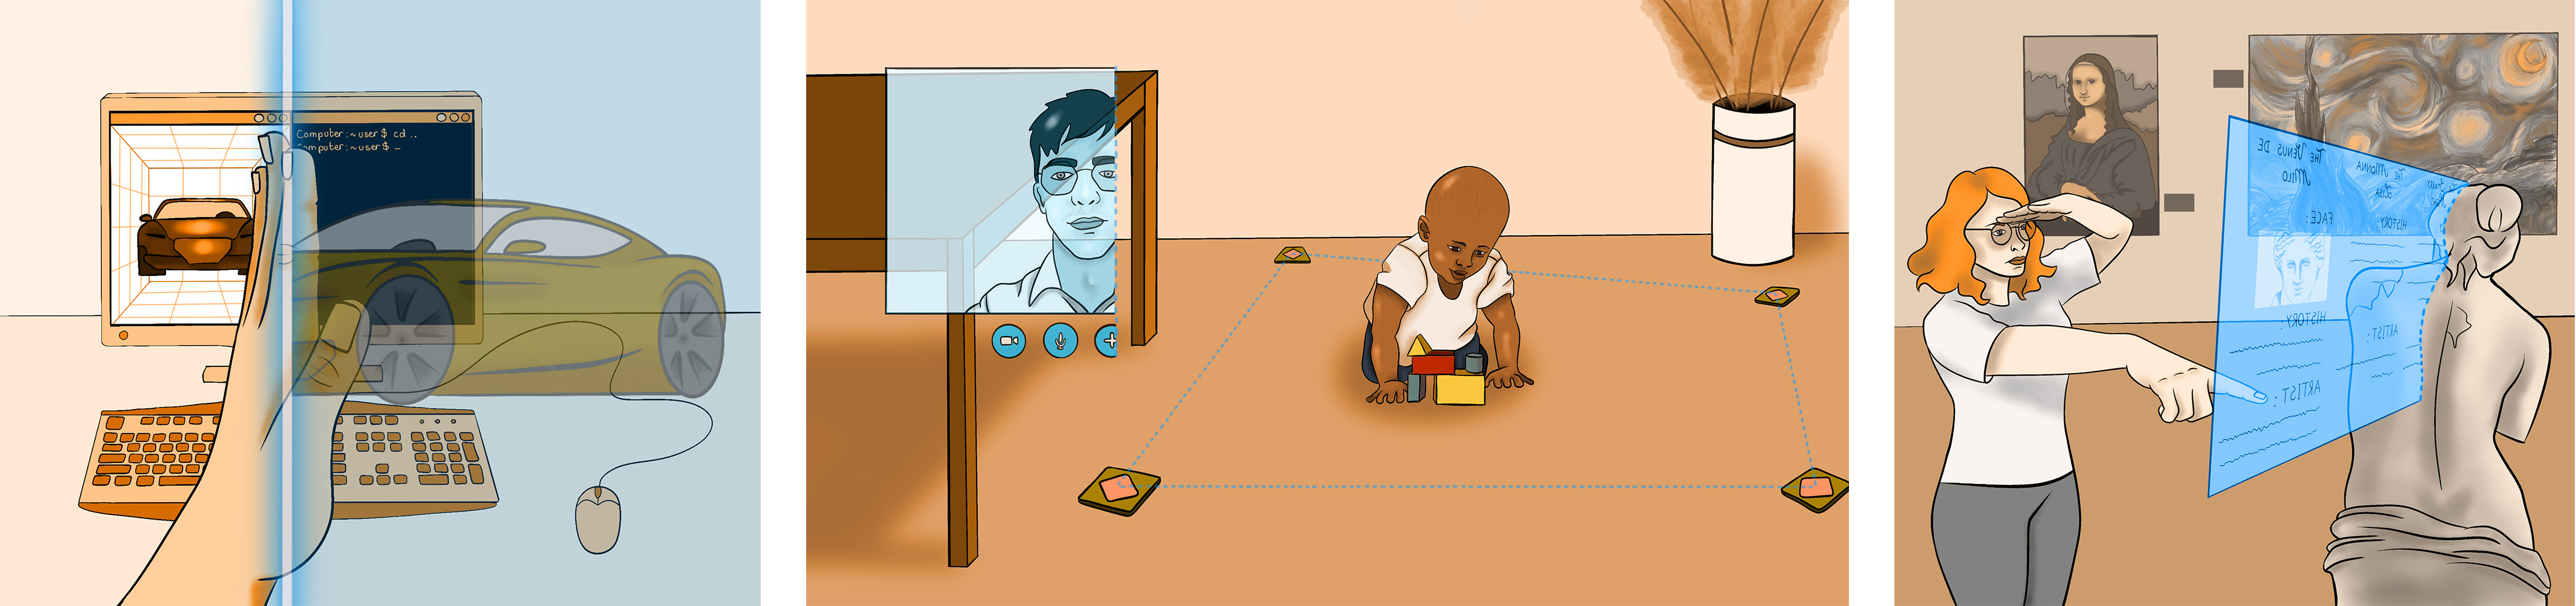
Three illustrations showing three different examples of interaction for activating de-augmentation. The first illustration is a different environment from the perspective of the wearer of the AR headset. It shows a real desktop screen and the augmented content of a virtual car. The AR user has made a swipe gesture from left to right in front of their field of view - this has resulted in part of their field of view to be de-augmented. The second illustration shows a AR scene from the perspective of the wearer of the AR headset. Here the AR user has placed real physical tokens around their baby playing on the floor, which has created a de-augmentation volume around their baby. The third illustration is seen from the third perspective - we see a user wearing an AR headset in a museum. By pointing with one hand and putting her other hand on her forehead, as if shading her eyes, the AR user has chosen to de-augmented a physical statue.
7.2 Interactive Visual Exploration of Complex Data
Another strong topic in the team is the design, development and empirical evaluation of visualization techniques for the understanding of spatio-temporal, multivariate data 754. As part of this line of research, we investigated visualization techniques for data modeled as hypergraphs, with a strong temporal aspect and lesser emphasis on the geo-spatial aspect with HyperStoryLines 6, a technique that generalizes Storylines to visualize the evolution of relationships involving multiple types of entities such as, for example, people, locations, and companies. Storyline visualizations are a powerful way to compactly visualize how the relationships between people evolve over time. Real-world relationships often also involve space, for example the cities that two political rivals visited together or alone over the years. By default, Storyline visualizations only show implicitly geospatial co-occurrence between people (drawn as lines), by bringing their lines together. Even the few designs that do explicitly show geographic locations only do so in abstract ways (e.g., annotations) and do not communicate geospatial information, such as the direction or extent of their political campaigns.
This year we introduced Geo-Storylines 16, a collection of visualisation designs that integrate geospatial context into Storyline visualizations, using different strategies for compositing time and space (Figure 4). Our contribution is twofold. First, we present the results of a sketching workshop with 11 participants, that we used to derive a design space for integrating maps into Storylines. Second, by analyzing the strengths and weaknesses of the potential designs of the design space in terms of legibility and ability to scale to multiple relationships, we extract the three most promising: Time Glyphs, Coordinated Views, and Map Glyphs. We compare these three techniques first in a controlled study with 18 participants, under five different geospatial tasks and two maps of different complexity. We additionally collected informal feedback about their usefulness from domain experts in data journalism. Our results indicate that, as expected, detailed performance depends on the task. Nevertheless, Coordinated Views remain a highly effective and preferred technique across the board.
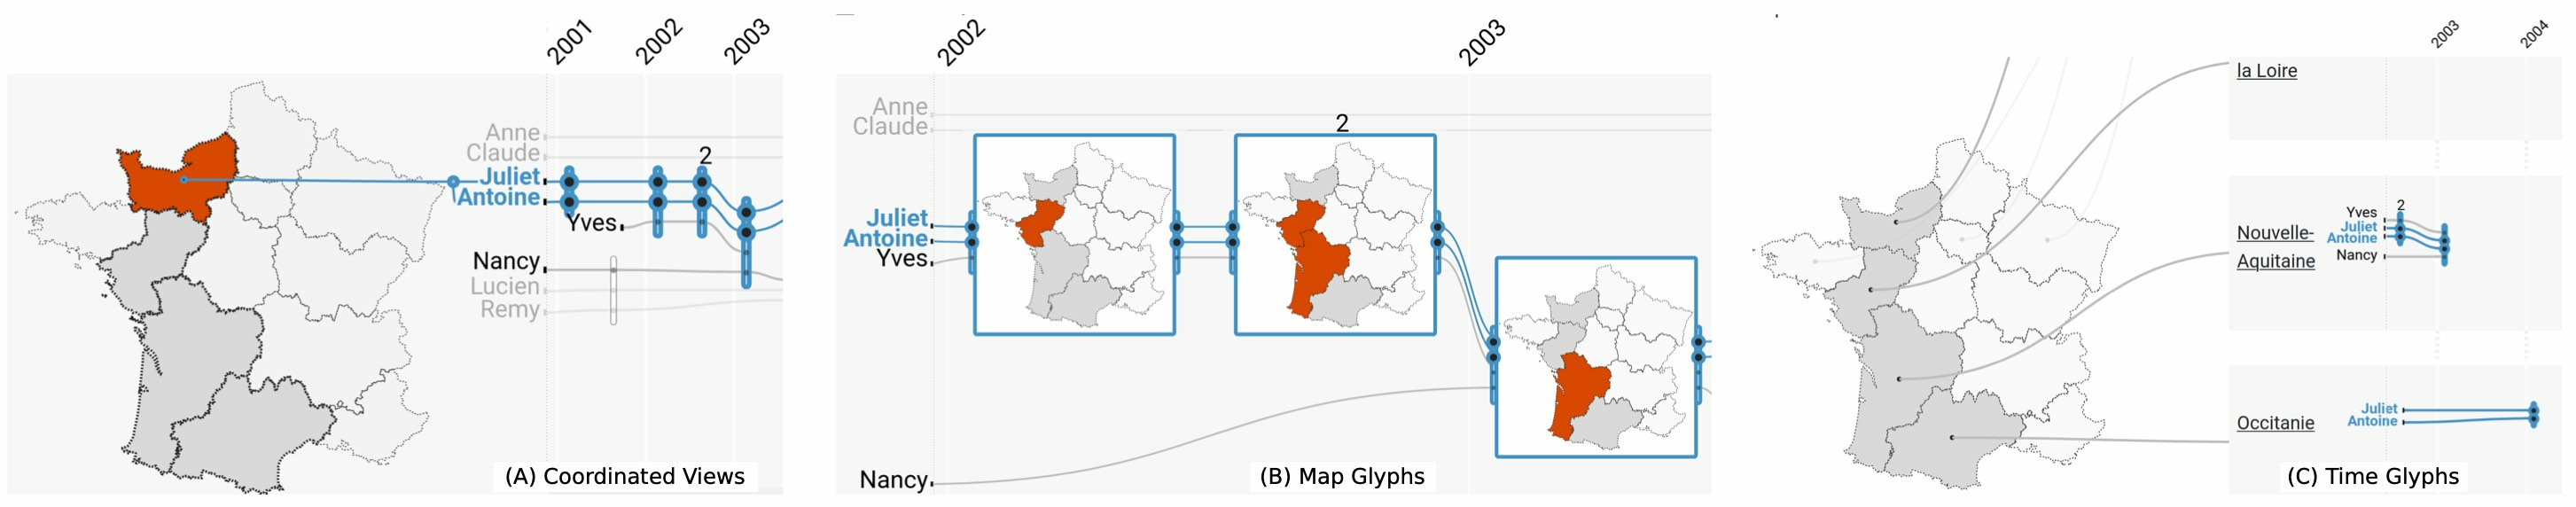
Three screenshots showing the different ways to integrate maps into storyline visualizations, using French regions as an example.
Continuing our collaboration with colleagues from INRAe and following up on work in which we demonstrated how analytic provenance can be exploited to re-construct user trust in a guided Visual Analytics (VA) system 32, we designed a trade-off analysis system, motivated by the needs of experts in domains such as agronomy or manufacturing, who need to consider trade-offs when making decisions that involve several, often competing, objectives. Such analysis is complex and may be conducted over long periods of time, making it hard to revisit. We considered the use of analytic provenance mechanisms to aid experts recall and keep track of trade-off analysis. VisProm, our web-based system, incorporates in-visualization provenance views, designed to help experts keep track of trade-offs and their objectives. We used VisProm as a technology probe to understand user needs and explore the potential role of provenance in this context. Through observation sessions with three groups of experts analyzing their own data, we made several contributions. First we identified eight high-level tasks that experts engaged in during trade-off analysis, such as locating and characterizing interest zones in the trade-off space, and showed how these tasks can be supported by provenance visualization. Second, we refined findings from previous work on provenance purposes such as recall and reproduce, by identifying specific objects of these purposes related to trade-off analysis, such as interest zones, and exploration structure (e.g., exploration of alternatives and branches). Third, we discussed insights on how the identified provenance objects and our designs support these trade-off analysis tasks, both when revisiting past analysis and while actively exploring. And finally, we identified new opportunities for provenance-driven trade-off analysis, for example related to monitoring the coverage of the trade-off space, and tracking alternative trade-off scenarios.
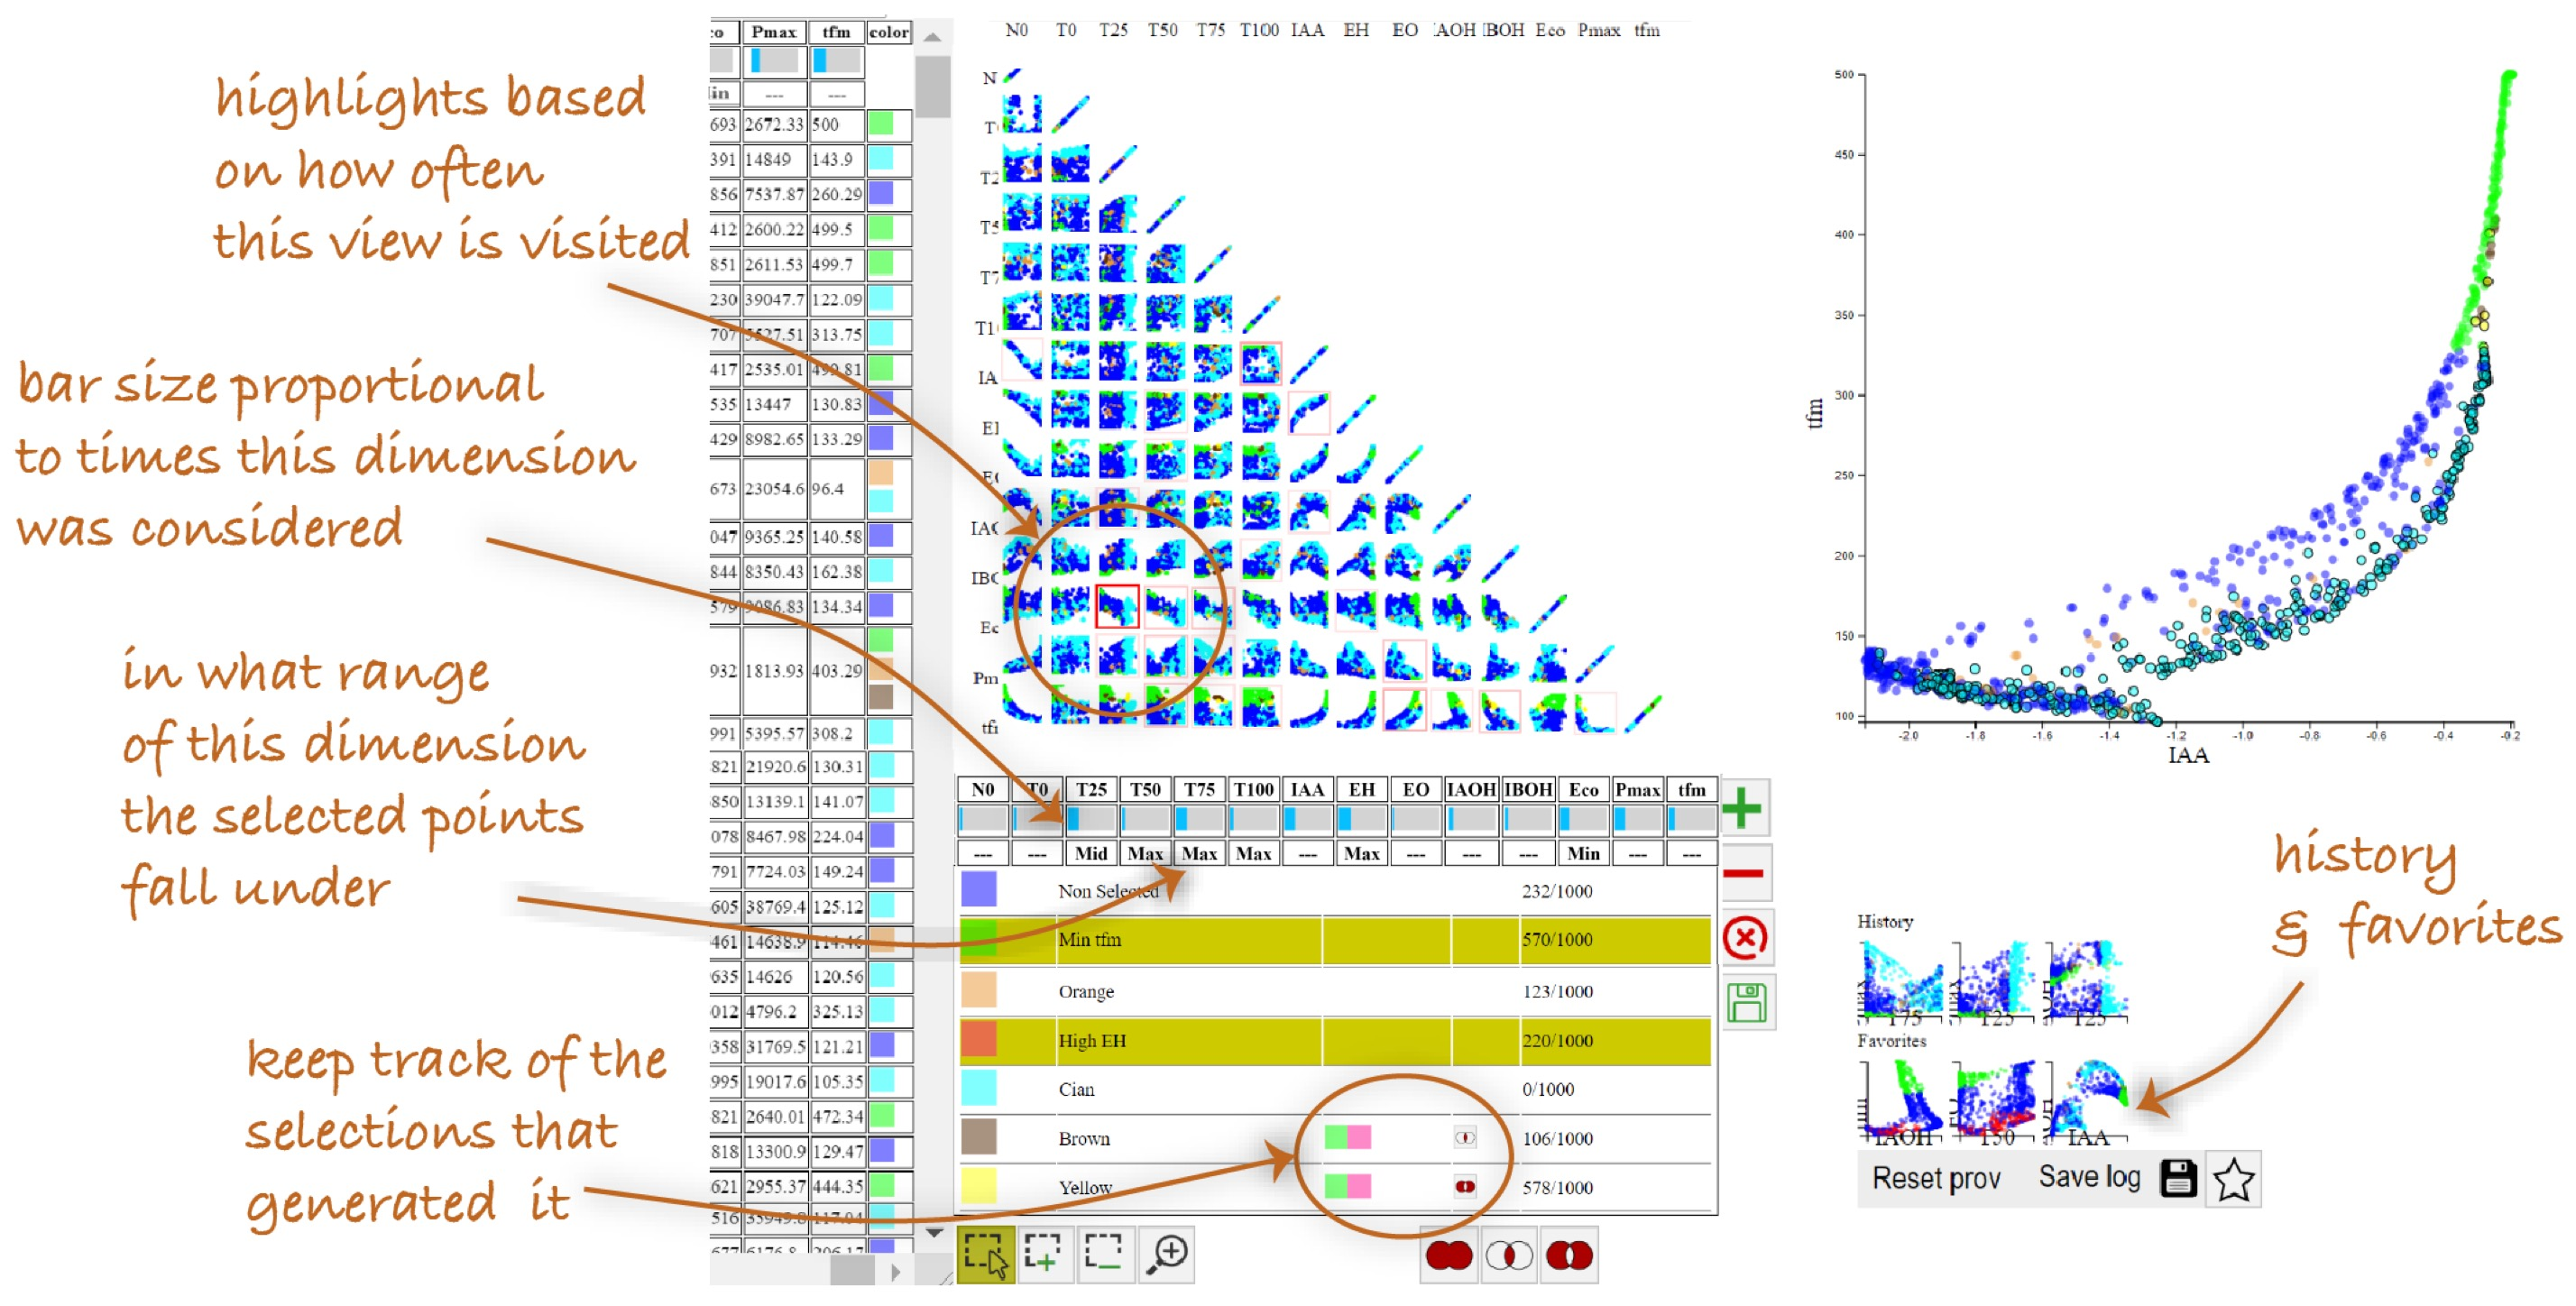
Screenshot of the VisProm prototype, featuring a scatterplot matrix, a detailed scatterplot, a table of parameters, and scatterplot thumbnails representing views explored previously.
We collaborated with Aviz team members (Inria Saclay) on two topics. We worked on visualization in motion 14, meaning visual data representations that are used in contexts that exhibit relative motion between a viewer and an entire visualization. Sports analytics, video games, wearable devices, or data physicalizations are example contexts that involve different types of relative motion between a viewer and a visualization. We helped define a research agenda on the topic and conduct two experiments to understand how well viewers can read data from moving visualizations.
We also continued the collaboration about visualizations on very small displays such as smartwatches and fitness bands 17. We presented the findings of four studies related to the visualization of sleep data on such displays. Beyond reporting on the studies' findings, we reflected on our crowdsourced study methodology for testing the effectiveness of visualizations for wearables. Research questions at the intersection of both topics – visualization in motion and visualization on very small wearable displays – were also discussed in 18.
Finally, our collaboration with the University of Paris Descartes on the topic of time-series data visualization and search, which was the topic of Anna Gogolou, a former PhD student team member 38, 39, led to a new publication about a new probabilistic learning-based method that provides quality guarantees for progressive Nearest Neighbor (NN) query answering 12. The method can be applied with the two most popular distance measures, namely, Euclidean and Dynamic Time Warping (DTW). It provides both initial and progressive estimates of the final answer, as well suitable stopping criteria for the progressive queries. It can also be used in order to develop a progressive algorithm for data series classification (based on a k-NN classifier).
8 Bilateral contracts and grants with industry
Participants: Caroline Appert, Camille Dupré, Emmanuel Pietriga.
8.1 Bilateral contracts with industry
- Berger-Levrault: ANRT/CIFRE PhD (Camille Dupré), 3 years, November 2022-October 2025 on the topic of Interactive content manipulation in Mixed Reality for maintenance applications.
9 Partnerships and cooperations
9.1 European initiatives
9.1.1 Other european programs/initiatives
Participants: Dylan Lebout, Ludovic David, Emmanuel Pietriga.
Deutsches Elektronen-Synchrotron (DESY): Scientific collaboration on the design and implementation of user interfaces for array operations monitoring and control for the Cherenkov Telescope Array (CTA) project, currently being built in the Canary Islands (Spain) and in the Atacama desert (Chile). Original contract for 5 years, starting May 2018, now extended until October 2026. www.cta-observatory.org
9.2 National initiatives
9.2.1 EquipEx+ Continuum (ANR)
Participants: Caroline Appert, Anastasia Bezerianos, Olivier Chapuis, Emmanuel Pietriga, Vanessa Peña-Araya, Emmanuel Courtoux, Camille Dupré, Raphaël James, Julien Berry, Sophie Chen.
ILDA participates to EquipEx+ project Continuum, a collaborative research infrastructure of 30 platforms located throughout France to advance interdisciplinary research based on interaction between computer science and the human and social sciences. Funded by the French National Research Agency (ANR) from 2021 to 2029. 19 academic institutions and 3 research organizations.
9.2.2 ANR Interplay
Participants: Caroline Appert, Olivier Chapuis.
Novel display technologies such as wall-sized displays, very large tabletops, and headsets for Virtual Reality or Augmented Reality make it possible to redesign workspaces for more flexibility and efficiency. The goal of the project is to study rich display environments from a human computer interaction perspective in order to inform the design of innovative workspaces for crisis management and data analysis. To reach this goal we will: (i) study the output capacities of these displays for distributing information across displays efficiently; (ii) use physical artefacts for facilitating navigation and interaction across displays; and (iii) use embodied gestures for portable and expert interactions across displays. Our studies will be informed by a real crisis management environment, and the results of the project will help redesign this environment. Coordinator: Olivier Chapuis. Funding: 629k€.
Partners:
- CEA Tech en Occitanie, Commissariat à l'Energie Atomique et aux Energies Alternatives.
- Institut de Recherche en Informatique de Toulouse (IRIT), Université de Toulouse.
- Laboratoire Traitement et Communication de l'Information, Télécom Paris & Institut Polytechnique de Paris.
10 Dissemination
Participants: Caroline Appert, Anastasia Bezerianos, Olivier Chapuis, Vanessa Peña-Araya, Emmanuel Pietriga, Vincent Cavez, Mehdi Chakhchoukh, Raphaël James.
10.1 Promoting scientific activities
10.1.1 Scientific events: organisation
General chair, scientific chair
- ACM CHI 2022, 40th ACM SIGCHI Conference on Human Factors in Computing Systems: Caroline Appert (TPC - Technical Program Chair)
Member of the organizing committees
- ACM CHI Steering Committee (2019-...), ACM SIGCHI Conference on Human Factors in Computing Systems: Caroline Appert
- IEEE VIS Executive Committee (2021-...), Visualization Conference: Anastasia Bezerianos
- IEEE VIS Ombud (2022-...): Anastasia Bezerianos
- ACM CHI 2022, 40th ACM SIGCHI Conference on Human Factors in Computing Systems: Vanessa Peña-Araya, Emmanuel Pietriga (data chairs)
- LISN PhD Days (Université Paris Saclay): Vincent Cavez
10.1.2 Scientific events: selection
Chair of conference program committees
- IEEE VIS 2022, Visualization Conference: Anastasia Bezerianos (Area Paper Chair)
Member of the conference program committees
- IEEE VIS 2022, Visualization Conference: Emmanuel Pietriga (AC - Associate Chair)
- IEEE VIS 2022, Visualization Conference (short papers): Vanessa Peña-Araya (AC - Associate Chair)
- ACM MobileHCI 2022, Conference on Mobile Human-Computer Interaction: Olivier Chapuis (AC - Associate Chair)
- IHM 2023, Conférence Francophone sur l'Interaction Humain Machine: Anastasia Bezerianos (AC - Associate Chair)
Reviewer
- ACM CHI 2023, reviewer: Olivier Chapuis, Vanessa Peña-Araya, Caroline Appert
- ACM SIGGRAPH 2022, reviewer: Olivier Chapuis
- ACM UIST 2022, Symposium on User Interface Software and Technology: Olivier Chapuis
- IEEE VIS 2022, reviewer: Vanessa Peña-Araya
- IEEE VR 2022, Conference on Virtual Reality and 3D User Interfaces: Olivier Chapuis
- ACM ISS 2022, International Conference on Interactive Surfaces and Spaces: Olivier Chapuis
- IEEE PacificVis 2023, reviewer: Vanessa Peña-Araya
- IHM 2023, reviewer: Vanessa Peña-Araya, Emmanuel Pietriga
10.1.3 Journal
Member of the editorial boards
- ACM ToCHI, Transactions on Computer-Human Interaction: Caroline Appert (associate editor)
Reviewer - reviewing activities
- ACM ToCHI, Transactions on Computer-Human Interaction: Olivier Chapuis
- IEEE TVCG, Transactions on Visualization and Computer graphics: Anastasia Bezerianos, Vanessa Peña-Araya
10.1.4 Invited talks
- Keynote Speaker at ACM EICS '22, the 14th SIGCHI Symposium on Engineering Interactive Computing Systems: Emmanuel Pietriga
- Invited panelist at ACM SUI '22, the 10th ACM symposium on Spatial User Interaction: Caroline Appert
- Speaker at Journée Sciences Navales, École Navale, Février 2022, Brest, France, about AIS data visualization on ultra-high-resolution wall displays: Emmanuel Pietriga
- Invited talk at GdR Traitement Automatique des Langues on Visual Text Analytics in Data Journalism: Anastasia Bezerianos
10.1.5 Leadership within the scientific community
- Conseil Scientifique d'Institut (CNRS/INS2I): Caroline Appert
10.1.6 Scientific expertise
- Hiring committee MdC section 27, Telecom Paris Tech (external jury member): Anastasia Bezerianos
- ANR AAPG2022 (reviewer): Caroline Appert, Olivier Chapuis
10.1.7 Research administration
- Responsable du Département Interaction avec l'Humain (IaH) du LISN (UMR9015): Olivier Chapuis
- Member of Conseil de l'École Doctorale STIC Paris Saclay: Caroline Appert
- Member of pôle B de l'École Doctorale STIC Paris Saclay: Caroline Appert
- Member of Conseil de Laboratoire (LISN): Caroline Appert
- Responsable Mobilité Internationale, Comp. Sci. department, Université Paris-Saclay: Anastasia Bezerianos
- Member of Commissions Consultatives de Spécialistes d’Université (CCUPS) at Université Paris Saclay: Anastasia Bezerianos, Emmanuel Pietriga
- Co-head of the Polytech Département IIM: Informatique et Ingénierie Mathématique: Anastasia Bezerianos
10.2 Teaching - Supervision - Juries
- Ingénieur (X-3A)/Master (M1/M2): Emmanuel Pietriga, Data Visualization (INF552), 36h, École Polytechnique / Institut Polytechnique de Paris
- Master (M1/M2): Anastasia Bezerianos, Mixed Reality and Tangible Interaction, 12h, Univ. Paris Saclay
- Master (M1/M2): Anastasia Bezerianos, Interactive Information Visualization, 10.5h, Univ. Paris Saclay
- Master (M1): Anastasia Bezerianos, Design Project (M1 HCI/HCID), 21h, Univ. Paris Saclay.
- Master (M1): Anastasia Bezerianos, WinterSchool, 6h, Univ. Paris-Saclay.
- Ingénieur 4e année (Polytech - ET4): Anastasia Bezerianos, Projet, 36h, Polytech, Univ. Paris-Saclay.
- Ingénieur 3e année apprentissage (Polytech - APP3): Anastasia Bezerianos, Programmation Web, 36h, Polytech, Univ. Paris-Saclay.
- License (L3/IUT): Anastasia Bezerianos, Programmation Android IUT, 31h, Université Paris Saclay
- Master (M2): Emmanuel Pietriga, Data Visualization, 24h, Université Paris Dauphine
- Master (M2): Vanessa Peña Araya, Winter School, 8h, Univ. Paris Saclay
- Master (M1/M2): Vanessa Peña Araya, Web Development with Node.js, 10.5h, Univ. Paris Saclay
- Master (M2): Vanessa Peña Araya, Career Seminar, 12h, Univ. Paris Saclay
- License (L1/IUT): Vanessa Peña Araya, Dev. d'apps avec IHM, 32h, Univ. Paris Saclay
- Master (M2): Mehdi Chakhchoukh, Winter school, 11h, Univ. Paris Saclay
- Ingénieur (Et3): Mehdi Chakhchoukh, Interaction Humain-Machine, 12h, Polytech Paris-Saclay
- License (L3): Mehdi Chakhchoukh, Programmation d'Interfaces Interactives Avancées, 24h, Univ. Paris Saclay
- Master (M1): Mehdi Chakhchoukh, Programming of Interactive Systems, 21h, Univ. Paris Saclay
- License (L2): Mehdi Chakhchoukh, Introduction à l'Interaction Humain-Machine, 12h, Université Paris Saclay
- License (L1): Raphaël James, Algorithmique et Structures de données, 28h, Université Paris Saclay
- Master (M1/M2): Caroline Appert, Experimental Design and Analysis, 21h, Université Paris Saclay
10.2.1 Supervision
- PhD in progress: Raphaël James, Environnements de réalité physique et augmentée utilisés dans l'analyse visuelle collaborative, since October 2018, Advisors: Anastasia Bezerianos, Olivier Chapuis
- PhD in progress: Emmanuel Courtoux, Tangible Collaborative Interaction for Wall-sized Displays, since October 2019, Advisors: Olivier Chapuis, Caroline Appert
- PhD in progress : Mehdi Chakhchoukh, CHORALE: Collaborative Human-Model Interaction to Support Multi-Criteria Decision Making in Agronomy, since October 2020, Advisors: Anastasia Bezerianos, Nadia Boukhelifa
- PhD in progress : Lijie Yao, Situated/embedded visualizations in motion and mobile visualizations, since October 2020, Advisors: Petra Isenberg (EPC Aviz), Anastasia Bezerianos
- PhD in progress : Vincent Cavez, Post-WIMP Data Wrangling, since October 2021, Advisors: Emmanuel Pietriga, Caroline Appert
- PhD in progress : Theo Bouganim, Interactive Exploration of Semi-structured Document Collections and Databases, since October 2022, Advisors: Ioana Manolescu (EPC Cedar), Emmanuel Pietriga
- PhD in progress : Camille Dupré, Interactive content manipulation in Mixed Reality, since November 2022, Advisors: Caroline Appert, Emmanuel Pietriga
- PhD in progress : Gaëlle Clavelin, Interaction gestuelle dans les environnements d'affichage multi-dispositifs, since December 2022, Advisors: Eric Lecolinet (Telecom ParisTech), Olivier Chapuis, Jan Gugenheimer (Telecom ParisTech)
- M2 internship: Sophie Chen, Browsing the Web with an AR-enhanced Phone, 6 months. Advisors: Caroline Appert, Emmanuel Pietriga
- M2 internship: Camille Dupré, AR-enhanced Remote Interaction with Wall-sized Displays, 6 months. Advisors: Caroline Appert, Olivier Chapuis
- M2 internship: Johann Elquilbec, Scalable Storylines Visualizations for Hypergraphs Exploration, 6 months. Advisors: Anastasia Bezerianos, Vanessa Peña-Araya
- M2 internship: Xiang Wei, Visualization of Uncertainty in Multidimensional Data with Spatial Distribution, 6 months. Advisors: Anastasia Bezerianos, Vanessa Peña-Araya
- TER M2: Camille Dupré, DixitVR: Understanding Collaborative Virtual Reality Using a Story Telling Task. Advisors: Olivier Chapuis
- TER M1: Jacobo Ruiz. Evaluating Trust in Interactive Machine Learning Systems.
- L3 internship: Julien Berry, Navigation Synchrone en réalité virtuelle, 3 months. Advisors: Olivier Chapuis
10.2.2 Juries
- PhD: Balita Rakotonarivo, Institut Supérieur de l’Aéronautique et de l’Espace: Emmanuel Pietriga (rapporteur)
- PhD: Gaëlle Candel, ENS: Anastasia Bezerianos (examinatrice)
- PhD: Elizabeth Walton, Université Paris-Saclay: Caroline Appert (présidente)
- PhD: Adnane Guettaf, Université Polytechnique Hauts-de-France: Caroline Appert (rapporteure)
10.2.3 Education
- Activity supervisor, Rendez-vous des jeunes mathématiciennes et informaticiennes 2022: Emmanuel Courtoux
- Activity supervisor, Fête de la science 2022: Emmanuel Courtoux
10.2.4 Interventions
- Invited talk, Interacting with Maps, HCI Winter School, Paris Saclay: Caroline Appert, Emmanuel Pietriga
- Speaker at Olympiades de Mathématiques de l'académie de Créteil: Emmanuel Courtoux
11 Scientific production
11.1 Major publications
- 1 inproceedingsARPads: Mid-air Indirect Input for Augmented Reality.ISMAR 2020 - IEEE International Symposium on Mixed and Augmented RealityISMAR '20Porto de Galinhas, BrazilIEEENovember 2020, 13 pages
- 2 articleUnderstanding How In-Visualization Provenance Can Support Trade-off Analysis.IEEE Transactions on Visualization and Computer GraphicsMay 2022
- 3 inproceedingsWallTokens: Surface Tangibles for Vertical Displays.Proceedings of the international conference on Human factors in computing systemsCHI 2021 - International conference on Human factors in computing systemsCHI '21Yokoama / Virtual, JapanACMMay 2021, 13 pages
- 4 articleS-Paths: Set-based visual exploration of linked data driven by semantic paths.Open Journal Of Semantic WebSeptember 2020, 1-18
- 5 articleAnimation Plans for Before-and-After Satellite Images.IEEE Transactions on Visualization and Computer Graphics24January 2018
- 6 articleHyperStorylines: Interactively untangling dynamic hypergraphs.Information VisualizationSeptember 2021, 1-21
- 7 articleA Comparison of Visualizations for Identifying Correlation over Space and Time.IEEE Transactions on Visualization and Computer GraphicsOctober 2019
- 8 articleExpressive Authoring of Node-Link Diagrams with Graphies.IEEE Transactions on Visualization and Computer Graphics274April 2021, 2329-2340
- 9 inproceedingsSpaceInk: Making Space for In-Context Annotations.UIST 2019 - 32nd ACM User Interface Software and TechnologyNouvelle-Orleans, United StatesOctober 2019
- 10 inproceedingsDesigning Coherent Gesture Sets for Multi-scale Navigation on Tabletops.Proceedings of the 36th international conference on Human factors in computing systemsCHI '18Montreal, CanadaACMApril 2018, 142:1-142:12
11.2 Publications of the year
International journals
International peer-reviewed conferences
Conferences without proceedings
Reports & preprints
11.3 Cited publications
- 22 bookData on the Web: From Relations to Semistructured Data and XML.Morgan Kaufmann1999
- 23 inproceedingsThe ERC Webdam on Foundations of Web Data Management.Proc. of the 21st International Conference Companion on World Wide WebWWW '12 CompanionACM2012, 211--214URL: 10.1145/2187980.2188011
- 24 inproceedingsLooking behind bezels: french windows for wall displays.Proceedings of the International Working Conference on Advanced Visual InterfacesAVI '12Capri Island, ItalyACM2012, 124--131URL: http://doi.acm.org/10.1145/2254556.2254581
- 25 inproceedingsRouteLens: Easy Route Following for Map Applications.Proceedings of the International Working Conference on Advanced Visual InterfacesAVI '14ACM2014, 125--128
- 26 inproceedingsHigh-precision magnification lenses.Proceedings of the 28th international conference on Human factors in computing systemsCHI '10Atlanta, Georgia, USAACM2010, 273--282
- 27 inproceedingsOrthoZoom Scroller: 1D Multi-scale Navigation.Proceedings of the SIGCHI Conference on Human Factors in Computing SystemsCHI '06New York, NY, USAMontréal, Québec, CanadaACM2006, 21--30URL: http://doi.acm.org/10.1145/1124772.1124776
- 28 articleMultisurface Interaction in the WILD Room.IEEE Computer4542012, 48-56
- 29 inproceedingsThe coordinative functions of flight strips: air traffic control work revisited.Proceedings of the international ACM SIGGROUP conference on Supporting group workGROUP '99Phoenix, Arizona, United StatesACM1999, 101--110URL: http://doi.acm.org/10.1145/320297.320308
- 30 bookSemiology of Graphics.University of Wisconsin Press1983
- 31 inproceedingsExtending the Vocabulary of Touch Events with ThumbRock.Proceedings of Graphics InterfaceGI '13Regina, Saskatchewan, CanadaCIPS2013, 221-228
- 32 inproceedingsA Case Study of Using Analytic Provenance to Reconstruct User Trust in a Guided Visual Analytics System.2021 IEEE Workshop on TRust and EXpertise in Visual Analytics (TREX)New Orleans, United StatesIEEEOctober 2021, 45-51
- 33 inproceedingsAR-enhanced Widgets for Smartphone-centric Interaction.MobileHCI '21 - 23rd International Conference on Mobile Human-Computer InteractionACMToulouse, FranceSeptember 2021
- 34 inproceedingsSmarties: An Input System for Wall Display Development.CHI '14Toronto, CanadaACMApril 2014, 2763-2772
- 35 inproceedingsUnderstanding File Access Mechanisms for Embedded Ubicomp Collaboration Interfaces.Proceedings of the 11th International Conference on Ubiquitous ComputingUbiComp '09New York, NY, USAOrlando, Florida, USAACM2009, 135--144URL: http://doi.acm.org/10.1145/1620545.1620567
- 36 bookM. R.M. R. EndsleyD. G.D. G. JonesDesigning for Situation Awareness: an Approach to User-Centered Design.370 pagesCRC Press, Taylor & Francis2012
- 37 inproceedingsMulti-user, Multi-display Interaction with a Single-user, Single-display Geospatial Application.Proceedings of the 19th Annual ACM Symposium on User Interface Software and TechnologyUIST '06Montreux, SwitzerlandACM2006, 273--276URL: http://doi.acm.org/10.1145/1166253.1166296
- 38 inproceedingsData Series Progressive Similarity Search with Probabilistic Quality Guarantees.ACM SIGMOD International Conference on Management of DataPortland, United StatesJune 2020, 1857-1873
- 39 articleComparing Similarity Perception in Time Series Visualizations.IEEE Transactions on Visualization and Computer Graphics251October 2018, 523 - 533
- 40 articleComputer-Supported Cooperative Work: History and Focus.IEEE Computer275May 1994, 19--26URL: http://dx.doi.org/10.1109/2.291294
- 41 bookLinked Data: Evolving the Web into a Global Data Space.Morgan & Claypool2011
- 42 inproceedingsTangible Bits: Towards Seamless Interfaces Between People, Bits and Atoms.Proceedings of the ACM SIGCHI Conference on Human Factors in Computing SystemsCHI '97Atlanta, Georgia, USAACM1997, 234--241URL: http://doi.acm.org/10.1145/258549.258715
- 43 bookHuman-Computer Interaction Handbook: Fundamentals, Evolving Technologies, and Emerging Applications, 3rd Edition.CRC Press2012
- 44 inproceedingsEffects of Display Size and Navigation Type on a Classification Task.Proceedings of the 32nd international conference on Human factors in computing systemsCHI '14Toronto, CAACM2014, 4147-4156
- 45 inproceedingsShared Interaction on a Wall-Sized Display in a Data Manipulation Task.Proceedings of the 34th international conference on Human factors in computing systemsCHI '16SigCHI and ACMSan Jose, United StatesMay 2016, 1-12
- 46 articleMapMosaic: Dynamic Layer Compositing for Interactive Geovisualization.International Journal of Geographical Information Science319May 2017, 1818 - 1845
- 47 articleIs paper safer? The role of paper flight strips in air traffic control.ACM Trans. Comput.-Hum. Interact.64December 1999, 311--340URL: http://doi.acm.org/10.1145/331490.331491
- 48 inproceedingsTouchTokens: Guiding Touch Patterns with Passive Tokens.Proceedings of the 2016 CHI Conference on Human Factors in Computing SystemsCHI '16San Jose, CA, United StatesACMMay 2016, 4189-4202
- 49 bookVisualization Analysis and Design.CRC Press2014
- 50 inproceedingsHigh-precision pointing on large wall displays using small handheld devices.Proceedings of the SIGCHI Conference on Human Factors in Computing SystemsCHI '13Paris, FranceACM2013, 831--840URL: http://doi.acm.org/10.1145/2470654.2470773
- 51 articleMid-air Pointing on Ultra-Walls.ACM Transactions on Computer-Human Interaction225August 2015, 21:1--21:62
- 52 inproceedingsMulti-Touch Gestures for Discrete and Continuous Control.International Working Conference on Advanced Visual Interfaces (AVI)Como, ItalyMay 2014, 8
- 53 inproceedingsProspective Motor Control on Tabletops: Planning Grasp for Multitouch Interaction.Proceedings of the 32nd international conference on Human factors in computing systemsCHI '14Toronto, CAACM2014, 2893-2902
- 54 inproceedingsA Comparison of Geographical Propagation Visualizations.CHI '20 - 38th SIGCHI conference on Human Factors in computing systemsHonolulu, United StatesApril 2020, 223:1--223:14
- 55 inproceedingsA Toolkit for Addressing HCI Issues in Visual Language Environments.IEEE Symposium on Visual Languages and Human-Centric Computing (VL/HCC)IEEE Computer Society2005, 145-152
- 56 inproceedingsPointing and beyond: an operationalization and preliminary evaluation of multi-scale searching.CHI '07: Proceedings of the SIGCHI conference on Human factors in computing systemsSan Jose, California, USAACM Press2007, 1215--1224
- 57 inproceedingsSigma lenses: focus-context transitions combining space, time and translucence.CHI '08: Proceeding of the twenty-sixth annual CHI conference on Human factors in computing systemsFlorence, ItalyACM2008, 1343--1352
- 58 articleRepresentation-Independent In-Place Magnification with Sigma Lenses.IEEE Transactions on Visualization and Computer Graphics (TVCG)16032010, 455-467
- 59 inproceedingsBrowsing Linked Data Catalogs with LODAtlas.ISWC 2018 - 17th International Semantic Web ConferenceMonterey, United StatesSpringerOctober 2018, 137-153
- 60 inproceedingsRapid development of user interfaces on cluster-driven wall displays with jBricks.Proceedings of the 3rd ACM SIGCHI symposium on Engineering interactive computing systemsEICS '11Pisa, ItalyACM2011, 185--190URL: http://doi.acm.org/10.1145/1996461.1996518
- 61 inproceedingsDrilling into complex 3D models with gimlenses.Proceedings of the 19th ACM Symposium on Virtual Reality Software and TechnologyVRST '13SingaporeACM2013, 223--230URL: http://doi.acm.org/10.1145/2503713.2503714
- 62 inproceedingsJellyLens: Content-Aware Adaptive Lenses.UIST - 25th Symposium on User Interface Software and Technology - 2012Proceedings of the 25th Symposium on User Interface Software and TechnologyACMCambridge, MA, United StatesACMOctober 2012, 261-270
- 63 inproceedingsActiveInk: (Th)Inking with Data.CHI 2019 - The ACM CHI Conference on Human Factors in Computing SystemsCHI 2019 - Proceedings of the 2019 CHI Conference on Human Factors in Computing SystemsGlasgow, United KingdomACMMay 2019
- 64 articleThe Semantic Web Revisited.IEEE Intelligent Systems2132006, 96-101URL: 10.1109/MIS.2006.62
- 65 articleTangible User Interfaces: Past, Present, and Future Directions.Found. Trends Hum.-Comput. Interact.31–2January 2010, 1--137URL: http://dx.doi.org/10.1561/1100000026
- 66 bookDesigning the User Interface, 4th Edition.Pearson Addison Wesley2005
- 67 inproceedingsControlling widgets with one power-up button.Proceedings of the 26th annual ACM symposium on User interface software and technologyUIST '13St. Andrews, Scotland, United KingdomACM2013, 71--74URL: http://doi.acm.org/10.1145/2501988.2502025
- 68 inproceedingsSide pressure for bidirectional navigation on small devices.Proceedings of the 15th international conference on Human-computer interaction with mobile devices and servicesMobileHCI '13Munich, GermanyACM2013, 11--20URL: http://doi.acm.org/10.1145/2493190.2493199
- 69 articleScaleMaster 2.0: a ScaleMaster extension to monitor automatic multi-scales generalizations.Cartography and Geographic Information Science4032013, 192--200URL: http://dx.doi.org/10.1080/15230406.2013.809233
- 70 inproceedingsSocial Welfare to Assess the Global Legibility of a Generalized Map.International Conference on Geographic InformationSpringer2012, 198--211URL: http://dx.doi.org/10.1007/978-3-642-33024-7_15
- 71 inproceedingsCoordination of Tilt and Touch in One- and Two-Handed Use.Proceedings of the 32nd international conference on Human factors in computing systemsCHI '14Toronto, CAACM2014, 2001-2004
- 72 inproceedingsSketchSliders: Sketching Widgets for Visual Exploration on Wall Displays.Proceedings of the 33rd Annual ACM Conference on Human Factors in Computing SystemsACMSeoul, South KoreaApril 2015, 3255-3264
- 73 bookInformation visualization: perception for design.Elsevier2012
- 74 articleFoundational Issues in Touch-Screen Stroke Gesture Design - An Integrative Review.Foundations and Trends in Human-Computer Interaction52December 2012, 97-205