
2023Activity reportProject-TeamILDA
RNSR: 201521247J- Research center Inria Saclay Centre at Université Paris-Saclay
- In partnership with:CNRS, Université Paris-Saclay
- Team name: Interacting with Large Data
- In collaboration with:Laboratoire Interdisciplinaire des Sciences du Numérique
- Domain:Perception, Cognition and Interaction
- Theme:Interaction and visualization
Keywords
Computer Science and Digital Science
- A3.1.4. Uncertain data
- A3.1.7. Open data
- A3.1.10. Heterogeneous data
- A3.1.11. Structured data
- A3.2.4. Semantic Web
- A3.2.6. Linked data
- A5.1. Human-Computer Interaction
- A5.1.1. Engineering of interactive systems
- A5.1.2. Evaluation of interactive systems
- A5.1.5. Body-based interfaces
- A5.1.6. Tangible interfaces
- A5.1.9. User and perceptual studies
- A5.2. Data visualization
- A5.5.4. Animation
- A5.6.1. Virtual reality
- A5.6.2. Augmented reality
Other Research Topics and Application Domains
- B3.1. Sustainable development
- B3.2. Climate and meteorology
- B3.3. Geosciences
- B3.3.1. Earth and subsoil
- B3.5. Agronomy
- B5.9. Industrial maintenance
- B9.2. Art
- B9.5.3. Physics
- B9.5.6. Data science
- B9.6.7. Geography
- B9.7.2. Open data
- B9.11. Risk management
1 Team members, visitors, external collaborators
Research Scientists
- Emmanuel Pietriga [Team leader, INRIA, Senior Researcher, HDR]
- Caroline Appert [CNRS, Senior Researcher, HDR]
- Olivier Chapuis [CNRS, Researcher]
- Vanessa Pena Araya [INRIA, ISFP]
Faculty Member
- Anastasia Bezerianos [UNIV PARIS SACLAY, Professor, HDR]
Post-Doctoral Fellow
- Arthur Fages [CNRS, from Apr 2023]
PhD Students
- Vincent Cavez [INRIA]
- Mehdi Chakhchoukh [UNIV PARIS SACLAY, ATER]
- Gaëlle Clavelin [Telecom ParisTech]
- Emmanuel Courtoux [Université Paris-Saclay, until Mar 2023]
- Camille Dupre [BERGER-LEVRAULT, CIFRE]
- Raphaël James [Université Paris-Saclay, ATER, until Feb 2023]
Technical Staff
- Ludovic David [INRIA, Engineer]
- Olivier Gladin [INRIA, Engineer]
Interns and Apprentices
- Thibaut Guerin [Inria, Intern, from May 2023 until Jul 2023]
- Noemie Hanus [Inria, Intern, from May 2023 until Jul 2023]
- Abel Henry-Lapassat [Université Paris-Saclay, Intern, from May 2023 until Jul 2023]
- Damien Verani [Inria, Intern, from Mar 2023 until Aug 2023]
- Yuyan Zhao [Inria, Intern, from Apr 2023 until Sep 2023]
Administrative Assistant
- Katia Evrat [INRIA]
2 Overall objectives
Datasets are no longer just large. They are distributed over multiple networked sources and increasingly interlinked, consisting of heterogeneous pieces of content structured in elaborate ways. Our goal is to design data-centric interactive systems that provide users with the right data at the right time and enable them to effectively manipulate and share these data. We design, develop and evaluate novel interaction and visualization techniques to empower users in both mobile and stationary contexts involving a variety of display devices, including: smartphones and tablets, augmented reality glasses, desktop workstations, tabletops, ultra-high-resolution wall-sized displays.
Our ability to acquire or generate, store, process and query data has increased spectacularly over the last decade. This is having a profound impact in domains as varied as scientific research, commerce, social media, industrial processes or e-government. Looking ahead, technologies related to the Web of Data have started an even larger revolution in data-driven activities, by making information accessible to machines as semi-structured data 19. Indeed, novel Web-based data models considerably ease the interlinking of semi-structured data originating from multiple independent sources. They make it possible to associate machine-processable semantics with the data. This in turn means that heterogeneous systems can exchange data, infer new data using reasoning engines, and that software agents can cross data sources, resolving ambiguities and conflicts between them 38. As a result, datasets are becoming even richer and are being made even larger and more heterogeneous, but also more useful, by interlinking them 26.
These advances raise research questions and technological challenges that span numerous fields of computer science research: databases, artificial intelligence, communication networks, security and trust, as well as human-computer interaction. Our research is based on the conviction that interactive systems play a central role in many data-driven activity domains. Indeed, no matter how elaborate the data acquisition, processing and storage pipelines are, many data eventually get processed or consumed one way or another by users. The latter are faced with complex, increasingly interlinked heterogeneous datasets that are organized according to elaborate structures, resulting in overwhelming amounts of both raw data and structured information. Users thus require effective tools to make sense of their data and manipulate them.
We approach this problem from the perspective of the Human-Computer Interaction (HCI) field of research, whose goal is to study how humans interact with computers and inspire novel hardware and software designs aimed at optimizing properties such as efficiency, ease of use and learnability, in single-user or cooperative contexts of work.
ILDA aims at designing interactive systems that display the data and let users interact with them, aiming to help users better navigate and comprehend complex datasets represented visually, as well as manipulate them. Our research has been organized along three complementary axes, as detailed in Section 3.
3 Research program
3.1 Novel Forms of Display for Groups and Individuals
Participants: Caroline Appert, Anastasia Bezerianos, Olivier Chapuis, Vanessa Peña-Araya, Emmanuel Pietriga, Arthur Fages, Vincent Cavez, Gaëlle Clavelin, Emmanuel Courtoux, Camille Dupré, Raphaël James, Ludovic David, Olivier Gladin, Noémie Hanus, Abel Henry-Lapassat, Thibault Guérin.
Data sense-making and analysis is not limited to individual users working with a single device, but increasingly involves multiple users working together in a coordinated manner in multi-display environments involving a variety of devices. We investigate how to empower users working with complex data by leveraging novel types of displays and combinations of displays, designing visualizations adapted to their capabilities: ultra-high-resolution wall-sized displays ((Figure 1-d)), augmented reality glasses ((Figure 1-a & b)), pen + touch interactive surfaces ((Figure 1-c)), handheld devices such as smartphones and tablets ((Figure 1-a & b)), desktop workstations and laptops.
Being able to combine or switch between representations of the data at different levels of detail and merge data from multiple sources in a single representation is central to many scenarios. The foundational question addressed here is what to display when, where and how, so as to provide effective support to users in their data understanding and manipulation tasks. We target contexts in which workers have to interact with complementary views on the same data, or with views on different-but-related datasets, possibly at different levels of abstraction, and with a particular interest for multi-variate data ((Figure 1-c)) that have spatio-temporal attributes.
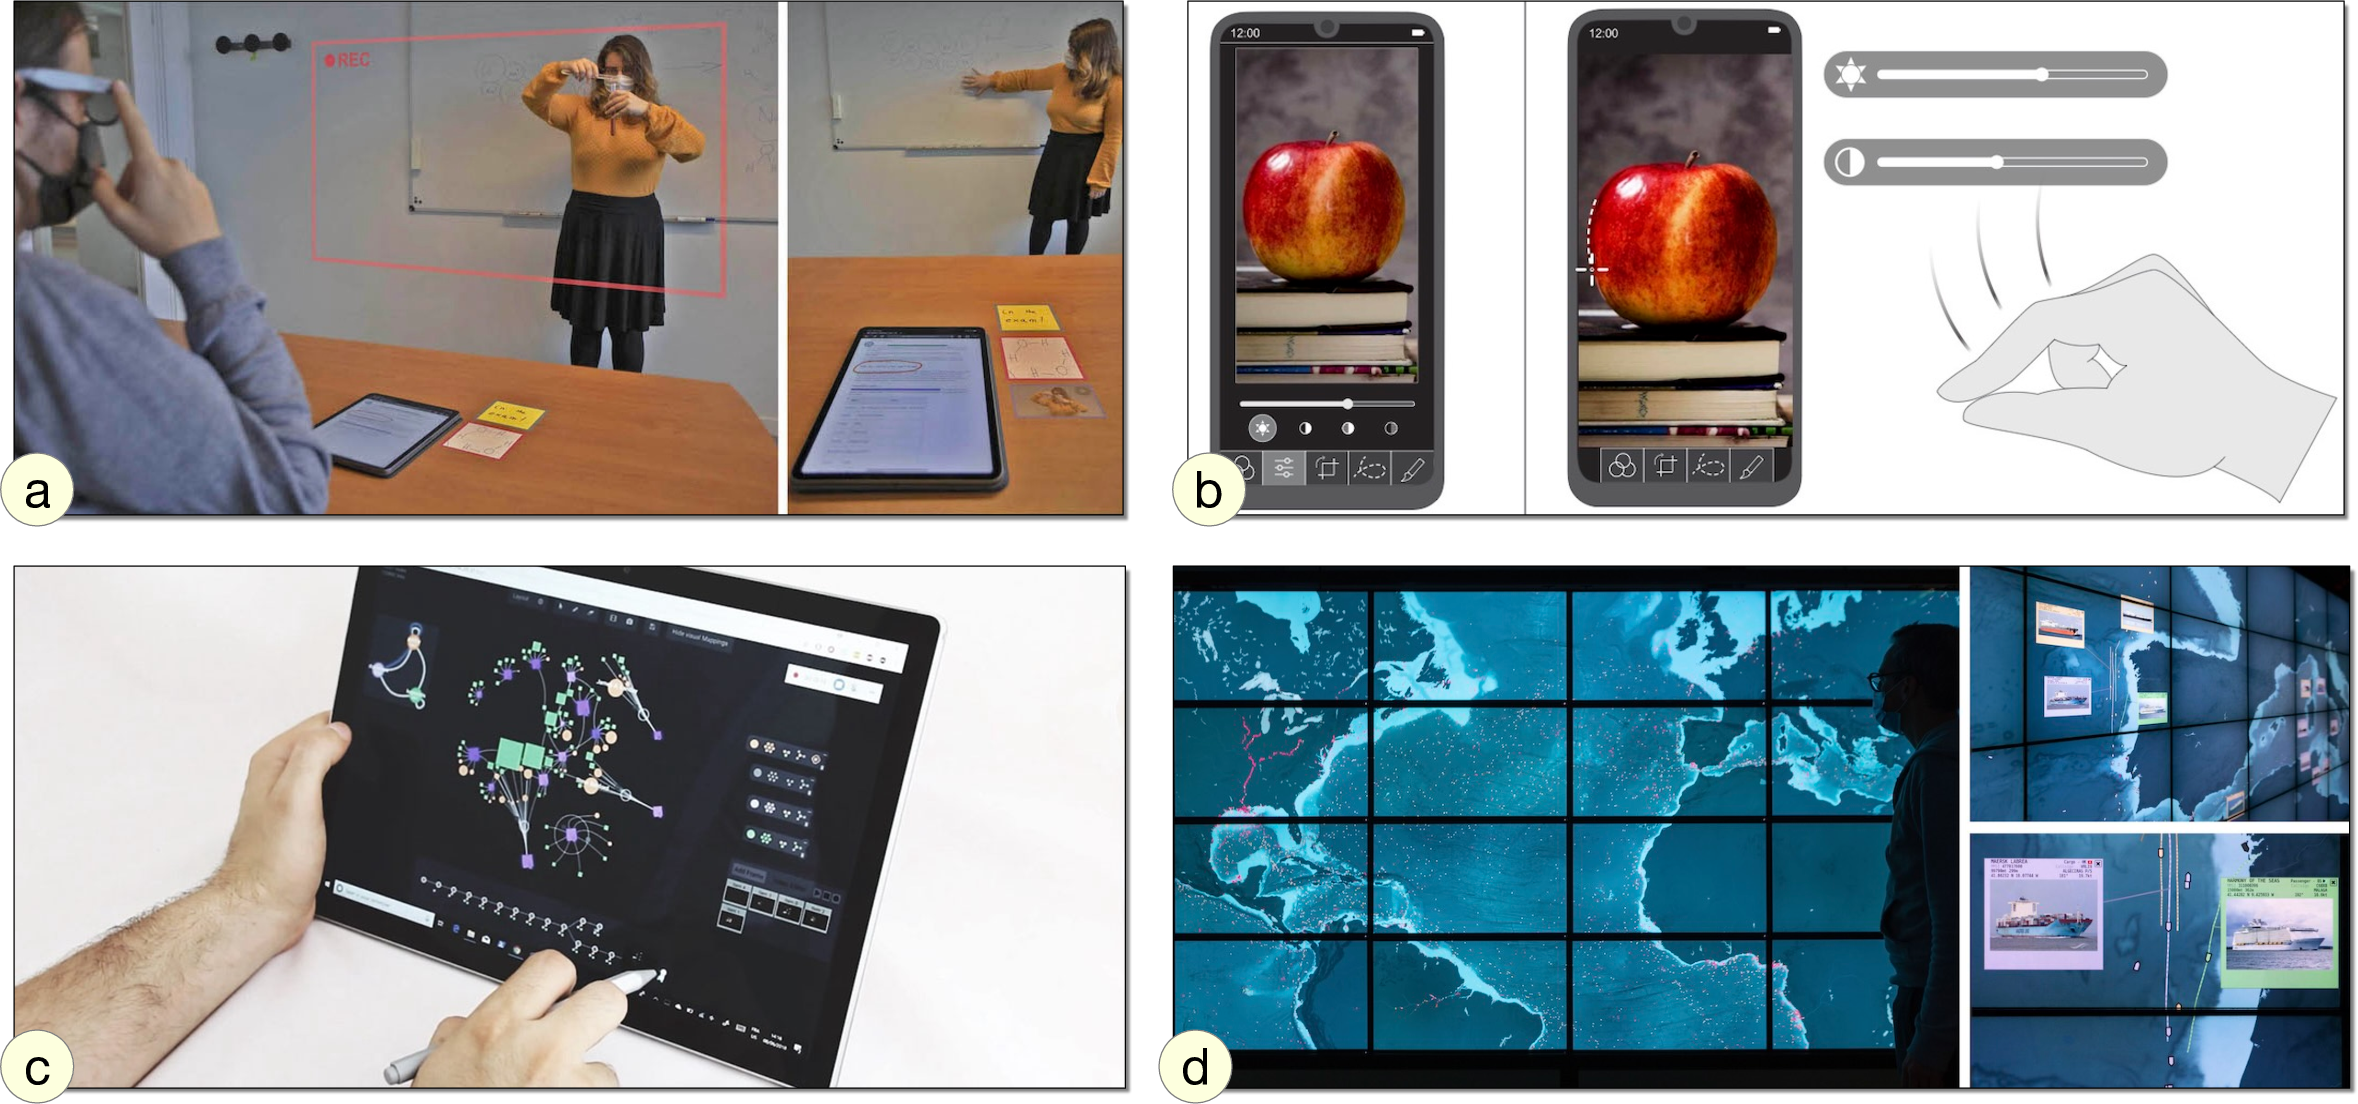
Our activity in this axis focuses on the following themes: 1) multi-display environments that include not only interactive surfaces such as wall displays but Augmented Reality (AR) as well; 2) the combination of AR and handheld devices; 3) geovisualization and interactive cartography on a variety of interactive surfaces including desktop, tabletop, handheld and wall displays.
Projects in which we research data visualization techniques for multi-display environments and for ultra-high-resolution wall-sized displays in particular often involve geographical information 32 (Figure 1-d). But we also research interaction and visualization techniques that are more generic. For instance we study awareness techniques to aid transitions between personal and shared workspaces in collaborative contexts that include large shared displays and desktops 34. We also investigate the potential benefits of extending wall displays with AR, for personal+context navigation 28 or to seamlessly extend the collaboration space around wall displays 5.
Augmented Reality, as a novel form of display, has become a strong center of attention in the team. Beyond its combination with wall displays, we are also investigating its potential when coupled with handheld displays such as smartphones or tablets. Coupling a mobile device with AR eyewear can help address some usability challenges of both small handheld displays and AR displays. AR can be used to offload widgets from the mobile device to the air around it ((Figure 1-b)), for instance enabling digital content annotation 24 ((Figure 1-a)).
Relevant publications by team members this year: 14, 16, 18.
3.2 Novel Forms of Input for Groups and Individuals
Participants: Caroline Appert, Anastasia Bezerianos, Olivier Chapuis, Emmanuel Pietriga, Arthur Fages, Vincent Cavez, Gaëlle Clavelin, Emmanuel Courtoux, Camille Dupré, Raphaël James, Olivier Gladin, Damien Verani.
The contexts in which novel types of displays are used often call for novel types of input. In addition, the interactive manipulation of complex datasets often calls for rich interaction vocabularies. We design and evaluate interaction techniques that leverage input technologies such as tactile surfaces, digital pens, 3D motion trackers and custom physical controllers built on-demand.
We develop input techniques that feature a high level of expressive power, as well as techniques that can improve group awareness and support cooperative tasks. When relevant, we aim to complement – rather than replace – traditional input devices such as keyboards and mouse, that remain very effective in contexts such as the office desktop.
We aim to design rich interaction vocabularies that go beyond what current interactive surfaces offer, which rarely exceeds five gestures such as simple slides and pinches. Designing larger interaction vocabularies requires identifying discriminating dimensions in order to structure a space of manipulations that should remain few and simple, so as to be easy to memorize and execute. Beyond cognitive and motor complexity, the scalability of vocabularies also depends on our ability to design robust recognizers that will allow users to fluidly chain simple manipulations that make it possible to interlace navigation, selection and manipulation actions. We also study how to further extend input vocabularies by combining multiple modalities, such as pen and touch, or mid-air gestures and tangibles. Gestures and objects encode a lot of information in their shape, dynamics and direction. They can also improve coordination among actors in collaborative contexts for, e.g., handling priorities or assigning specific roles to different users.
In recent years, there has been a tendency in the HCI community to uncritically rely on machine learning (ML) to solve user input problems. While we acknowledge the power and potential of AI to solve a broad range of problems, we are rather interested in trying to devise interaction techniques that are less resource-intensive and that do not require training the system. We tend to rely on analytical approaches rather than on ML-based solutions, using those as a last resort only.
Our activity in this axis focuses on the following themes: 1) direct manipulation on interactive surfaces using a combination of pen and touch; 2) tangible input for wall displays; 3) input in immersive environments with a strong emphasis on Augmented Reality (AR), either in mid-air or combined with a handheld device.
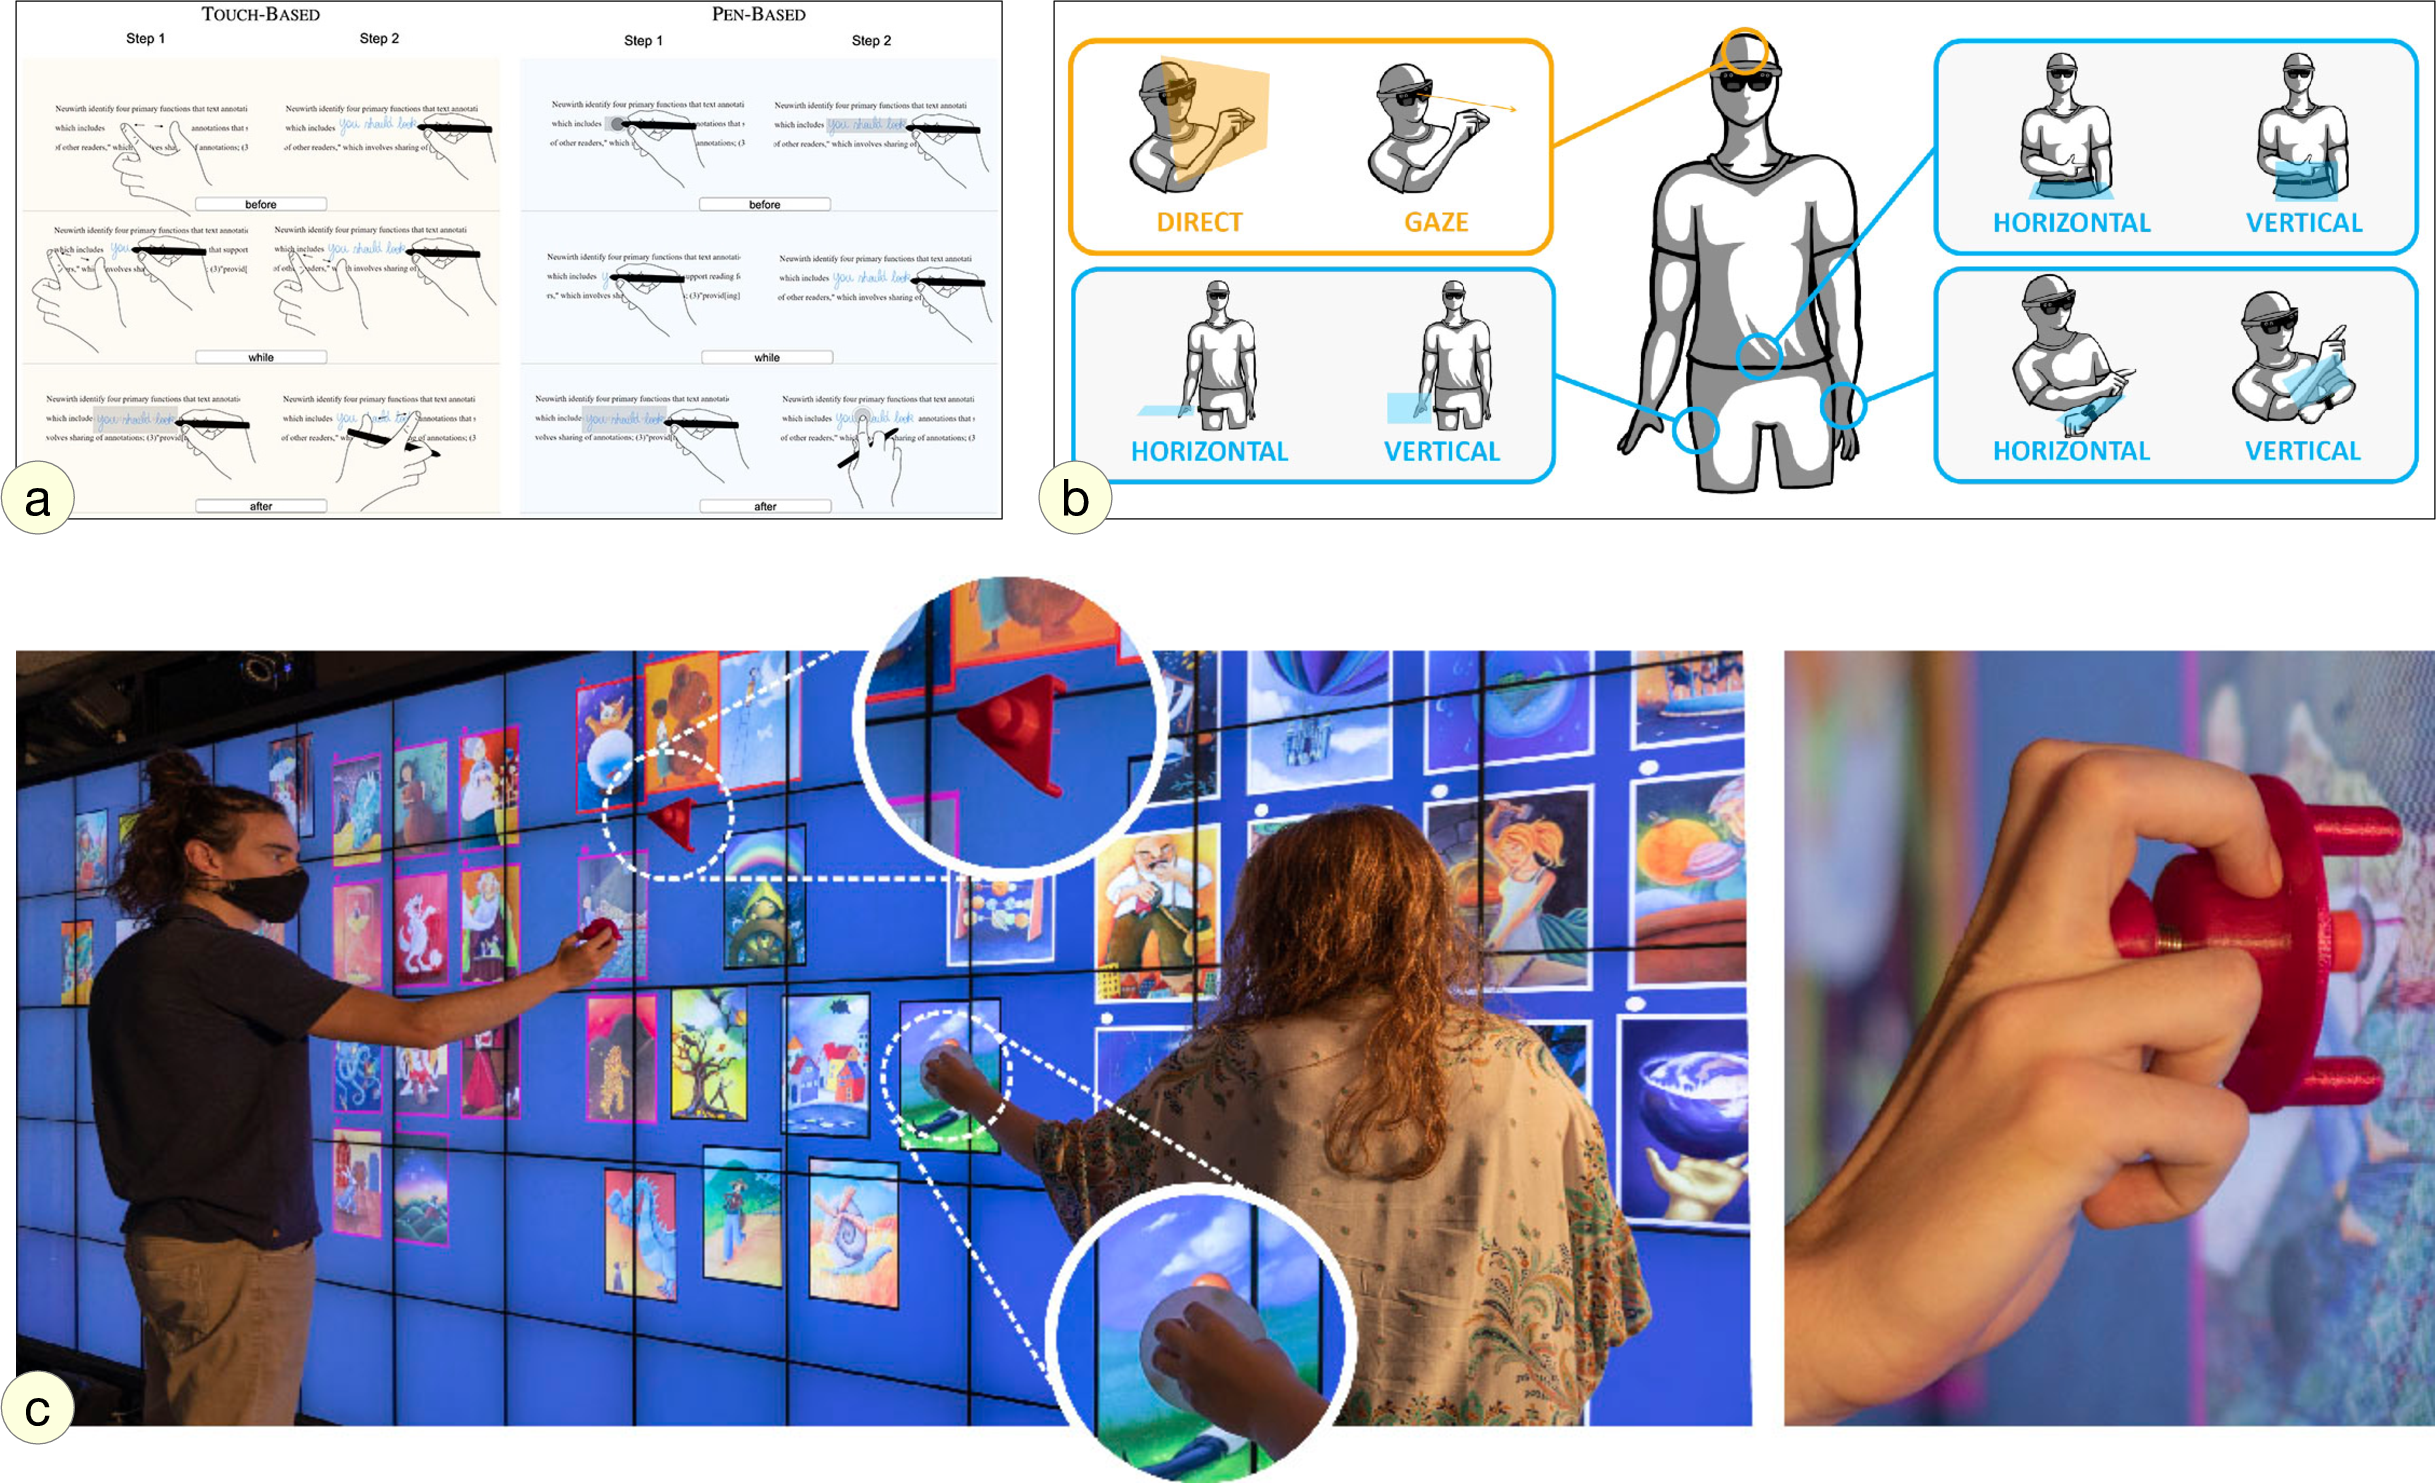
We investigate how pen and touch can be best combined to facilitate different tasks and activities: document annotation, where pen+touch techniques are used to make room for in-context annotations by dynamically reflowing documents 9 ((Figure 2-a)); heterogeneous dataset exploration and sensemaking 37, where that combination of modalities enables users to seamlessly transition between exploring data and externalizing their thoughts.
Following-up on earlier work in the team about tangible interaction using passive tokens on interactive surfaces 30, 29, 20, we investigate tangible interaction on vertical displays. Tangibles can enrich interaction with interactive surfaces, but gravity represents a major obstacle when interacting with a vertical display. We design solutions to this problem 4 ((Figure 2-c)), seeking to enable manipulations on vertical screens, in the air, or both 15.
As mentioned earlier, Augmented Reality is becoming a strong center of attention in the team as a display technology. Our research is not only about how to display data in AR, but how to interact with these data as well. For instance we study the concept of mid-air pads 1 ((Figure 2-b)) as an alternative to gaze or direct hand input to control a pointer in windows anchored in the environment (similar to the window-based UI showcased by Apple for the upcoming Vision Pro). Supporting indirect interaction, ARPads allow users to control a pointer in AR through movements on a mid-air plane.
When used in combination with another device, AR enables displaying additional information in the physical volume around that device. But AR also enables using that volume to interact with the device, providing new input possibilities, as we have started investigating with the design and evaluation of AR-enhanced widgets for smartphones 21. The AR technology is not only used to offload widgets from the phone to the air around it, but to give users more control on input precision as well.
Relevant publications by team members this year: 11, 15, 17.
3.3 Interacting with Diverse Data
Participants: Caroline Appert, Anastasia Bezerianos, Olivier Chapuis, Vanessa Peña-Araya, Emmanuel Pietriga, Theo Bouganim, Mehdi Chakhchoukh, Ludovic David, Srijan Sarkar, Yuyan Zhao.
Research in data management is yielding novel models that enable diverse structuring and querying strategies, give machine-processable semantics to the data and ease their interlinking. This, in turn, yields datasets that can be distributed at the scale of the Web, highly-heterogeneous and thus rich but also quite complex. We investigate ways to leverage this richness from the users' perspective, designing interactive systems adapted to the specific characteristics of data models and data semantics of the considered application area.
The general research question addressed in this part of our research program is how to design novel interaction techniques that help users manipulate their data more efficiently. By data manipulation, we mean all low-level tasks related to manually creating new data, modifying and cleaning existing content (data wrangling), possibly merging data from different sources.
We envision interactive systems in which the semantics and structure are not exposed directly to users, but serve as input to the system to generate interactive representations that convey information relevant to the task at hand and best afford the possible manipulation actions.
Our activity in this axis focuses on the following themes: 1) browsing webs of linked data; 2) visualization of multivariate networks; 3) visualization of hypergraphs; 4) visualization for decision making.
Early work in the team had focused on enabling users to explore large catalogs of linked data 33 by querying dataset metadata and contents originating from multiple sources; and interactive systems that let users explore the contents of those linked datasets. We work on new navigation paradigms, for instance based on the concept of semantic paths (SWJ, 23) which create aggregated views on collections of items of interest by analyzing the chains of triples that constitute knowledge graphs and characterizing the sets of values at the end of the paths formed by these chains.
While a central idea of the above system is to display information without ever exposing the underlying semi-structured directed labeled graph, we also research novel ways to visualize and manipulate multivariate networks represented as such ((Figure 1-c)), as there are contexts in which the structure of the data – knowledge graphs or else – is important to convey. To this end, we investigate novel ways to represented complex structures and visually encode the attributes of the entities that compose these structures. This can be, e.g., using motion as an encoding channel for edge attributes in multivariate network visualizations 35, 36. Or it can be by letting users build representations of multivariate networks incrementally using expressive design techniques 8 (Figure 1-c).
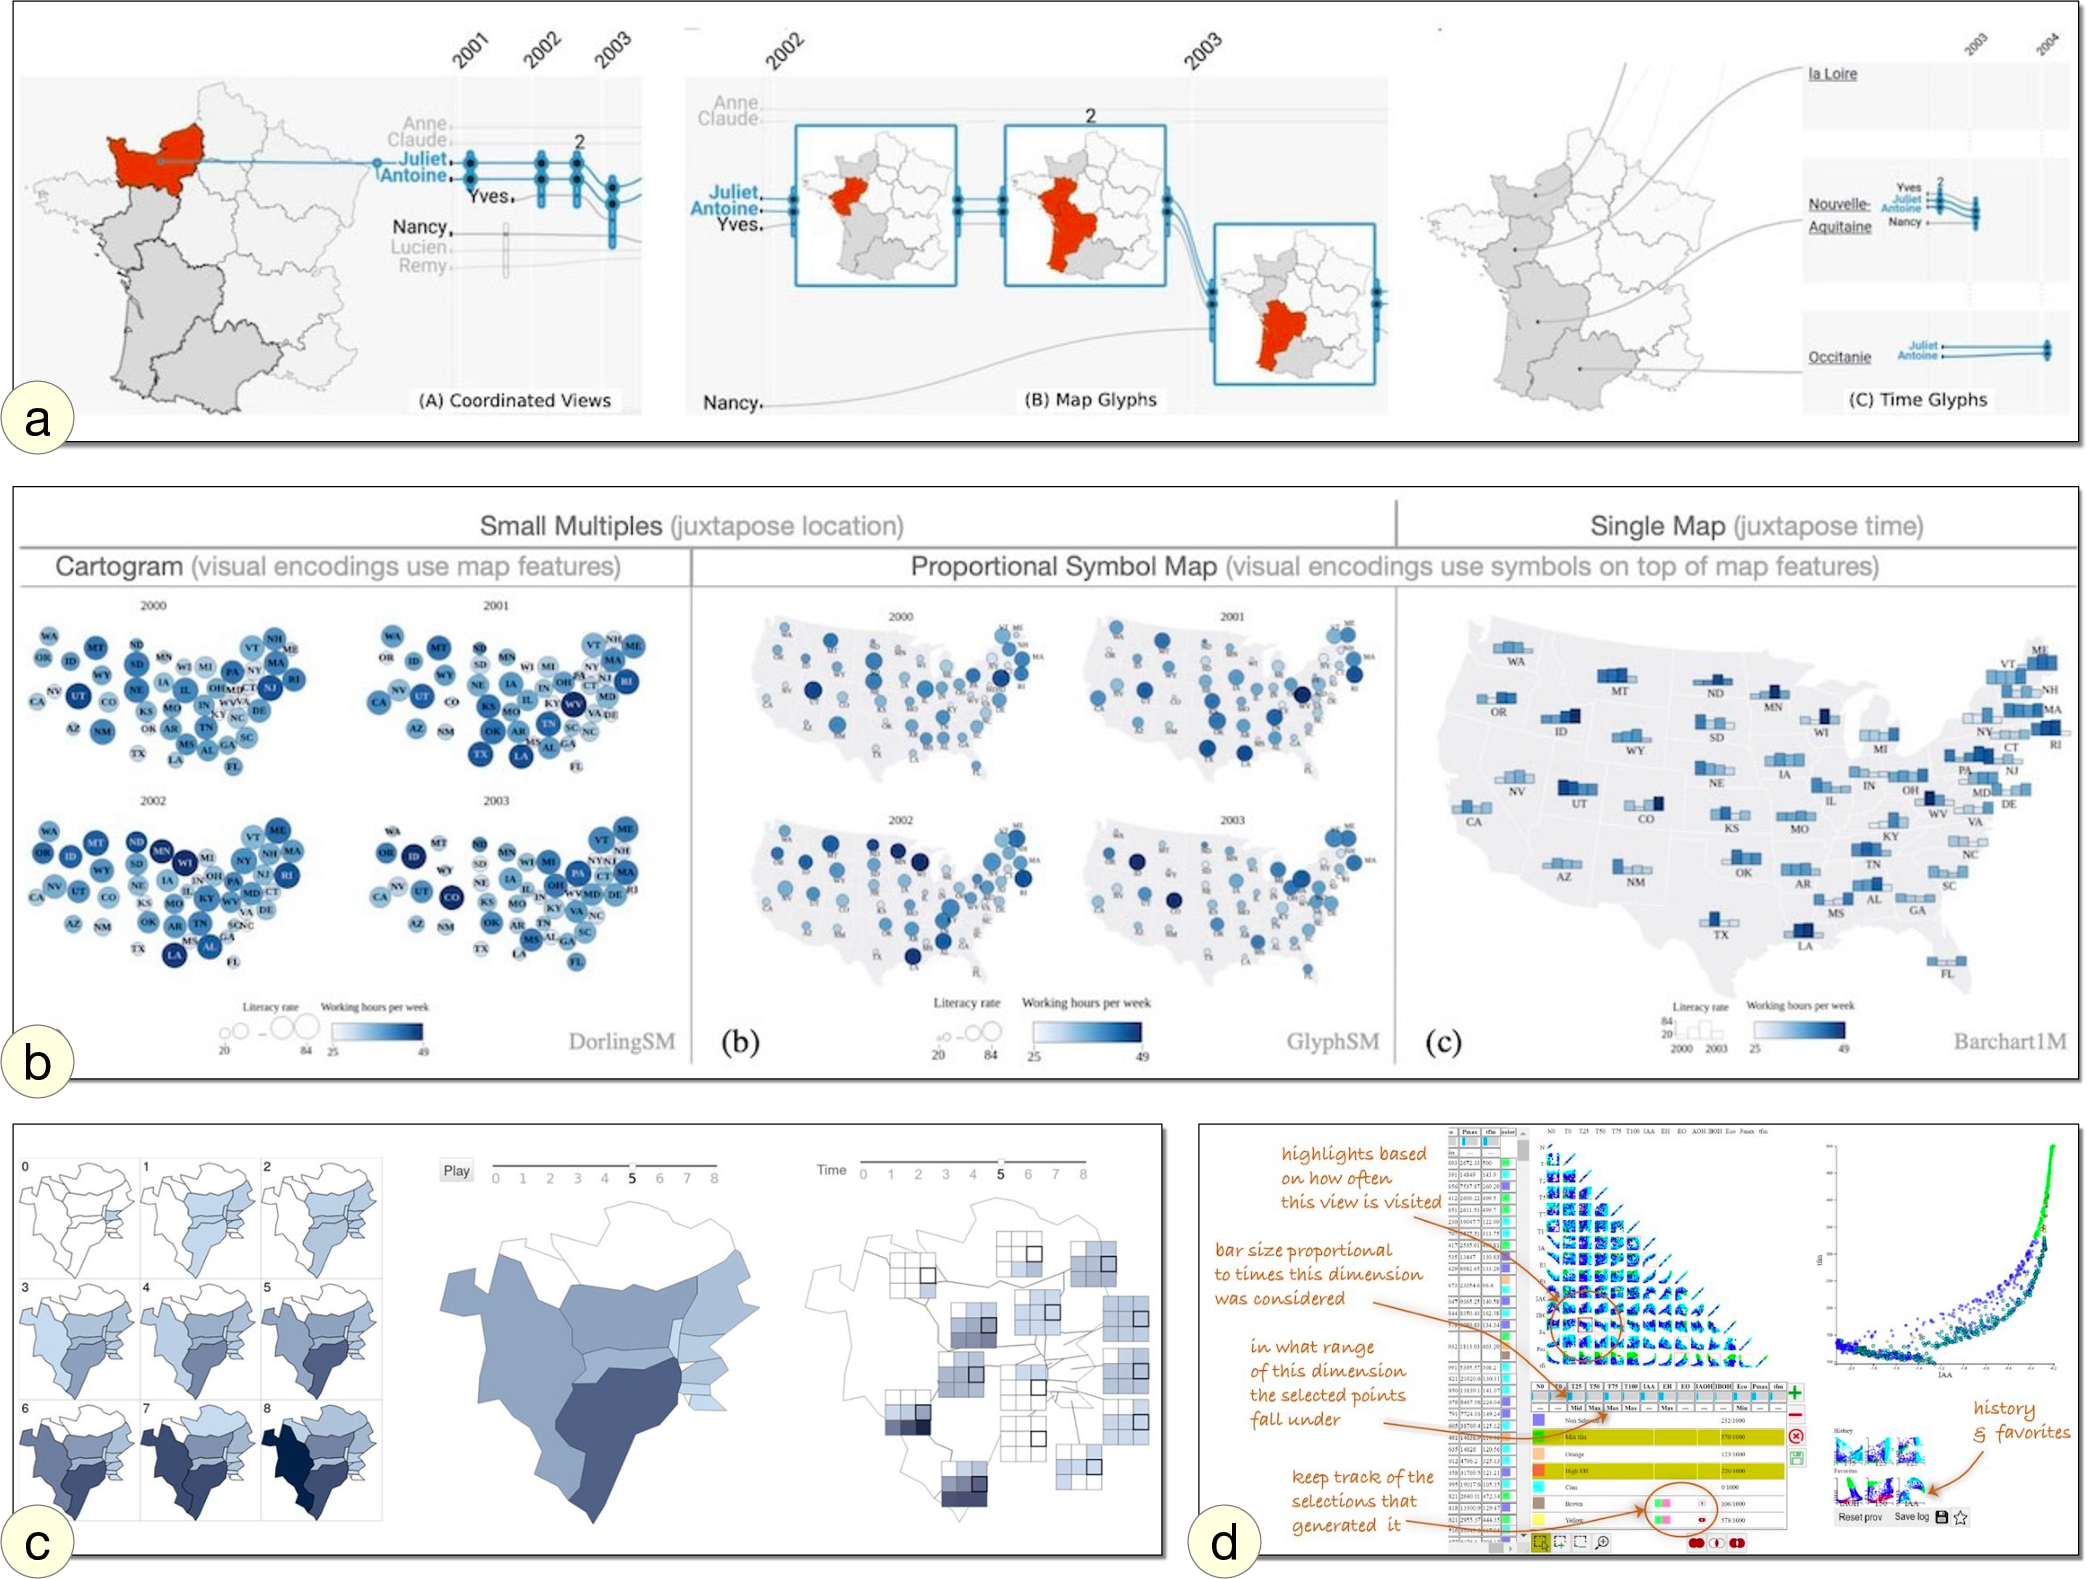
Multivariate networks and knowledge graphs are very expressive data structures that can be used to encode many different types of data. They are sometimes not sufficient, however. In some situations, even more elaborate structures are required, such as hypergraphs, which enable relating more than two vertices with a single edge and are notoriously difficult to visualize. We investigate visualization techniques for data modeled as hypergraphs, for instance in the area of data journalism by generalizing Storyline visualizations to display the temporal evolution of relationships involving multiple types of entities such as, e.g., people, locations, and companies 6, 27 (Figure 3-a).
As mentioned above, interactive cartography has been an active topic in the team since 2015 when we started a collaboration with IGN – the French national geographic institute. Project MapMuxing was about interactive cartography on a variety of surfaces, including tabletops 10 and wall displays 32, but on desktop workstations as well. Since then, our work has expanded to include geovisualization. We investigate research questions about the display of multivariate data that have a spatial – and sometimes temporal – component 7 (Figure 3-b) and that evolve over time 31 (Figure 3-c).
In this research axis we also investigate visualization to support decision making. While the above projects mostly consider visualization for the purpose of data exploration, the visual representation of data can also be an effective tool for promoting situation awareness and helping subject-matter experts make decisions. The design and development of user interfaces for major astronomical observatories – which dates back to 2009 with ALMA and is still on-going with CTA (Cherenkov Telescope Array) – has been and still is an important part of our research & development activities. But we also investigate this broad topic in other contexts. For instance, as part of a long-term collaboration with INRAe about the design of trade-off analysis systems 3 for experts in domains such as agronomy or manufacturing ((Figure 3-d)).
4 Application domains
4.1 Mission-critical Systems
Mission-critical contexts of use, which include emergency response & management; critical infrastructure operations such as public transportation systems, communications and power distribution networks; and the operation of large scientific instruments such as astronomical observatories and particle accelerators. Central to these contexts of work is the notion of situation awareness 25. Our goal is to investigate novel ways of interacting with computing systems that improve collaborative data analysis capabilities and decision support assistance in a mission-critical, often time-constrained, work context.
4.2 Exploratory Analysis of Scientific Data
Many scientific disciplines are increasingly data-driven, including astronomy, molecular biology, particle physics, or neuroanatomy. No matter their origin (experiments, remote observations, large-scale simulations), these data can be difficult to understand and analyze because of their sheer size and complexity. Our goal is to investigate how data-centric interactive systems can improve scientific data exploration.
5 New software, platforms, open data
All software developed by ILDA team members can be found on the ILDA software page. There was no major public release this year.
5.1 New platforms
Participants: Caroline Appert, Anastasia Bezerianos, Olivier Chapuis, Vanessa Peña-Araya, Emmanuel Pietriga, Emmanuel Courtoux, Raphaël James, Olivier Gladin.
Both the WILD-512K and WILDER platforms are now part of funded project ANR EquipEx+ Continuum (ANR-21-ESRE-0030). Figure 4 illustrates usage of a Unity-based software library under development to render very large FITS images at high frame rates.
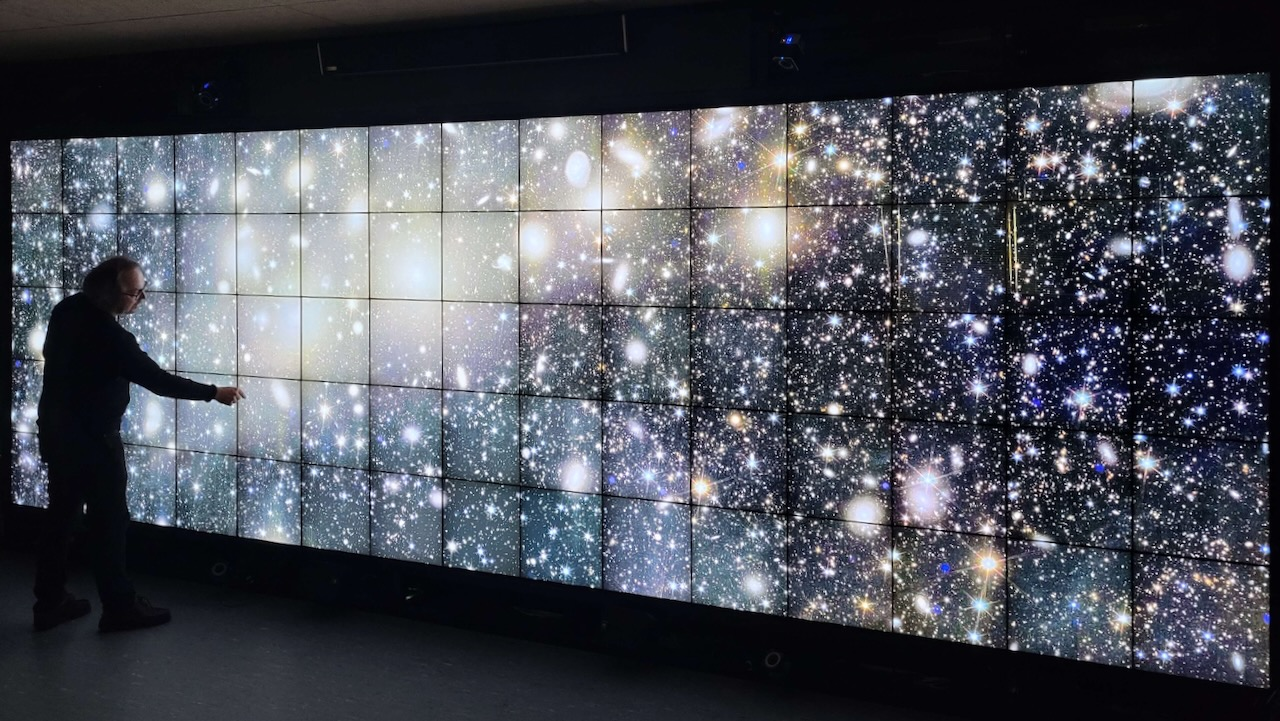
Picture of the WILDER ultra wall displaying astronomical images.
6 New results
6.1 Novel Forms of Display for Groups and Individuals
Participants: Anastasia Bezerianos, Olivier Chapuis, Raphaël James.
Wall displays have been an active topic of research in the team for many years. They are well suited for collaborative work as they can accommodate multiple people simultaneously. They are used to analyze or monitor large quantities of data, in research, operations monitoring and control, and in the industry. They are nonetheless heavy physical displays that are hard to move and expensive to reconfigure and extend. But, they are often placed in rooms with ample space in front of them to allow multiple users to move, space that remains largely unused. While wall dis- plays are not easy to physically reconfigure or extend, the physical space available in front of them provides a unique opportunity to extend them virtually, for example, through Augmented Reality (AR).
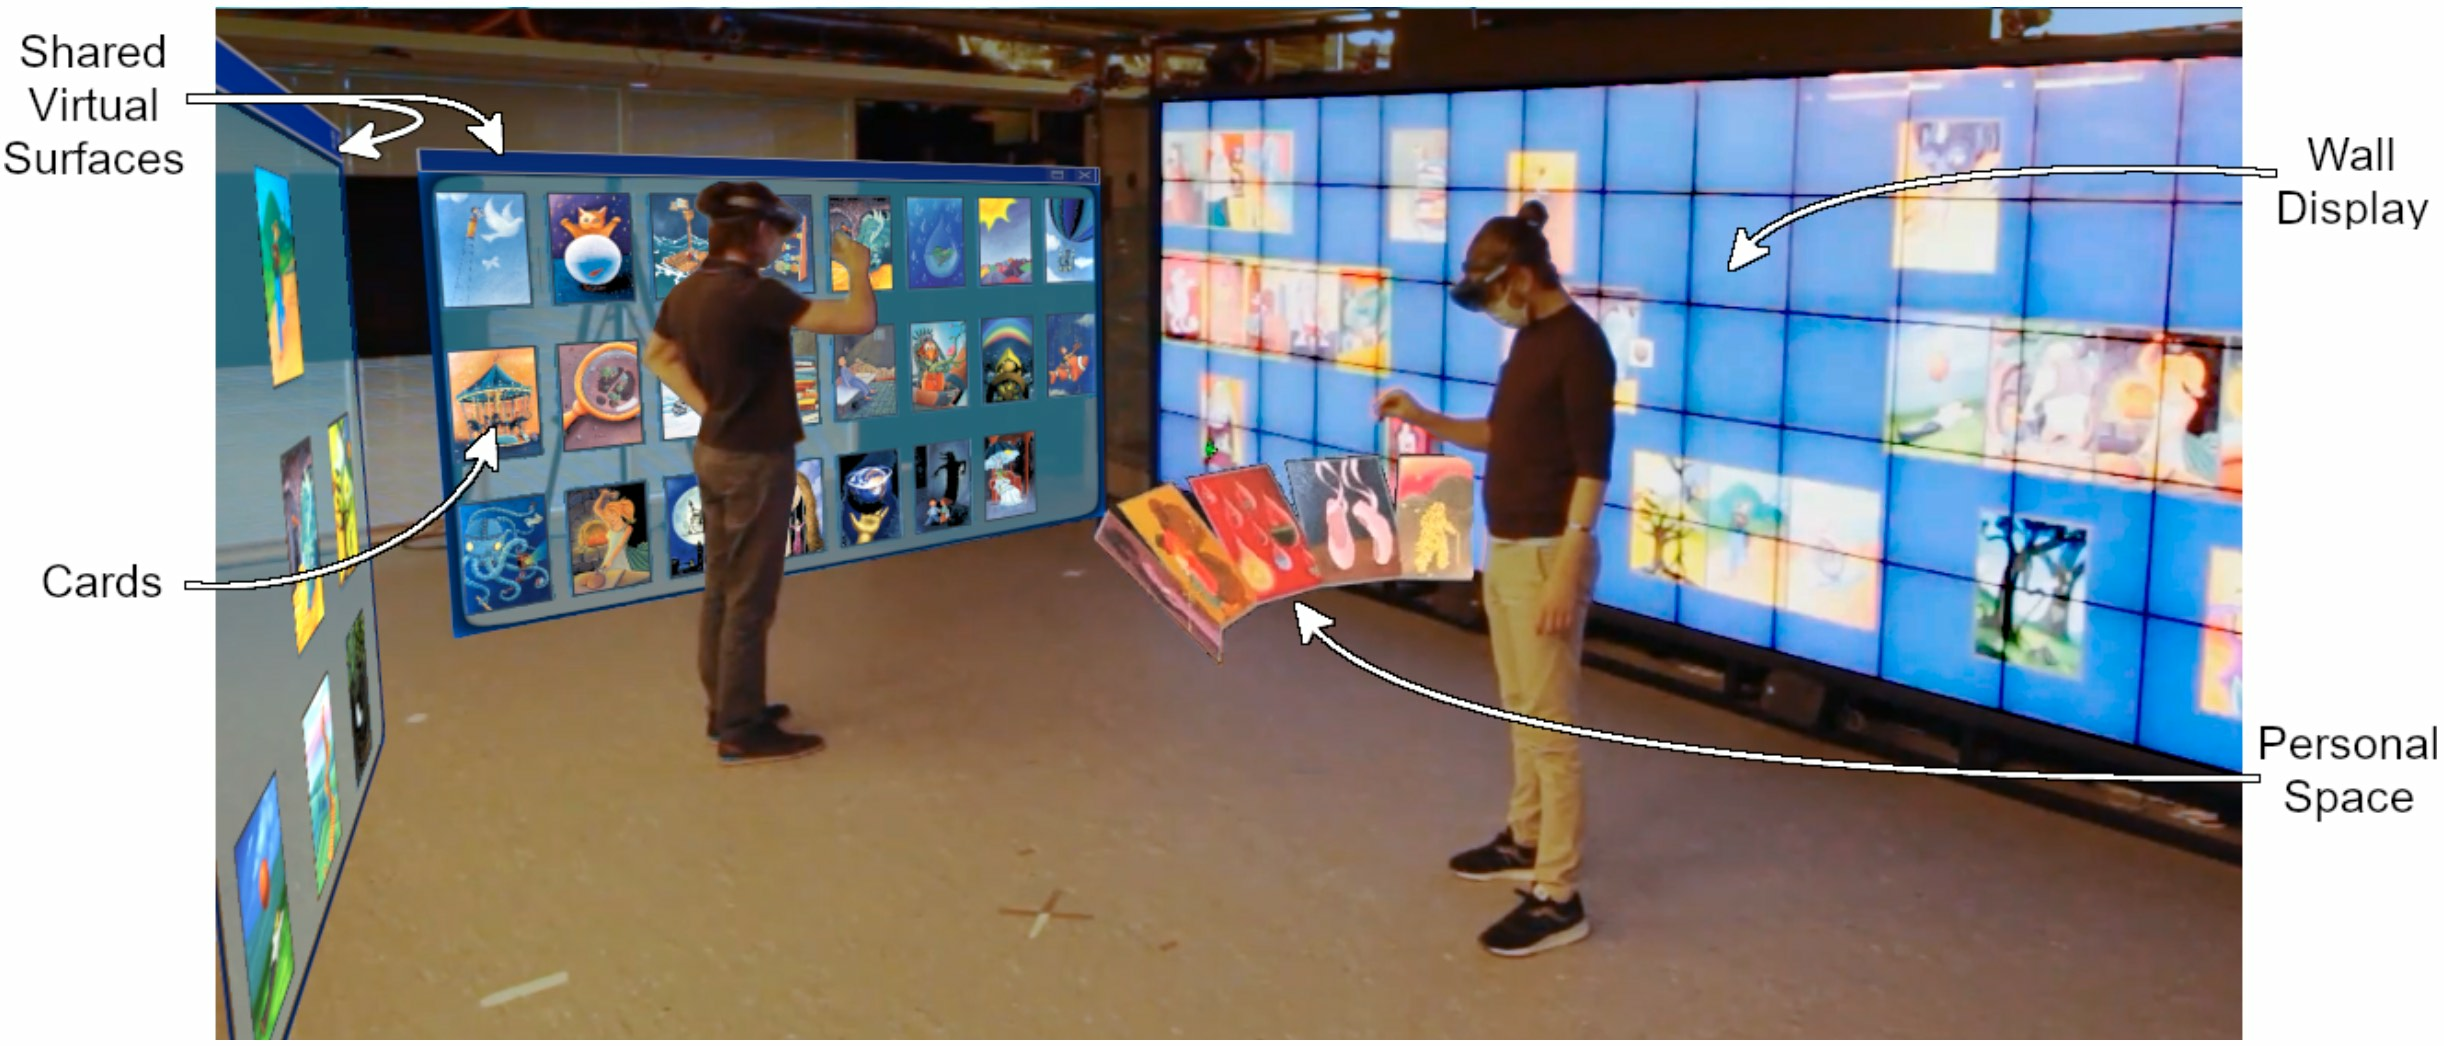
We set out to empirically study the impact of extending wall displays with AR in collaborative contexts 16. In particular, we focused on fundamental questions regarding differences in the use of space (physical and virtual) and the impact on collaboration before and after adding AR. As a first step, we implemented a prototype that allows users to use the virtual space around a wall display (Figure 5). This Wall+AR system adds virtual space in the form of surfaces, and combines several tech- niques for users to organize, manipulate and move content between the wall display and the virtual space. We then used this system to run a comparative study with pairs of participants conducting collaborative tasks, using only the wall display or the wall display extended with AR headsets.
Our comparison highlights that with the Wall+AR system, participants extensively used the physical space in front of the wall display. Virtual surfaces were used for storing, discarding, and presenting data. Surprisingly, participants often used the virtual surfaces as their main interactive workspace, abandoning the wall display. We observed that adding AR to a wall display creates interaction overhead, such as physical and mental demand. Nevertheless, it also brings a real benefit over using the wall alone: the Wall+AR system is preferred and found more enjoyable and efficient than the wall alone, and we did not measure any loss in performance despite the interaction overhead.
Our research about novel forms of displays considers a wide range of display sizes and configurations. Beyond stationary displays such as walls and desktop workstations, we investigate mobile displays including handheld devices and wearable ones such as near-eye augmented reality and wristworn smartwatches. In collaboration with researchers from project-team Aviz, we contributed to a study investigating the effectiveness of visualizations on smartwatches. The study focused on the comnpraison of multiple glanceable part-to-whole proportion representations on smartwatch faces 14. The goal was to understand how quickly and accurately people can make judgments about their progress toward multiple goals displayed in a small space. The three studies were designed to have an increasing level of external validity. The first study compared bar charts, radial bar charts, and text representations-shown with a digital time display. The second study added an analog time dial as a distractor to increase the complexity of the watch face. To emulate realistic viewing conditions, the third study investigated the effect of viewing angles. In Study 1 bar and radial bar charts outperformed text representations. In Study 2 adding an analog time dial as a distractor did not affect task performance. In Study 3 only the most extreme angle led to some performance decrease.
6.2 Novel Forms of Input for Groups and Individuals
Participants: Caroline Appert, Vincent Cavez, Olivier Chapuis, Emmanuel Courtoux, Emmanuel Pietriga.
The wall displays mentioned in the previous section not only facilitate collaborative work. They also allow users to work with a very large and high-resolution workspace. These display surfaces enable two levels of interaction. Users can come close to the display to see details, but they can also step back to get a wider view of the workspace. The interaction space is thus not limited to the display surface itself but also encompasses the physical space in front of it, where users should be able to move freely. Designing input techniques that effectively work across this large interaction space is challenging, however.
Bare-hand input may be considered the most intuitive interaction technique for interacting with wall displays. But while bare-hand input has the advantage of keeping users' hands free, it also raises important challenges in terms of interaction design. In particular, as the design space of hand movements is unstructured yet constrained and user-dependent, designing bare-hand input that is steady, accurately recognized and that does not collide with regular hand movements is very difficult. Even an action as simple as clicking is challenging to design and implement. As a result, interaction with wall displays often involves a handheld device that serves as a remote controller. While this offers a good solution for indirect control, it requires users to always hold a device and it does not integrate smoothly with direct touch interaction on the wall display.
Taking inspiration from tabletop interaction techniques, some systems rely on tangible controllers to interact with vertical displays. Recent empirical results suggest that such tangible controllers are even more efficient and more comfortable than touch gestures for manipulating virtual objects displayed on the wall. When their design makes it possible for users to attach them to the surface, users can free their hands at will. They can also easily switch between multiple tangibles. However, existing tangible controllers are limited as they support interaction either on the display surface itself or in the air, but not both. This is a strong limitation with vertical displays that afford movements in space to interact either up close or from afar.
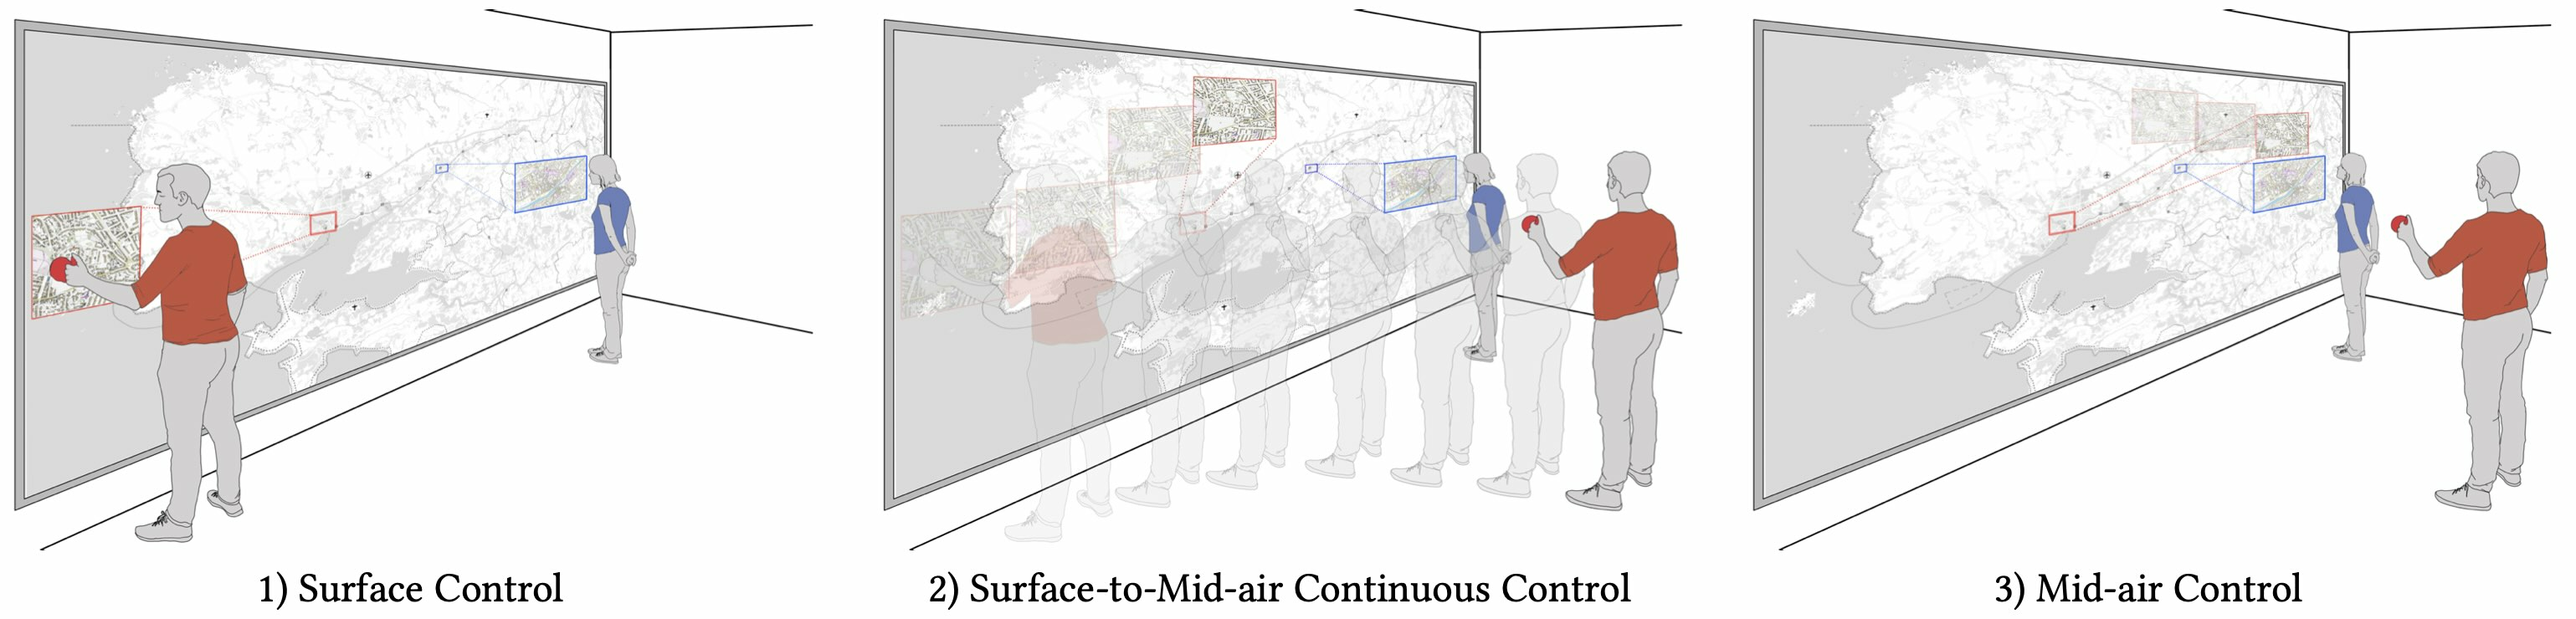
To alleviate this limitation, we designed SurfAirs 15, a new generation of controllers for vertical displays that support various interaction styles. As illustrated in Figure 6, users can manipulate them on screen (surface input), in the air (mid-air input) and transition from the surface to the air during a single manipulation (hybrid input). A SurfAir can be attached to, and detached from the vertical surface, making it easy for users to free their hands or grab another SurfAir. We ran two user studies that compared SurfAirs' performance with bare-hand input for both mid-air and hybrid input, in which participants prefered and performed better with SurfAirs.
Our research about novel forms of input for groups and individuals is not limited to wall displays but encompasses a broad range of devices including tabletops, augmented reality, desktop workstations and interactive surfaces operated with pen and touch. Interactive data manipulations are particularly challenging to perform on the latter, no matter how simple they are, including tabular data in spreadsheet programs. A key characteristic of those programs is that the grid effectively creates a layer above the values, which plays a central role in enabling many of the direct manipulations that users perform on the spreadsheet's columns, rows and cells. But because it covers the entire workspace, this grid layer captures most input events, often complicating straightforward tasks like selecting a substring within a cell. Additionally, spreadsheet programs designed for interactive surfaces introduce yet another layer that captures basic touch actions for the purpose of navigation.
These three layers create tension between the different types of interactions: grid-level interactions (cell, row and column selection & manipulation); value-level interactions (text, number and formula editing); and navigation interactions (panning and zooming the worksheet). This tension between layers often breaks the direct manipulation paradigm, where users expect to effortlessly select an element and manipulate it. This tension exists even when performing the most elementary action: selection. While it is easy to select a single cell, selecting only part of a text or number inside a cell is tedious, requiring multiple actions to traverse the grid and adjust the selection. Additional problems occur when selecting sets of elements. Selecting elements such as, e.g., rows or columns is possible but interferes with navigation actions when all elements are not visible simultaneously. And while spreadsheets are designed to manipulate sets of cells, it is never possible to select only a part of the value across multiple cells at once. Such manipulations are useful though, for instance to select a specific suffix such as the country code in a list of cities to remove them all, or to separate surname from firstname in a list of people with a single manipulation.
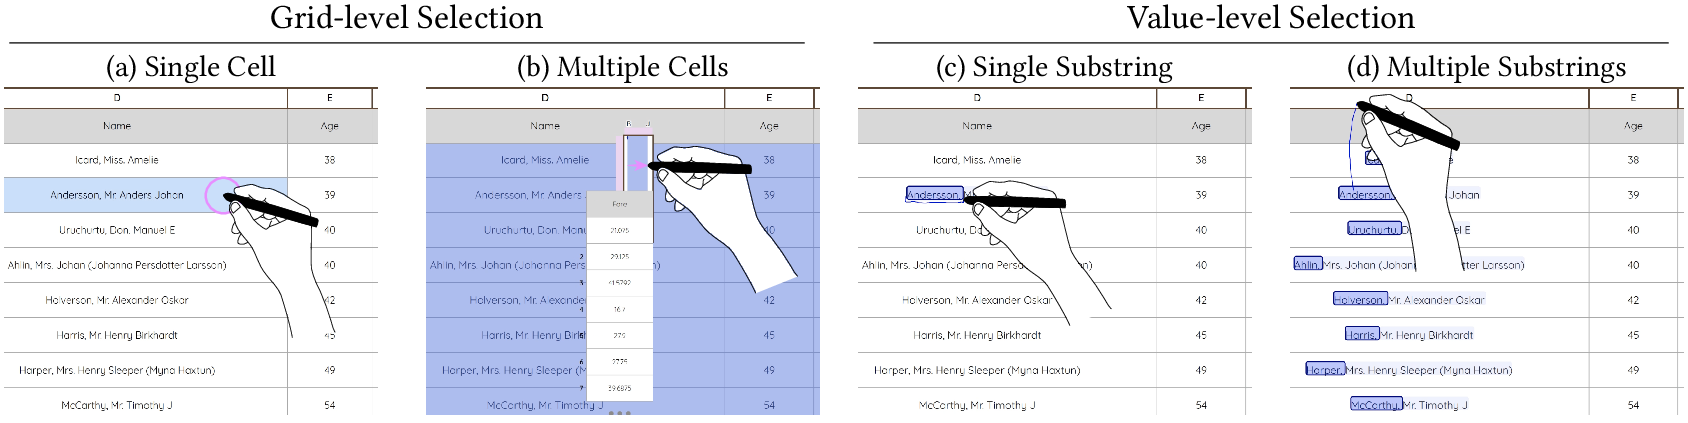
We developed a set of novel direct manipulation techniques 2 that enable seamless interaction at both grid and value levels, within and across cells, as illustrated in Figure 7. With these techniques, users can achieve diverse operations with a few pen marks and touch actions. We implemented a clear division of labor between input modalities, dedicating the pen to selection, touch to manipulation, and multi-touch to navigation. A key element of our approach is to use the pen not only as a tool to select grid-level elements, but as a tool to break through the grid as well, enabling precise, seamless value-level selections without mode switching. We further leverage the pen's unique precision to design small pen-operated widgets that users can invoke to jump to distant locations in the spreadsheet or to perform advanced, non-contiguous selections of tabular data rows and columns.
We conducted an elicitation study to gather empirical data about users' expectations when using pen + touch to interact with spreadsheets. We then designed a set of interaction techniques that enable seamless access to all layers, leveraging the expressive power of pen + touch input to enable the effortless selection of a variety of elements in spreadsheets. These elements include individual cells, groups of cells, as well as values and substrings within cells or spanning multiple cells. We implemented this set of interaction techniques in a prototype that we used to conduct a semi-structured qualitative study with six information workers performing a variety of spreadsheet operations on their own data, observing how they used the techniques, and gathering feedback to improve on them.
6.3 Interacting with Diverse Data
Participants: Anastasia Bezerianos, Vanessa Peña-Araya.
Many of our research projects about the interactive visualization and manipulation of complex datasets are informed by the needs of subject-matter experts in specific application areas. One of them is geology, and tephrochronology in particular. Tephrochronology studies the deposits of explosive volcanic eruptions in the stratigraphic record. Tephrochronology is of great use in some volcanic zones of the Andes, for instance. There, it can be used to improve chronologies of paleoenvironmental records in Patagonia; as well as to identify areas likely to be affected by volcanic eruptions in the future, essential for producing volcanic hazard maps. The close proximity of many volcanic centers with recurrent explosive activity, which have very similar geochemical compositions, and very often poor age constraints, represent a challenge for the study of tephrochronology in the region. In addition to this, the ever-growing amount of tephrochronological information in the area, dispersed in different types of publications which vary greatly in format, makes the integration of the data produced by different actors, and consecutively its interpretation, increasingly difficult.
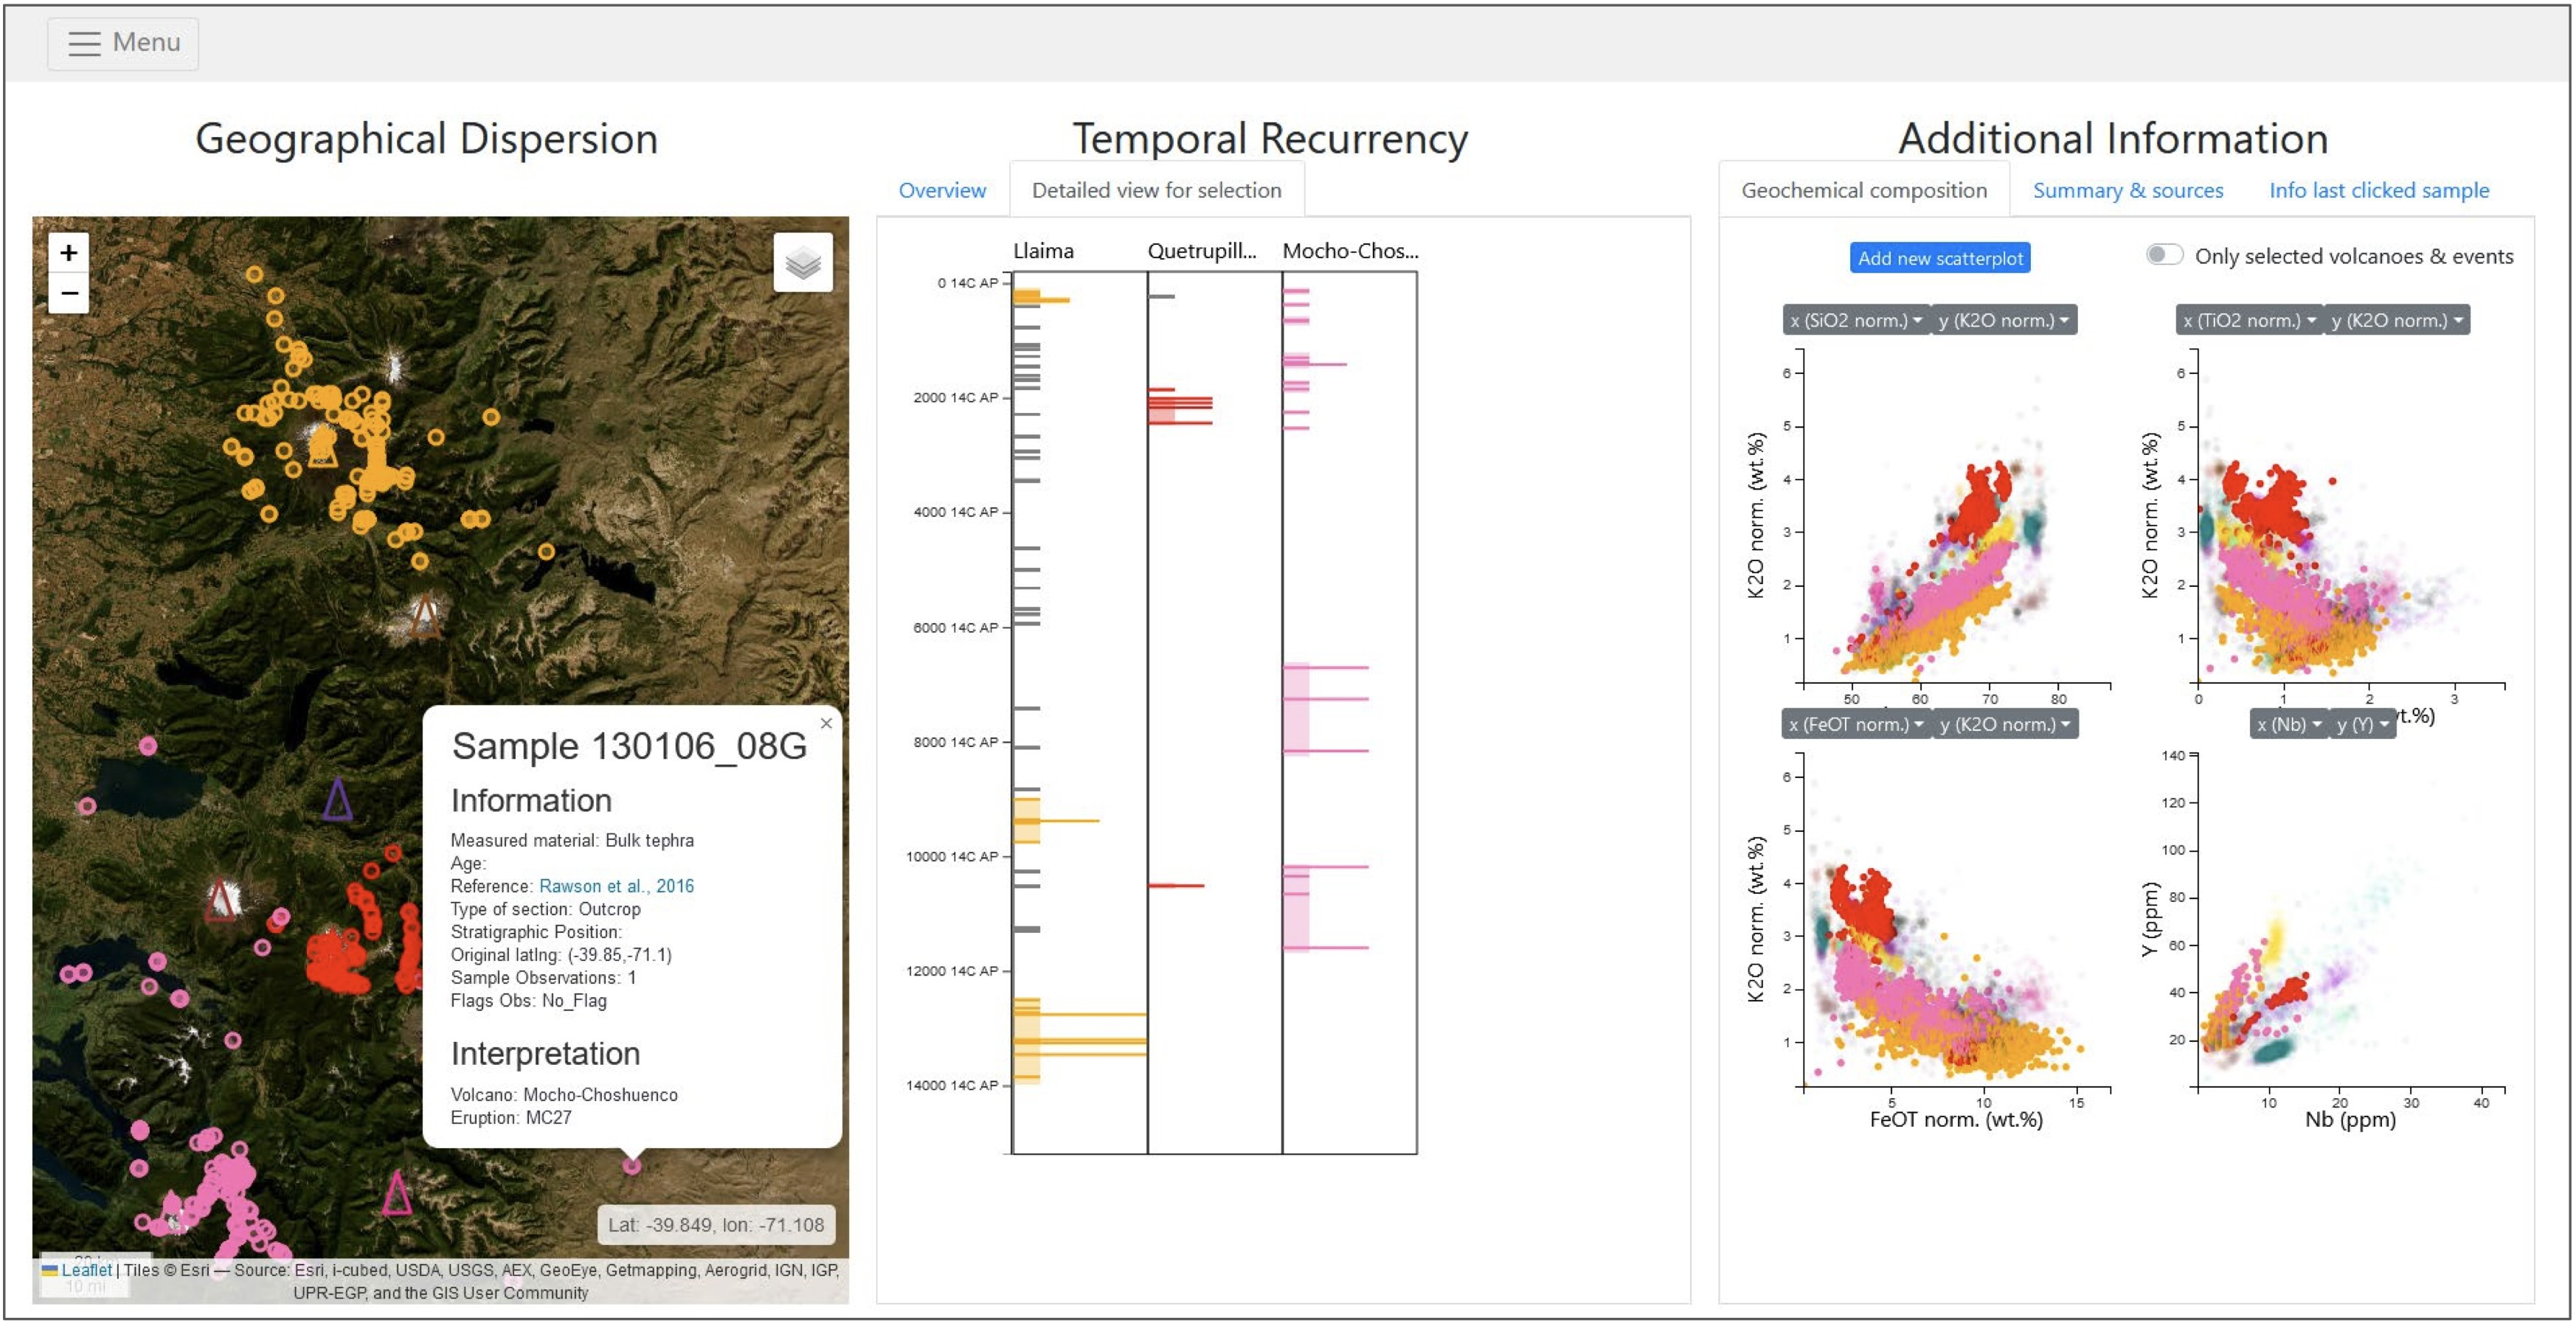
We collaborated with geologists, contributing to project BOOM! to address this issue 13. BOOM! is a compiled dataset that integrates about 30 years of research on 32 active volcanic centers and 132 different eruptions, which took place during the last 20,000 years. To help users find and reuse data in the large dataset, we developed an online platform which provides user-friendly tools to explore it, and helps users download subsets of it (Figure 8). To integrate this very heterogeneous information, special attention was given to include information which allows users to evaluate data quality and comparability, as well as to provide tools in the explorer for users to filter data by different criteria. The integration of this dataset opens new perspectives for the development of novel visualizations of tephrochronological data, for example, to better understand the multidimensional uncertainties associated with it. For example, uncertainties associated with analytical precision, with age estimates of both tephra deposits and volcanic eruptions, and of tephra classification. Additionally, it allows for the use of robust statistical tools to correlate tephra deposits, including those based on machine learning algorithms.
7 Bilateral contracts and grants with industry
Participants: Caroline Appert, Camille Dupré, Emmanuel Pietriga.
7.1 Bilateral contracts with industry
- Berger-Levrault: ANRT/CIFRE PhD (Camille Dupré), 3 years, November 2022-October 2025 on the topic of Interactive content manipulation in Mixed Reality for maintenance applications.
8 Partnerships and cooperations
8.1 European initiatives
8.1.1 Other european programs/initiatives
Participants: Ludovic David, Emmanuel Pietriga.
Deutsches Elektronen-Synchrotron (DESY): Scientific collaboration on the design and implementation of user interfaces for array operations monitoring and control for the Cherenkov Telescope Array (CTA) project, currently being built in the Canary Islands (Spain) and in the Atacama desert (Chile). May 2018 – October 2026. www.cta-observatory.org
8.2 National initiatives
8.2.1 EquipEx+ Continuum (ANR)
Participants: Caroline Appert, Anastasia Bezerianos, Olivier Chapuis, Vanessa Peña-Araya, Emmanuel Pietriga, Arthur Fages, Vincent Cavez, Gaëlle Clavelin, Emmanuel Courtoux, Camille Dupré, Raphaël James, Ludovic David, Olivier Gladin, Noémie Hanus, Abel Henry-Lapassat, Thibault Guérin.
ILDA participates to EquipEx+ project Continuum, a collaborative research infrastructure of 30 platforms located throughout France to advance interdisciplinary research based on interaction between computer science and the human and social sciences. Funded by the French National Research Agency (ANR) from 2021 to 2029. 19 academic institutions and 3 research organizations.
8.2.2 ANR Interplay
Participants: Caroline Appert, Olivier Chapuis, Arthur Fages.
Novel display technologies such as wall-sized displays, very large tabletops, and headsets for Virtual Reality or Augmented Reality make it possible to redesign workspaces for more flexibility and efficiency. The goal of the project is to study rich display environments from a human computer interaction perspective in order to inform the design of innovative workspaces for crisis management and data analysis. To reach this goal we will: (i) study the output capacities of these displays for distributing information across displays efficiently; (ii) use physical artefacts for facilitating navigation and interaction across displays; and (iii) use embodied gestures for portable and expert interactions across displays. Our studies will be informed by a real crisis management environment, and the results of the project will help redesign this environment. Coordinator: Olivier Chapuis. Funding: 629k€.
Partners:
- CEA Tech en Occitanie, Commissariat à l'Energie Atomique et aux Energies Alternatives.
- Institut de Recherche en Informatique de Toulouse (IRIT), Université de Toulouse.
- Laboratoire Traitement et Communication de l'Information, Télécom Paris & Institut Polytechnique de Paris.
9 Dissemination
Participants: Caroline Appert, Anastasia Bezerianos, Olivier Chapuis, Vanessa Peña-Araya, Emmanuel Pietriga, Vincent Cavez, Mehdi Chakhchoukh, Emmanuel Courtoux, Camille Dupré, Raphaël James, Olivier Gladin.
9.1 Promoting scientific activities
Member of the organizing committees
- ACM CHI Steering Committee (2019-...), ACM SIGCHI Conference on Human Factors in Computing Systems: Caroline Appert
- IEEE VIS Executive Committee (2021-...), Visualization Conference: Anastasia Bezerianos
- Journée Visu co-organizer: Vanessa Peña-Araya
- IEEE VIS Ombud (2022-...): Anastasia Bezerianos
9.1.1 Scientific events: selection
Member of the conference program committees
- ACM CHI 2024: Emmanuel Pietriga (AC - Associate Chair)
- ACM UIST 2023: Caroline Appert (AC - Associate Chair)
- IEEE VIS 2023: Vanessa Peña-Araya (AC - Associate Chair), Emmanuel Pietriga (AC - Associate Chair)
- ACM MobileHCI 2023: Olivier Chapuis (AC - Associate Chair)
- ACM ISS 2023: Vanessa Peña-Araya (AC - Associate Chair)
- PacificVis 2023 (journal track): Vanessa Peña-Araya (AC - Associate Chair)
Reviewer
- ACM CHI 2024: Caroline Appert, Vincent Cavez, Olivier Chapuis, Vanessa Peña-Araya
- ACM UIST 2023: Olivier Chapuis
- IEEE VIS 2023: Anastasia Bezerianos
- IEEE VR 2023: Olivier Chapuis
- ACM ISS 2023: Olivier Chapuis
- PacificVis 2023 (conference track): Vanessa Peña-Araya
- IHM 2023: Olivier Chapuis
9.1.2 Journal
Member of the editorial boards
- ACM ToCHI, Transactions on Computer-Human Interaction: Caroline Appert (Associate Editor)
Reviewer - reviewing activities
- ACM ToCHI, Transactions on Computer-Human Interaction: Emmanuel Pietriga
- IEEE TVCG, Transactions on Visualization and Computer Graphics: Anastasia Bezerianos, Olivier Chapuis, Vanessa Peña-Araya
9.1.3 Invited talks
- MIT-Chile Workshop: Vanessa Peña-Araya
9.1.4 Leadership within the scientific community
- Conseil Scientifique d'Institut (CNRS/INS2I): Caroline Appert
9.1.5 Scientific expertise
- Jury d'admission, CNRS INS2I: Caroline Appert (member)
9.1.6 Research administration
- Responsable du Département Interaction avec l'Humain (IaH) du LISN (UMR9015): Olivier Chapuis
- Director of pôle B de l'École Doctorale STIC Paris Saclay: Caroline Appert
- Member of Conseil de l'École Doctorale STIC Paris Saclay: Caroline Appert
- Member of Conseil de Laboratoire (LISN): Caroline Appert
- Conseil de Gouvernance (élue), Polytech, Université Paris-Saclay: Anastasia Bezerianos
- Member of Commissions Consultatives de Spécialistes d'Université (CCUPS) at Université Paris Saclay: Emmanuel Pietriga
- Co-head of the Polytech Département IIM: Informatique et Ingénierie Mathématique: Anastasia Bezerianos
9.2 Teaching - Supervision - Juries
- Ingénieur (X-3A)/Master (M1/M2): Emmanuel Pietriga, Data Visualization (INF552), 36h, École Polytechnique / Institut Polytechnique de Paris
- Master (M1/M2): Caroline Appert, Experimental Design and Analysis, 21h, Université Paris Saclay
- Master (M2): Vanessa Peña Araya, Winter School, 15.5h, Univ. Paris Saclay
- Master (M1/M2): Vanessa Peña Araya, Web Development with Node.js, 10.5h, Univ. Paris Saclay
- Master (M2): Vanessa Peña Araya, Career Seminar, 12h, Univ. Paris Saclay
- Master (M1/M2): Anastasia Bezerianos, Mixed Reality and Tangible Interaction, 12h, Univ. Paris Saclay
- Master (M1/M2): Anastasia Bezerianos, Interactive Information Visualization, 10.5h, Univ. Paris Saclay
- Master (M1): Anastasia Bezerianos, Design Project (M1 HCI/HCID), 21h, Univ. Paris Saclay.
- Master (M1): Anastasia Bezerianos, WinterSchool, 6h, Univ. Paris-Saclay.
- Master Interaction (M1/M2): Mehdi Chakhchoukh, Programming of Interactive Systems, 21h, Univ. Paris Saclay.
- Master Interaction (M1/M2): Mehdi Chakhchoukh, Advanced Programming of Interactive Systems, 21h, Univ. Paris Saclay.
- Licence 3 Informatique (L3): Mehdi Chakhchoukh, Programming of Advanced Interactive Interfaces, 24h, Univ. Paris Saclay.
- Ingénieur 4e année (Polytech - ET4): Anastasia Bezerianos, Projet, 36h, Polytech, Univ. Paris-Saclay.
- Ingénieur 3e année (Polytech - ET3): Anastasia Bezerianos, Projet Java-Graphique-IHM, 24h, Polytech, Univ. Paris-Saclay.
- Ingénieur 3e année apprentissage (Polytech - APP3): Anastasia Bezerianos, Programmation Web, 36h, Polytech, Univ. Paris-Saclay.
- Ingénieur (X-3A)/Master (M1/M2): Olivier Gladin, Data Visualization (INF552), 18h, École Polytechnique / Institut Polytechnique de Paris
- Master (M1): Vincent Cavez, Winter School 2, 11h, Univ. Paris Saclay
- ET3 (ET3) : Mehdi Chakhchoukh, Human-Computer Interaction, 12h, Polytech Paris-Saclay
- Licence 2 Informatique (L2): Mehdi Chakhchoukh, Introduction to Human-Computer Interaction, 12h, Univ. Paris Saclay.
- BUT (BUT1): Camille Dupré, R101-InitDev2, 33h, IUT d'Orsay
9.2.1 Supervision
- PhD: Raphaël James, Environnements de réalité physique et augmentée utilisés dans l'analyse visuelle collaborative, defended on 2023-02-16. Advisors: Anastasia Bezerianos, Olivier Chapuis
- PhD: Emmanuel Courtoux, Tangible Collaborative Interaction for Wall-sized Displays, since October 2019, defended on 2023-04-11. Advisors: Olivier Chapuis, Caroline Appert
- PhD: Lijie Yao, Situated/embedded visualizations in motion and mobile visualizations, defended on 2023-12-18, Advisors: Petra Isenberg (EPC Aviz), Anastasia Bezerianos
- PhD in progress: Mehdi Chakhchoukh, CHORALE: Collaborative Human-Model Interaction to Support Multi-Criteria Decision Making in Agronomy, since October 2020, Advisors: Anastasia Bezerianos, Nadia Boukhelifa
- PhD in progress: Vincent Cavez, Post-WIMP Data Wrangling, since October 2021, Advisors: Emmanuel Pietriga, Caroline Appert
- PhD in progress: Theo Bouganim, Interactive Exploration of Semi-structured Document Collections and Databases, since October 2022, Advisors: Ioana Manolescu (EPC Cedar), Emmanuel Pietriga
- PhD in progress: Camille Dupré, Interactive content manipulation in Mixed Reality, since November 2022, Advisors: Caroline Appert, Emmanuel Pietriga
- PhD in progress: Gaëlle Clavelin, Interaction gestuelle dans les environnements d'affichage multi-dispositifs, since December 2022, Advisors: Eric Lecolinet (Telecom ParisTech), Olivier Chapuis, Jan Gugenheimer (Telecom ParisTech)
- M2 internship: Damien Verani, Intangible Tablet, 6 months. Advisors: Caroline Appert, Olivier Gladin, Emmanuel Pietriga
- M2 internship: Yucheng Lu, HIstoric SiTes: cOmbining augmented Reality with a mobile device for a hYbrid exploration experience, 6 months. Advisors: Tobias Isenberg (Aviz), Olivier Chapuis
- M1 internship: Noémie Hanus, De-augmenting Augmented Reality, 6 months. Advisors: Caroline Appert, Emmanuel Pietriga
- M1 internship: Srijan Sarkar, Visualization to Support Asynchronous Communication Among Scientists, 6 months. Advisors: Anastasia Bezerianos, Vanessa Peña-Araya
- M1 internship: Yuyan Zhao, Communicating Water Scarcity for Decision Making, 6 months. Advisors: Anastasia Bezerianos, Vanessa Peña-Araya
- L3 internship: Abel Henry-Lapassat, Wall Displays versus Virtual Reality in Collaborative Tasks, 3 months. Advisors: Olivier Chapuis
- L3 internship: Thibaut Guérin, CSS-AR, 3 months. Advisors: Emmanuel Pietriga, Caroline Appert, Ludovic David
- TER M1: Jacobo Ruiz, Trust in interactive machine systems with visual analytics, 6 months. Advisors: Anastasia Bezerianos
- TER L3: Abel Henry-Lapassat, Faciliter l’exécution d’expériences à distance en RV collaborative, 5 months. Advisors: Olivier Chapuis
9.2.2 Juries
- HDR: Sylvain Malacria, Centre Inria de l'Université de Lille: Caroline Appert (rapporteur)
- HDR: Sarah Fdili Alaoui, Université Paris-Saclay: Caroline Appert (présidente)
- PhD: Ambre Assor, Centre Inria de l'Université de Bordeaux: Emmanuel Pietriga (rapporteur)
- PhD: Eva Mackamul, Université de Lille: Anastasia Bezerianos (rapporteur)
- PHD: Marine Djaffardjy, Université Paris-Saclay: Caroline Appert (présidente)
- PhD: Arthur Fages, Université Paris-Saclay: Anastasia Bezerianos (présidente)
- PhD: Jyayi Hong, Université Paris-Saclay: Caroline Appert (présidente), Anastasia Bezerianos (examinatrice)
- PHD: Mohammad Alaul Islam, Université Paris-Saclay: Caroline Appert (présidente)
- PHD: Hong Jiay, Université Paris-Saclay: Caroline Appert (présidente)
- PhD: Clara Rigaud, Sorbonne Université: Anastasia Bezerianos (présidente)
9.3 Popularization
9.3.1 Articles and contents
- 2023-11: Contribution to “Les réseaux - La tête dans le Net (Réalité Virtuelle et Réalité Augmentée)” by Philippe Fontaine for Science & Vie Junior Hors-série (p. 60–62)
10 Scientific production
10.1 Major publications
- 1 inproceedingsARPads: Mid-air Indirect Input for Augmented Reality.ISMAR 2020 - IEEE International Symposium on Mixed and Augmented RealityISMAR '20Porto de Galinhas, BrazilIEEENovember 2020, 13 pagesHALback to textback to text
- 2 articleSpreadsheets on Interactive Surfaces: Breaking through the Grid with the Pen.ACM Transactions on Computer-Human InteractionOctober 2023HALDOIback to text
- 3 articleUnderstanding How In-Visualization Provenance Can Support Trade-off Analysis.IEEE Transactions on Visualization and Computer GraphicsMay 2022HALDOIback to textback to text
- 4 inproceedingsWallTokens: Surface Tangibles for Vertical Displays.Proceedings of the international conference on Human factors in computing systemsCHI 2021 - International conference on Human factors in computing systemsCHI '21Yokoama / Virtual, JapanACMMay 2021, 13 pagesHALDOIback to text
- 5 inproceedingsEvaluating the Extension of Wall Displays with AR for Collaborative Work.Proceedings of the international conference on Human factors in computing systemsCHI 2023 - International conference on Human factors in computing systemsHambourg, GermanyACM2023HALDOIback to text
- 6 articleHyperStorylines: Interactively untangling dynamic hypergraphs.Information VisualizationSeptember 2021, 1-21HALDOIback to text
- 7 articleA Comparison of Visualizations for Identifying Correlation over Space and Time.IEEE Transactions on Visualization and Computer GraphicsOctober 2019HALDOIback to textback to text
- 8 articleExpressive Authoring of Node-Link Diagrams with Graphies.IEEE Transactions on Visualization and Computer Graphics274April 2021, 2329-2340HALDOIback to textback to text
- 9 inproceedingsSpaceInk: Making Space for In-Context Annotations.UIST 2019 - 32nd ACM User Interface Software and TechnologyNouvelle-Orleans, United StatesOctober 2019HALDOIback to textback to text
- 10 inproceedingsDesigning Coherent Gesture Sets for Multi-scale Navigation on Tabletops.Proceedings of the 36th international conference on Human factors in computing systemsCHI '18Montreal, CanadaACMApril 2018, 142:1-142:12HALDOIback to text
10.2 Publications of the year
International journals
International peer-reviewed conferences
Doctoral dissertations and habilitation theses
10.3 Cited publications
- 19 bookData on the Web: From Relations to Semistructured Data and XML.Morgan Kaufmann1999back to text
- 20 inproceedingsCustom-made Tangible Interfaces with TouchTokens.International Working Conference on Advanced Visual Interfaces (AVI '18)Proceedings of the 2018 International Conference on Advanced Visual InterfacesGrosseto, ItalyACMMay 2018, 15HALDOIback to text
- 21 inproceedingsAR-enhanced Widgets for Smartphone-centric Interaction.MobileHCI '21 - 23rd International Conference on Mobile Human-Computer InteractionACMToulouse, FranceSeptember 2021HALDOIback to textback to text
- 22 inproceedingsWallTokens: Surface Tangibles for Vertical Displays.CHI 2021- International conference on Human factors in computing systemsYokohama ( virtual ), JapanACMMay 2021, 13 pagesHALDOIback to text
- 23 articleS-Paths: Set-based visual exploration of linked data driven by semantic paths.Open Journal Of Semantic Web1212021, 99-116HALDOIback to text
- 24 inproceedingsInvestigating the Use of AR Glasses for Content Annotation on Mobile Devices.ACM ISS 2022 - ACM Interactive Surfaces and Spaces Conference6Proceedings of the ACM on Human-Computer InteractionISSWellington, New ZealandNovember 2022, 1-18HALDOIback to textback to text
- 25 bookM. R.M. R. EndsleyD. G.D. G. JonesDesigning for Situation Awareness: an Approach to User-Centered Design.370 pagesCRC Press, Taylor & Francis2012back to text
- 26 bookLinked Data: Evolving the Web into a Global Data Space.Morgan & Claypool2011back to text
- 27 articleGeo-Storylines: Integrating Maps into Storyline Visualizations.IEEE Transactions on Visualization and Computer Graphics291October 2022, 994-1004HALDOIback to textback to text
- 28 inproceedingsPersonal+Context navigation: combining AR and shared displays in Network Path-following.GI 2020 - Conference on Graphics InterfaceGI '20Toronto, CanadaCHCCS/SCDHMMay 2020HALback to text
- 29 inproceedingsPassive yet Expressive TouchTokens.Proceedings of the 35th SIGCHI conference on Human Factors in computing systemsDenver, United StatesMay 2017, 3741 - 3745HALDOIback to text
- 30 inproceedingsTouchTokens: Guiding Touch Patterns with Passive Tokens.Proceedings of the 2016 CHI Conference on Human Factors in Computing SystemsCHI '16San Jose, CA, United StatesACMMay 2016, 4189-4202HALDOIback to text
- 31 inproceedingsA Comparison of Geographical Propagation Visualizations.CHI '20 - 38th SIGCHI conference on Human Factors in computing systemsHonolulu, United StatesApril 2020, 223:1--223:14HALDOIback to textback to text
- 32 inproceedingsEngineering Interactive Geospatial Visualizations for Cluster-Driven Ultra-high-resolution Wall Displays.EICS 2022 - ACM SIGCHI Symposium on Engineering Interactive Computing SystemsSophia Antipolis France, FranceACMJune 2022, 3-4HALDOIback to textback to textback to text
- 33 inproceedingsBrowsing Linked Data Catalogs with LODAtlas.ISWC 2018 - 17th International Semantic Web ConferenceMonterey, United StatesSpringerOctober 2018, 137-153HALDOIback to text
- 34 inproceedingsAwareness Techniques to Aid Transitions between Personal and Shared Workspaces in Multi-Display Environments.Proceedings of the 2018 International Conference on Interactive Surfaces and SpacesISS '18Tokyo, JapanACMNovember 2018, 291--304HALDOIback to text
- 35 inproceedingsAnimated Edge Textures in Node-Link Diagrams: a Design Space and Initial Evaluation.Proceedings of the 2018 CHI Conference on Human Factors in Computing SystemsCHI '18Montréal, CanadaACMApril 2018, 187:1--187:13HALDOIback to text
- 36 inproceedingsInfluence of Color and Size of Particles on Their Perceived Speed in Node-Link Diagrams.INTERACT 2019 - 17th IFIP Conference on Human-Computer InteractionLNCS-11747Human-Computer Interaction -- INTERACT 2019Part IIPart 7: Information VisualizationPaphos, CyprusSpringer International PublishingSeptember 2019, 619-637HALDOIback to text
- 37 inproceedingsActiveInk: (Th)Inking with Data.CHI 2019 - The ACM CHI Conference on Human Factors in Computing SystemsCHI 2019 - Proceedings of the 2019 CHI Conference on Human Factors in Computing SystemsGlasgow, United KingdomACMMay 2019HALDOIback to text
- 38 articleThe Semantic Web Revisited.IEEE Intelligent Systems2132006, 96-101URL: 10.1109/MIS.2006.62DOIback to text