

Section: Scientific Foundations
Dynamics of complex systems
GEOSTAT is studying complex signals under the point of view of nonlinear methods, in the sense of nonlinear physics i.e. the methodologies developed to study complex systems, with a strong emphasis on multiresolution analysis. Linear methods in signal processing refer to the standard point of view under which operators are expressed by simple convolutions with impulse responses. Linear methods in signal processing are widely used, from least-square deconvolution methods in adaptive optics to source-filter models in speech processing. Linear methods do not unlock the multiscale structures and cascading variables of primarily importance as previewed by the physics of the phenomena. This is the reason why new approaches, such as DFA (Detrented Fluctuation Analysis), Time-frequency analysis, variations on curvelets [38] etc. have appeared during the last decades. One important result obtained in GEOSTAT is the effective use of multiresolution analysis associated to optimal inference along the scales of a complex system. The multiresolution analysis is performed on dimensionless quantities given by the singularity exponents which encode properly the geometrical structures associated to multiscale organization. This is applied successfully in the derivation of high resolution ocean dynamics, or the high resolution mapping of gazeous exchanges between the ocean and the atmosphere; the latter is of primary importance for a quantitative evaluation of global warming. Understanding the dynamics of complex systems is recognized as a new discipline, which makes use of theoretical and methodological foundations coming from nonlinear physics, the study of dynamical systems and many aspects of computer science. One of the challenges is related to the question of emergence in complex systems: large-scale effects measurable macroscopically from a system made of huge numbers of interactive agents [29] , [26] , [43] , [34] . Some quantities related to nonlinearity, such as Lyapunov exponents, Kolmogorov-Sinai entropy etc. can be computed at least in the phase space [27] . Consequently, knowledge from acquisitions of complex systems (which include complex signals) could be obtained from information about the phase space. A result from F. Takens [39] about strange attractors in turbulence has motivated the determination of discrete dynamical systems associated to time series [31] , and consequently the theoretical determination of nonlinear characteristics associated to complex acquisitions. Emergence phenomena can also be traced inside complex signals themselves, by trying to localize information content geometrically. Fundamentally, in the nonlinear analysis of complex signals there are broadly two approaches: characterization by attractors (embedding and bifurcation) and time-frequency, multiscale/multiresolution approaches. Time-frequency analysis [28] and multiscale/multiresolution are the subjects of intense research and are profoundly reshaping the analysis of complex signals by nonlinear approaches [25] , [30] . In real situations, the phase space associated to the acquisition of a complex phenomenon is unknown. It is however possible to relate, inside the signal's domain, local predictability to local reconstruction and deduce from that singularity exponents (SEs) [8] [5] . The SEs are defined at any point in the signal's domain, they relate, but are different, to other kinds of exponents used in the nonlinear analysis of complex signals. We are working on their relation with:
The alternative approach taken in GEOSTAT is microscopical, or geometrical: the multiscale structures which have their "fingerprint" in complex signals are being isolated in a single realization of the complex system, i.e. using the data of the signal itself, as opposed to the consideration of grand ensembles or a wide set of realizations. This is much harder than the ergodic approaches, but it is possible because a reconstruction formula such as the one derived in [40] is local and reconstruction in the signal's domain is related to predictability.
Nonlinear signal processing is making use of quantities related to predictability. For instance the first Lyapunov exponent is related, from Osedelec's theorem, to the limiting behaviour of the response, after a time , to perturbation in the phase space :
with being time average and the response to a perturbation [27] . More refined information is provided by the Kolmogorov-Sinai entropy:
( is related to events which appear with very high probability in long time). In GEOSTAT our aim is to relate these classical quantities (among others) to the behaviour of SEs, which are defined by a limiting behaviour
(: dimension of the signal's domain, : multiscale measure, typically whose density is the gradient's norm, : ball of radius centered at ). For precise computation, SEs can be smoothly interpolated by projecting wavelets:
(: mother wavelet, admissible or not). SEs are related to the framework of reconstructible systems, and consequently to predictability. They unlock the geometric localization of multiscale structures in a complex signal:
(: signal's domain) and are consequently in relation with optimal wavelets:
(: two scales of observation, : injection variable between the scales, : optimal wavelet) and their multiresolution analysis. They are related to persistence along the scales and lead to multiresolution analysis whose coefficients verify
with and referrin to child and parent coefficients, and are random variables independent of and and also independent of each other.
|
|
|
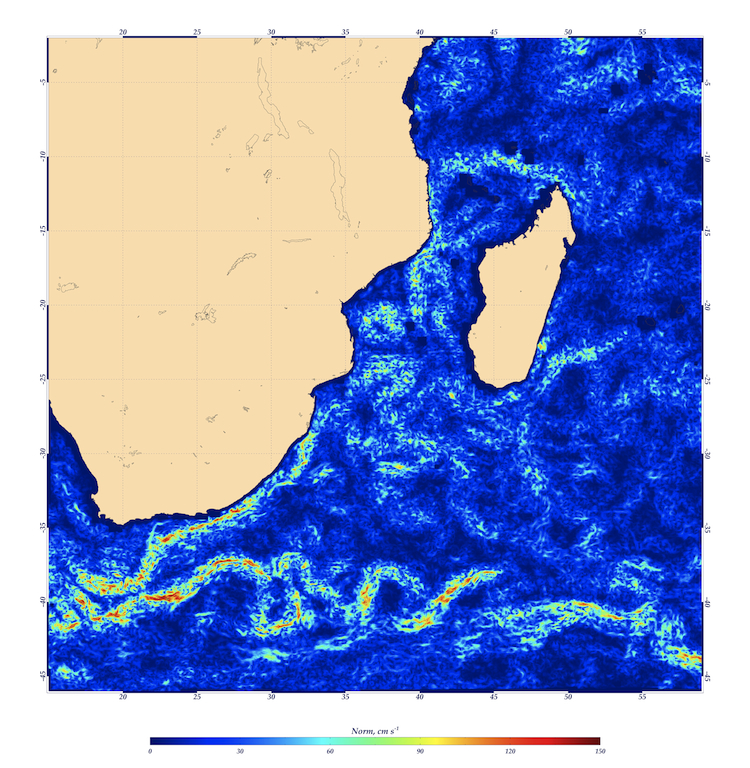
In a first example we give some insight about the collaboration with LEGOS Dynbio team (http://www.legos.obs-mip.fr/recherches/equipes/dynbio .) about high-resolution ocean dynamics from microcanonical formulations in nonlinear complex signal analysis. LPEs relate to the geometric structures linked with the cascading properties of indefinitely divisible variables in turbulent flows. Cascading properties can be represented by optimal wavelets (OWs); this opens new and fascinating directions of research for the determination of ocean motion field at high spatial resolution. OWs in a microcanonical sense pave the way for the determination of the energy injection mechanisms between the scales. From this results a new method for the complete evaluation of oceanic motion field is introduced; it consists in propagating along the scales the norm and the orientation of ocean dynamics deduced at low spatial resolution (geostrophic from altimetry and a part of ageostrophic from wind stress products). Using this approach, there is no need to use several temporal occurrences. Instead, the proper determination of the turbulent cascading and energy injection mechanisms in oceanographic signals allows the determination of oceanic motion field at the SST or Ocean colour spatial resolution (pixel size: 4 kms). We use the Regional Ocean Modelling System (ROMS) to validate the results on simulated data and compare the motion fields obtained with other techniques. See figure 1 .
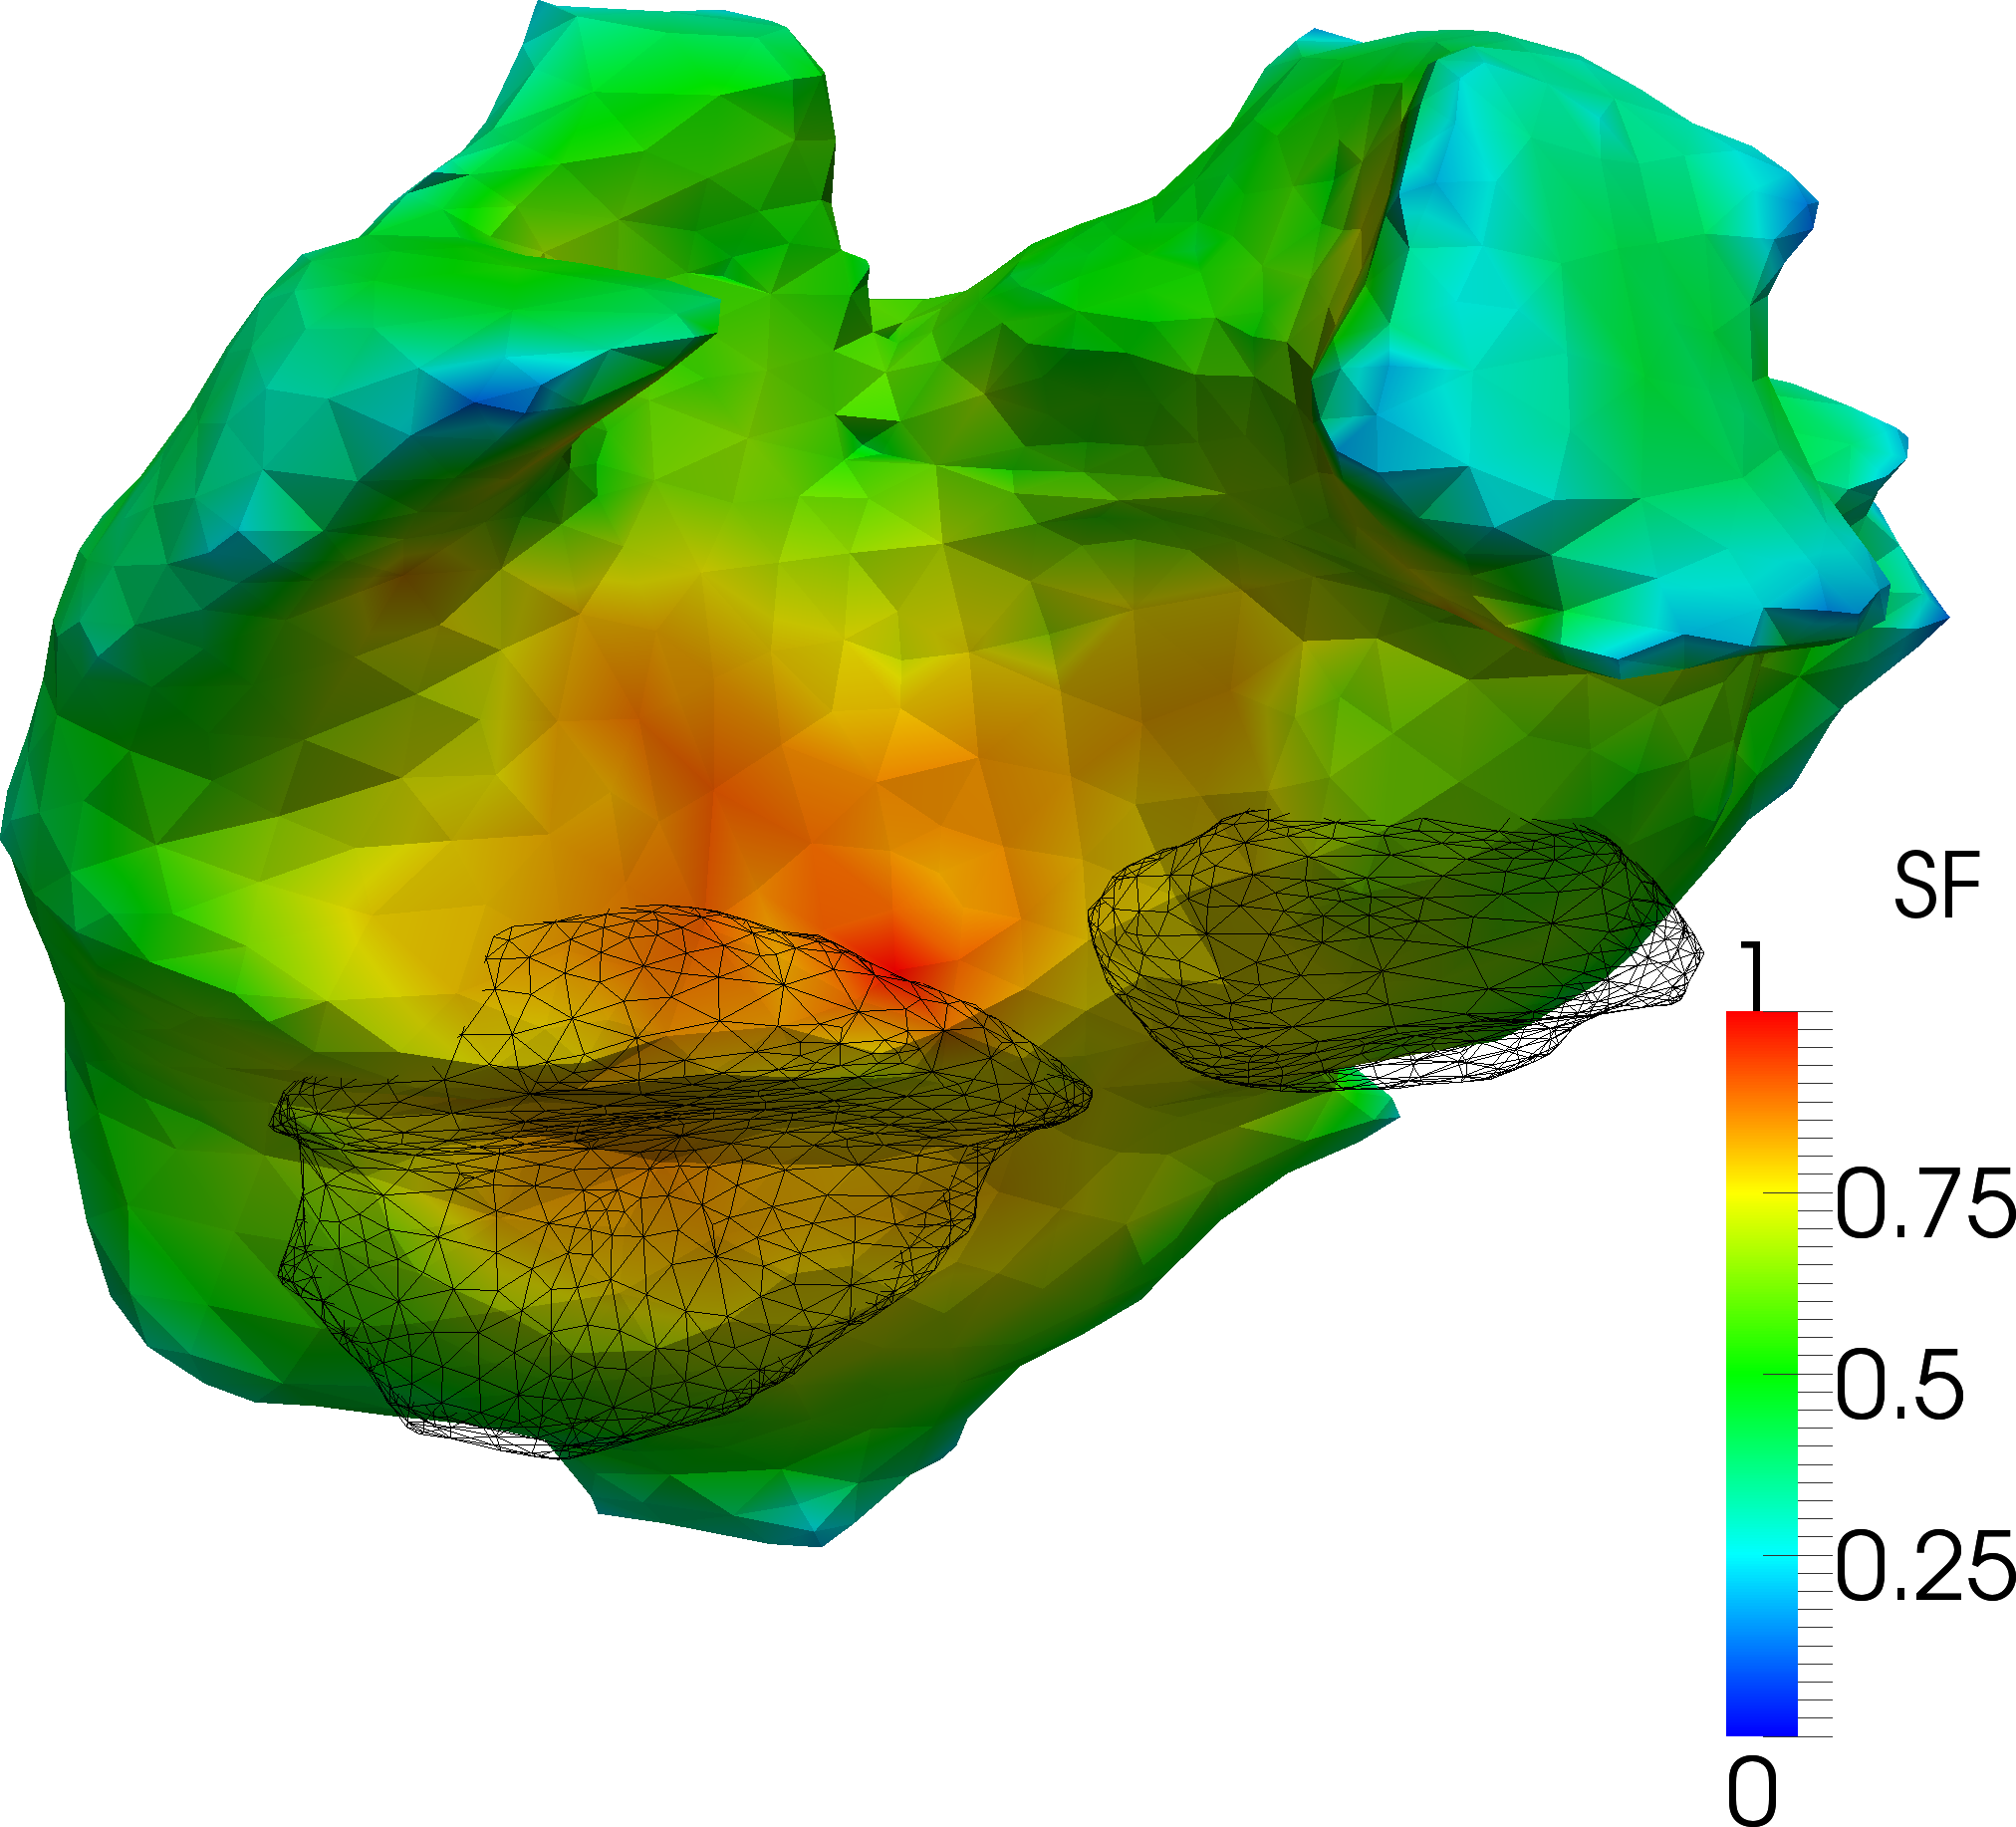
In a second example, we show in figure 2 the highly promising results obtained in the application of nonlinear signal processing and multiscale techniques to the localization of heart fibrillation phenomenon acquired from a real patient and mapped over a reconstructed 3D surface of the heart. The notion of source field, defined in GEOSTAT from the computation of derivative measures related to the singularity exponents allows the localization of arythmic phenomena inside the heart [6] .
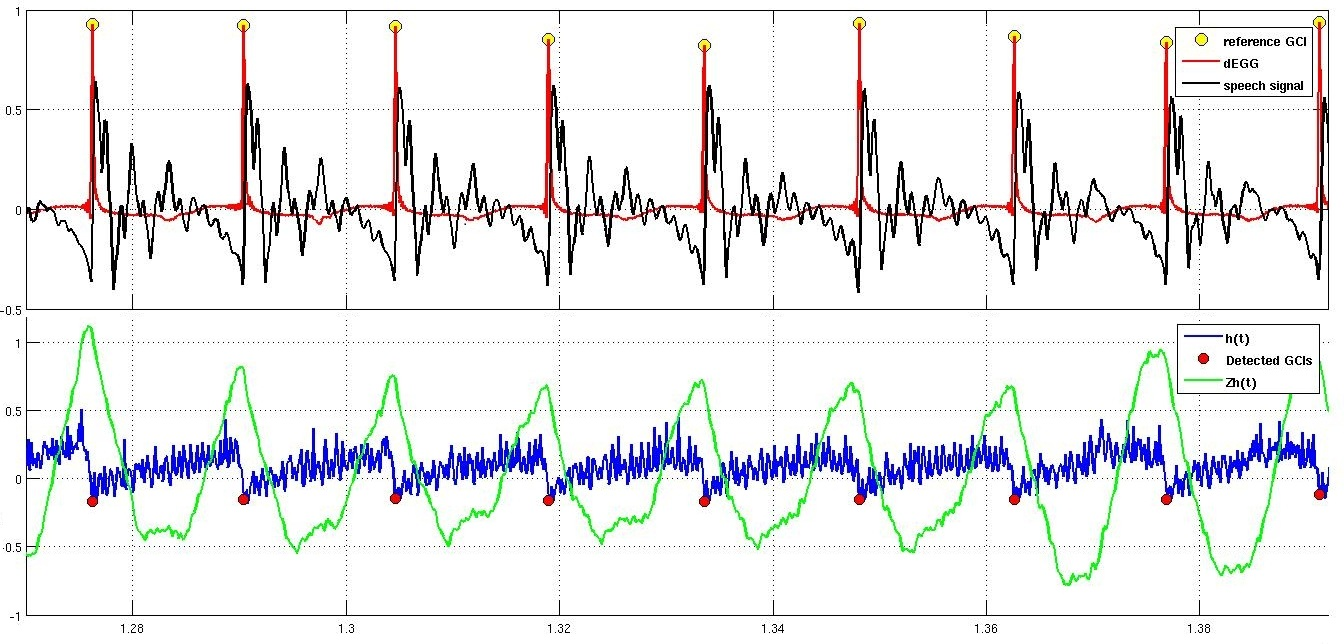
Our last example is about speech. In speech analysis, we use the concept of the Most Singular Manifold (MSM) to localize critical events in domain of this signal. We show that in case of voiced speech signals, the MSM coincides with the instants of significant excitation of the vocal tract system. It is known that these major excitations occur when the glottis is closed, and hence, they are called the Glottal Closure Instants (GCI). We use the MSM to develop a reliable and noise robust GCI detection algorithm and we evaluate our algorithm using contemporaneous Electro-Glotto-Graph (EGG) recordings. See figure 3 .