Section: New Results
Speech Analysis
Participants : Vahid Khanagha [correspondant] , Khalid Daoudi, Hussein Yahia, Oriol Pont.
Development of a GCI detection algorithm (Vahid Khanagha, Khalid Daoudi, Hussein Yahia). According to the aerodynamic theory of voicing, the excitation source for voiced speech sounds is represented as glottal pulses, which to a first approximation, can be considered to occur at discrete instants of time. This major excitation usually coincides with the Glottal Closure Instants (the GCIs). The precise detection of GCIs has found many applications in speech technology: accurate estimation of vocal tract system, pitch marking of speech for pitch synchronous speech processing algorithms, conversion of pitch and duration of speech recordings, prosody modification and synthesis. We use the MMF for detection of these physically important instants. To do so, we study the correspondence of the Most Singular Manifold with the physical production mechanism of the speech signal and we show that this subset can be used for GCI detection. We show that, in clean speech, our algorithm has similar performance to recent methods and, in noisy speech, it significantly outperforms state-of-the-art methods. Indeed, as our algorithm is based on both time domain and inter-scale smoothings, it provides higher robustness against many types of noises. In the mean-time, the high geometrical resolution of singularity exponents prevents the accuracy to be compromised. Moreover, the algorithm extracts GCIs directly from the speech signal and does not rely on any model of the speech signal (such as the autoregressive model in linear predictive analysis). See figure 10 .
Figure 10. Top: a voiced segment of the speech signal taken from KED database. Middle: the differenced Electro-Glotto-Graph signal which serves for extraction of reference GCI points. The peaks are marked with yellow circles as the reference GCIs. Bottom: singularity exponents are shown by black color and an auxiliary functional showing changes in DC level of exponents is shown in green. The local minima of singularity exponents within each positive half-period of the auxiliary functional are taken as GCIs. 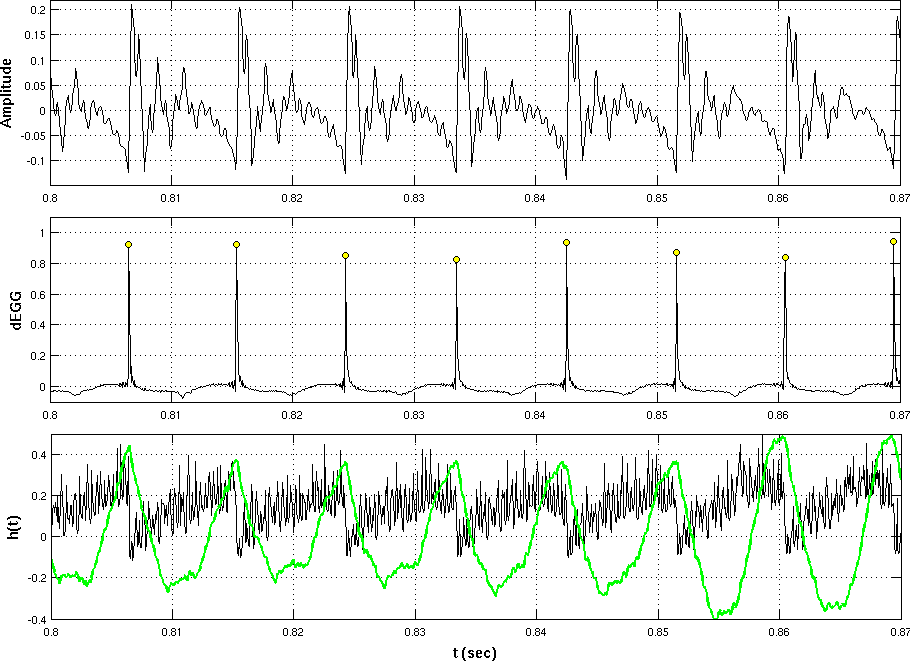
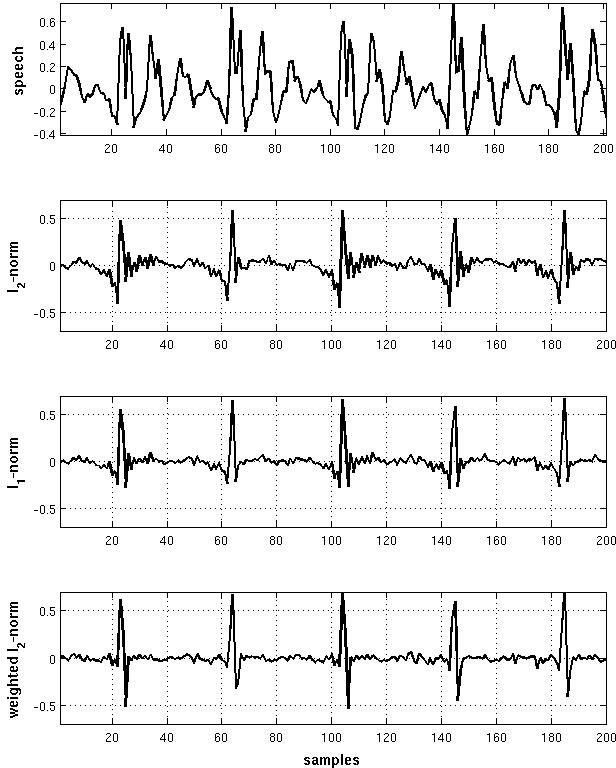
Development of an efficient algorithm for sparse Linear Prediction Analysis (Vahid Khanagha, Khalid Daoudi). We address the problem of sparse Linear Prediction (LP) analysis, which involves the estimation of vocal tract model such that the corresponding LP residuals are as sparse as possible: for voiced sounds, one desires the residual to be zero all the time, except for few impulses at GCIs. Sparse Linear Prediction Analysis (LPA) problem has recently got much scientific attention and its classical solutions suffer from computational and algorithmic complexties. We introduce a simple closed-form solution in this chapter which is based on the minimization of weighted -norm of residuals. The weighting function plays the most important role in our solution in maintaining the sparsity of the resulting residuals. We use our MSM-based GCI detector to extract from the speech signal itself, the points having the potential of attaining largest norms of residuals and then we construct the weighting function such that the prediction error is relaxed on these points. Consequently, the weighted -norm objective function can be efficiently minimized by the solution of normal equations of liner least squares problem. The choice of our MSM-based GCI detector is particularly justified, considering the fact that most of the successful GCI detection methods actually use LP residuals for their detection and hence, they cannot be used for constraining the LP problem. Our algorithm is completely independent of any model that might be assumed for speech signal. We will see that when compared to classical techniques, our simple algorithm provides better sparseness properties and does not suffer from usual instabilities. We also present an experiment to show how such sparse solution may result in more realistic estimates of the vocal tract by decoupling of the contributions of the excitation source from that of the vocal tract filter. See figure 11 .
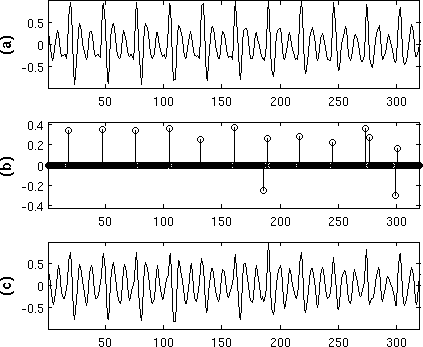
Multi-pulse estimation of speech excitation source (Vahid Khanagha, Khalid Daoudi). In the GCI detector algorithm, the cardinality of MSM was restricted to one sample per pitch period. We then proceed to study the significance of MSMs of higher cardinalities, in the framework of multi-pulse estimation of voiced sound excitation source. Multi-pulse source coding has been widely used and studied within the framework of Linear Predictive Coding (LPC). It consists in finding a sparse representation of the excitation source (or residual) which yields a source-filter reconstruction with high perceptual quality. The MultiPulse Excitation (MPE) method is the first and one of the most popular techniques to achieve this goal. MPE provides a sparse excitation sequence through an iterative Analysis-by-Synthesis procedure to find the position and amplitudes of the excitation source in two stages: first the location of pulses are estimated one at a time by minimization of perceptually wieghted reconstruction error. In the second stage, the amplitude of these pulses are jointly re-optimized to find the optimal pulse values. Using the MSM, we propose a novel approach to find the locations of the multi-pulse sequence that approximates the speech source excitation. We consider locations of MSM points as the locations of excitation impulses and then, the amplitude of these impulses are computed using the second stage of the classical MPE coder by minimization of the spectrally weighted mean squared error of reconstruction. The multi pulse sequence is then fed to the classical LPC synthesizer to reconstruct speech. Our algorithm is more efficient than classical methods, while providing the same level of perceptual quality as the classical MPE method. See figure 12 .
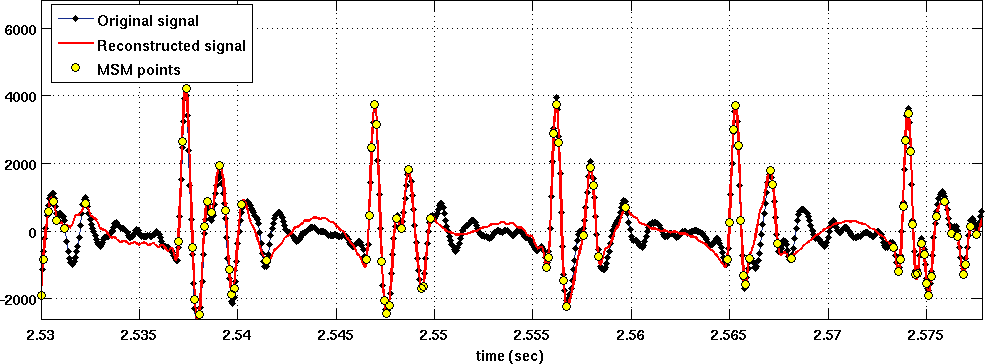
Speech representation based local singularity analysis (Vahid Khanagha, Khalid Daoudi, Hussein Yahia, Oriol Pont). Precise estimation of singularity exponents unlocks the determination a collection of points inside the complex signal which are considered as the least predictable points (the MSM). This leads to the associated compact representation and reconstruction. This work presents the very first steps in establishing the links between the MSM and the speech signal. To do so, we make slight modifications to the formalism so as to adapt it to the particularities of the speech signal. Indeed, the complex intertwining of different dynamics in speech (added to purely turbulent descriptions) suggests the definition of appropriate multi-scale functionals that might influence the evaluation of SEs, hence resulting in a more parsimonious MSM. We present a study that comforts these observations: we show that an alternative multi-scale functional does lead to a more parsimonious MSM from which the whole speech signal can be reconstructed with good perceptual quality. As MSM is composed of a collection of irregularly spaced samples, we use a classical method for the interpolation of irregularly spaced samples, called the Sauer-Allebach algorithm, to reconstruct the speech signal from its MSM. We show that by using this generic algorithm [and even by slight violation of its conditions] high quality speech reconstruction can still be achieved from a MSM of low cardinality. This shows that the MSM formed using the new multi-scale functional we define, indeed can give access to a subset of potentially interesting points in the domain of speech signal. Finally, in order to show the potential of this parsimonious representation in practical speech processing applications, we quantize and encode the MSM so as to develop a waveform coder. See figure 13 .