Section: New Results
Designing and Evaluating User Experience and Methods for Open Innovation
MyGreenServices: a Pollution Collective-Awareness Platform based on Citizen Sensing
Participants : Brigitte Trousse, Guillaume Pilot, Xavier Augros, Florian Bonacina, Caroline Tiffon, Anne-Laure Negri, Bernard Senach.
Adopting a living lab approach and following an experiential design process [63] , we co-created with users and implemented a Pollution Collective-Awareness platform based on Citizen Sensing called "MyGreenServices" [38] . This deployment was very rich in terms of a better understanding of research problems to be addressed in this context in order to lead to user behaviour changes: citizen sensing, environmental crowdsourcing platform and user experience in the context of IoT.
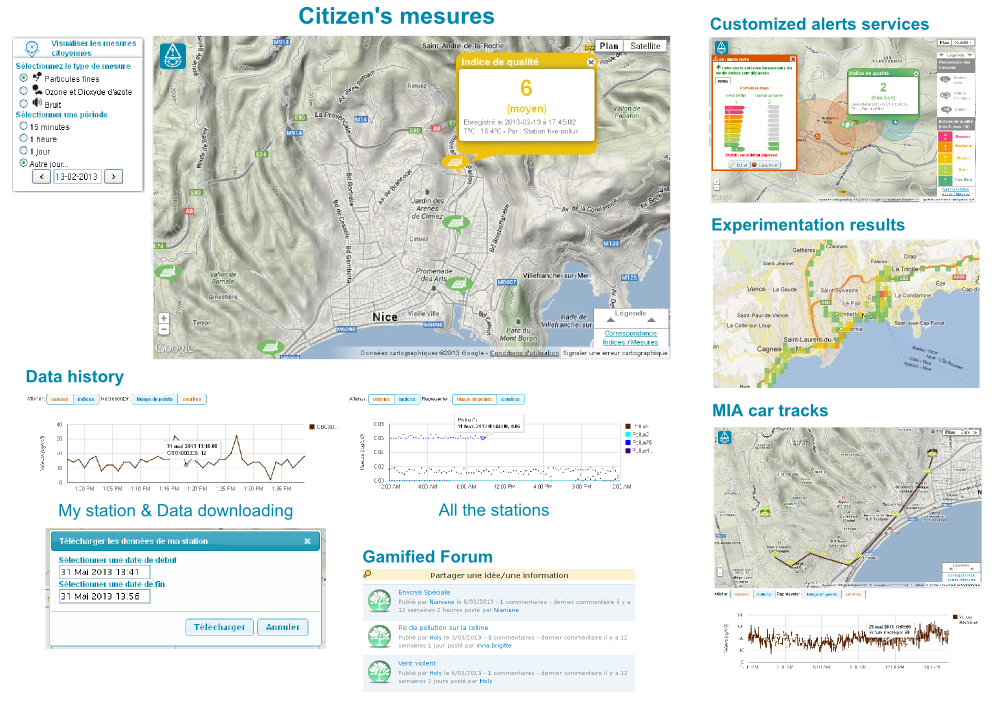
MyGreenServices (http://mygreenservices.inria.fr ) which was very robust offers various green services such as the visualization of environmental data collected by citizen, the alert services, the ability to download data, the forum for sharing ideas and best practices in terms of eco-responsible behaviors. MyGreenServices provides access to citizen measures (stations and electric vehicles) for any registered user. Moreover, citizens who host a station can trace the time history of the data sensed. The priority was to provide to users all the IoT data by them. Two ways to represent data have been chosen as shown in Figure 1 :
-
The use of maps with measures coming from environmental sensors and based on a colour scale indication;
-
The pollution curves that support the cartography and allow the access to the detailed data for the user.
A pollution alert service has been created considering two points of view:
-
The first consists of localising a person (with his agreement) and indicating via email or text message the passage through a polluted area;
-
The second allow the user to define an area to follow and the user will be advised of pollution alerts for the area by email or text message.
An important effort has been done in designing, testing and improving user interfaces based on pre-test with the usability testing software named Morae and experiments in real situations.
Two experiments have been carried out in February and in June 2013, with the aim to test the platform MyGreenServices by two user profiles (consumers and producers of data) and to measure User experience. The aim of the experiments is to assess the user experience and experiential learning related to MyGreeenServices; this includes experience related to the IoT devices, to the measures and services as well as air quality awareness and behaviour changes monitoring. See Section 6.5.3 ) for more details on the used model and measurement methodology.
For supporting Citizen Sensing, we elaborated IoT installation guides for our three Pollution stations (based on user feedbacks): Pollux station for dust from CKAB (CKAB URL: http://ckab.com/polluxnz-city ), Azimut stations for Ozone and Nitrogen dioxide from Azimut Monitoring (Azimut Monitoring URL: http://www.azimut-monitoring.com/ ) and AxISbox stations for dust (Inria Cf. Section 6.5.2 ).
In order to ensure a proper data analysis, log and usage analytics were structured and gathered in an admin tool designed by the AxIS team at Inria. This tool is a component of the MyGreenServices portal.
AxISbox, a Prototype of a Low-Cost Dust Arduino-based Station
Participant : Guillaume Pilot.
In order to provide more citizen sensors during our Elliot experiments, we developed a first prototype of a new low cost dust (PM10) station (with Rasburry and Arduino) called AxISbox (cf. Figure 2 ) which we tested for research purposes. This prototype was validated during the second ELLIOT experiment in June.
Modelling and Measuring User Experience for Green IoT-based Services
Participants : Brigitte Trousse, Anne-Laure Negri, Caroline Tiffon, Xavier Augros, Guillaume Pilot.
In accordance with the overall objective of MyGreenServices, we provided an UX modelling and measurement methodology for Green IoT-based services we applied on MyGreenServices. In our ELLIoT context, we focused on the level of awareness/experiential learning raised after usage of MyGreenServices (awareness pollution, awareness of citizen dissemination and change of behaviors), the ease of use and diffusion aspects (as being a tool provided to the citizen). Two objects of the learning were considered: IoT via myGreenServices portal and Air quality. We used a differential between a pre-profile and post-profile. Our UX methodology in the context of ELLIOT project is lying on the five steps we applied on the two versions of MyGreenServices:
-
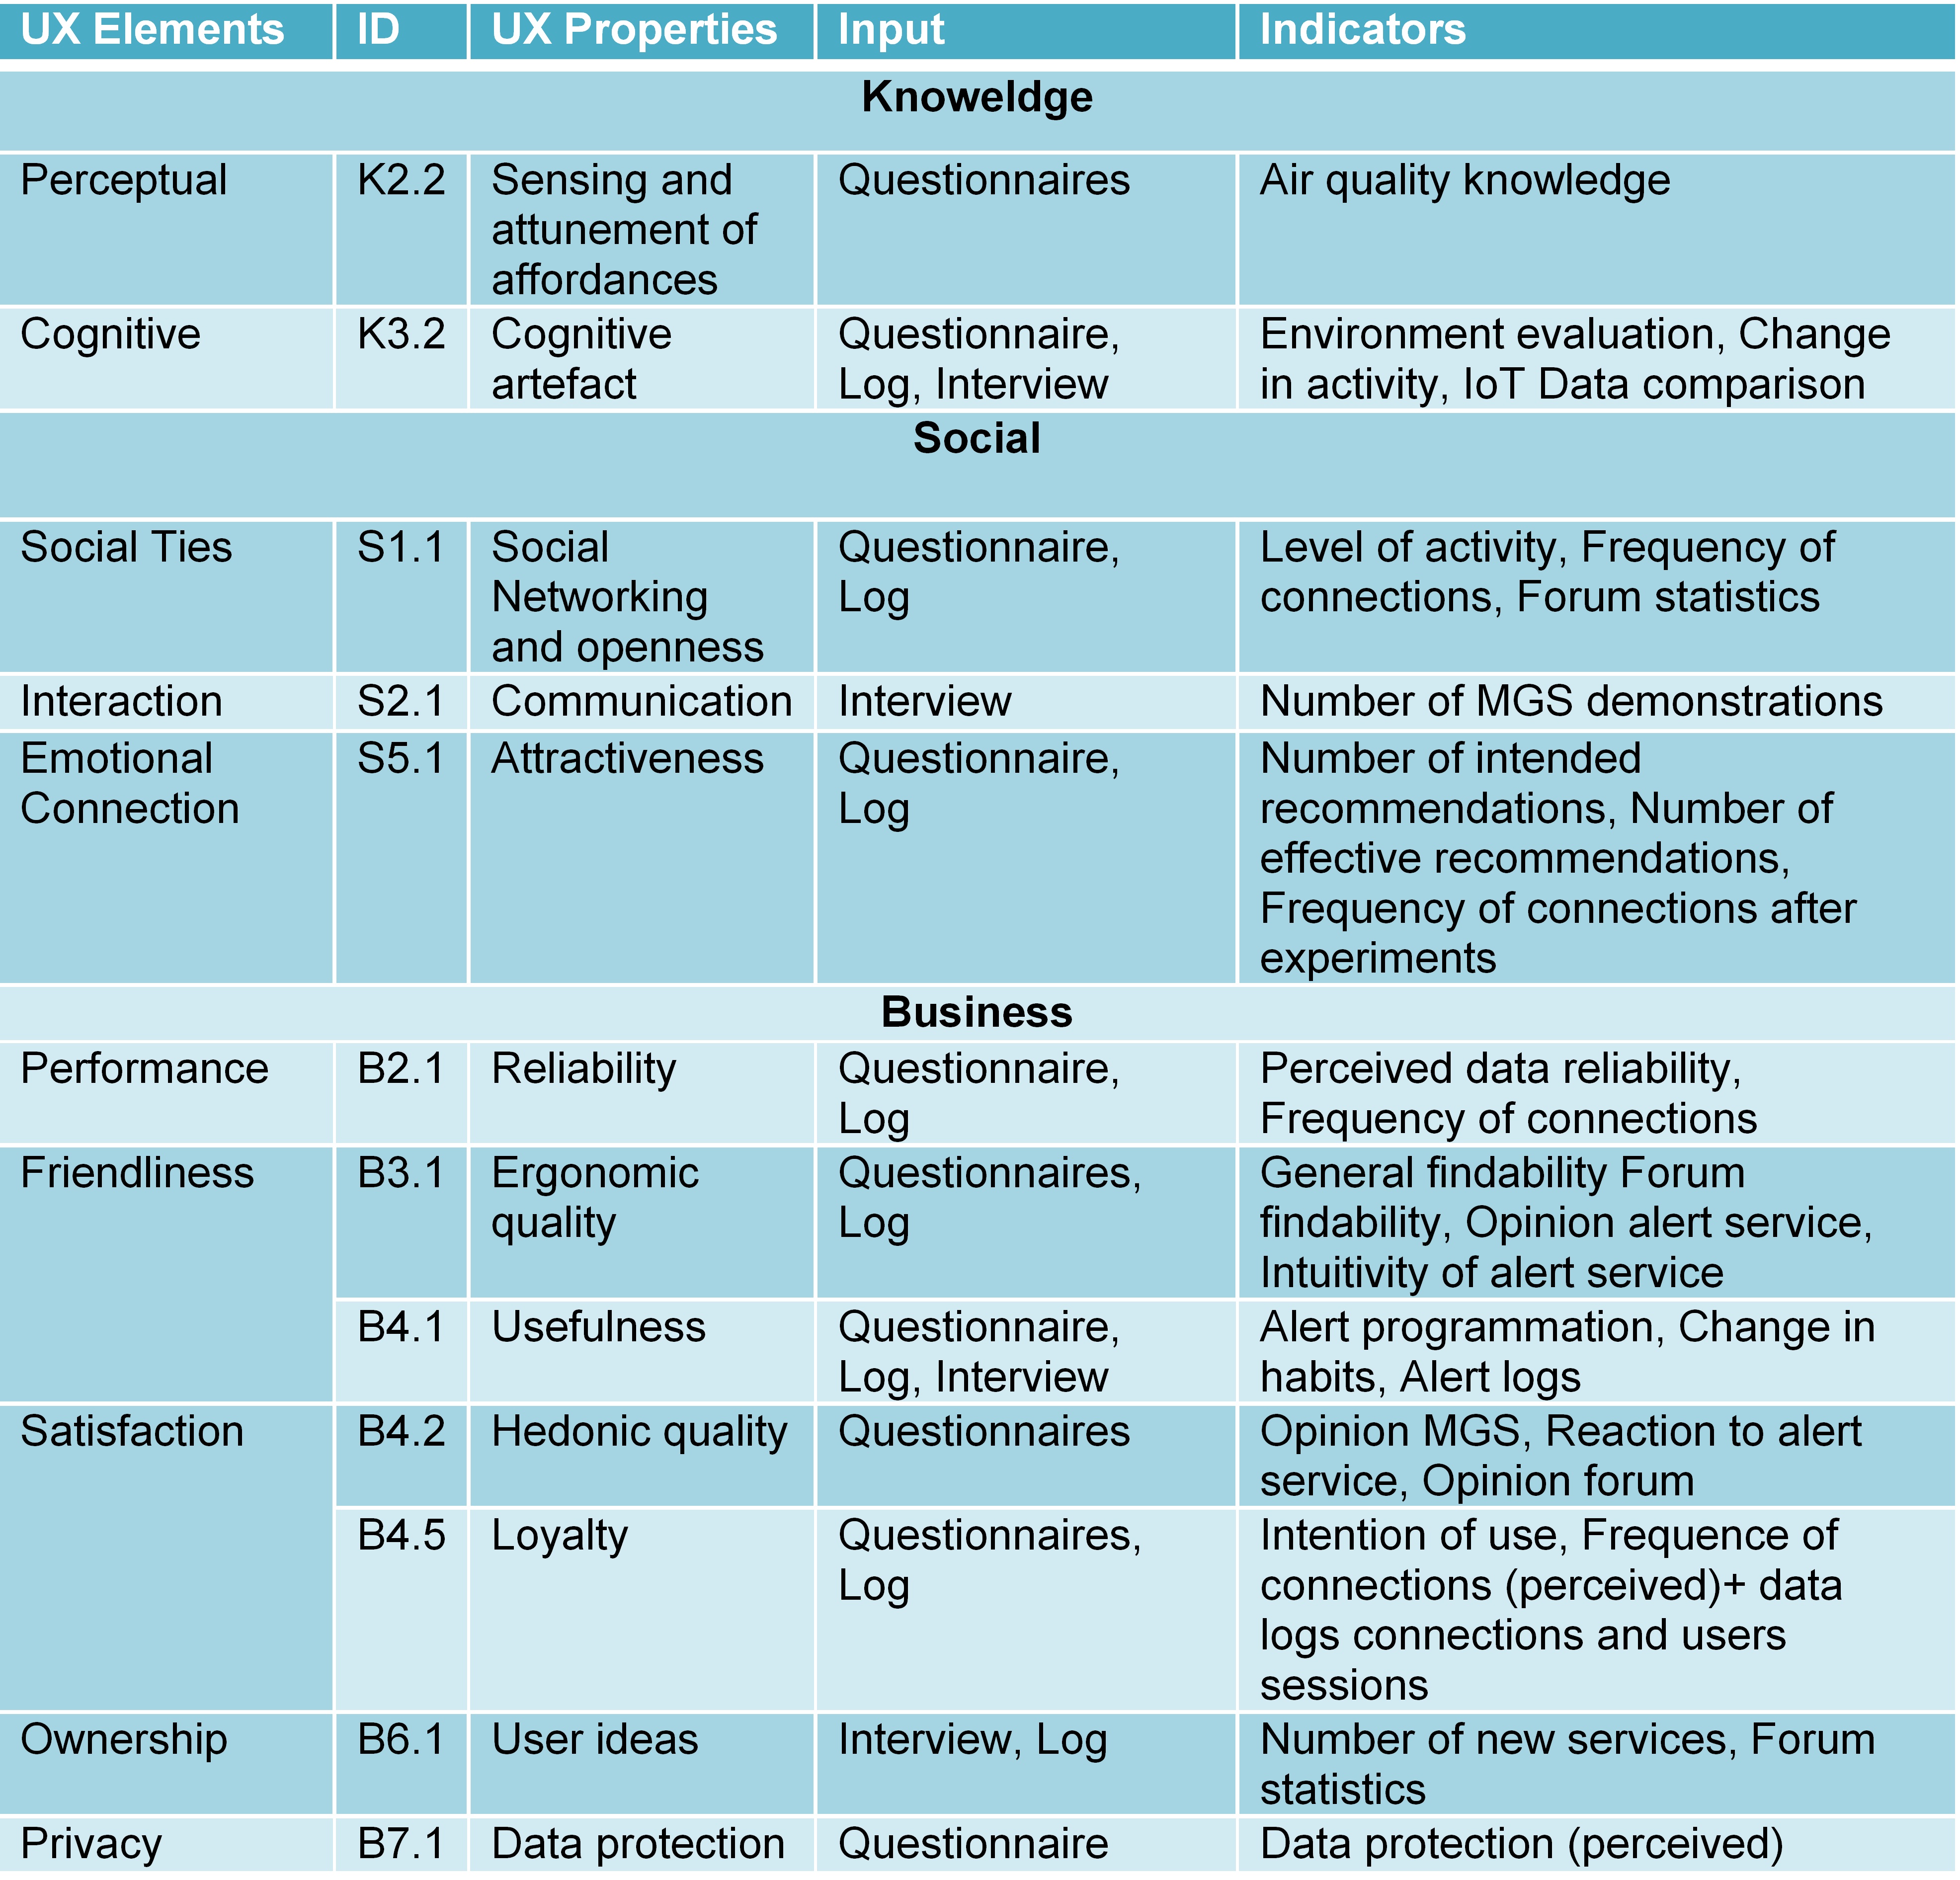
Instantiation of the holistic UX model elaborated within ELLIOT [63] (cf. the first three columns in Figure 3 ),
-
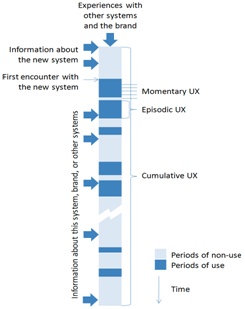
Choice of types of UX momentary, episodic, cumulative) depending on the moment of the measurement (cf. Figure 4 ),
-
Identification of relevant data to be collected and UX indicators (cf. the last two columns in Figure 3 ),
-
Definition of UX metrics for indicators and rules (see Section 6.5.4 for the example of the Usefulness property),
-
and finally data pre-processing and UX indicators/properties computation (via for some properties FocusLab 6.6 ).
|
The two experiments clearly indicate both good results in terms of user experience with better result for the second experiment due to the improvement of MyGreenServices (v2) and better community management. A comparative analysis has been made for our two experiments, showing better quantitative value of UX indicators for the second version which was based on User feedback.
Evaluating User Behaviour Changes For MyGreenServices Usefulness Measurement
Participants : Brigitte Trousse, Yves Lechevallier, Xavier Augros, Caroline Tiffon.
The Usefulness UX property of our UX model [38] is calculated by aggregating the analysis of two questions related to a change of behaviours during (4 times) and/or after the experiment in terms of: transportation, aeration, outgoing, sport, aeration or others. We used the web service MNDClustering_Sequence (based on our MND clustering method [45] ) to classify the answers to these questions and to provide a sequence of clusters by each user. See Section 6.6.2 related to this new web service.
A data table was built with all the answers for each (user, timestamp) and is analyzed to generate a partition in 3 clusters for the experiment by calling the Focuslab MND webservice (cf. Section 6.2.5 ) which has been improved this year. The Output via MNDClusterSequence web service is a csv data file with for each user the sequence of 5 clusters obtained during the experiment.
Then we identified the users having changed their behaviour. We use the following UX rules to conclude on this property:
The result is "high" related to our two experiments. Note that other questions related to the usefulness of some MyGreenServices functionalities (alerts, forum, data synthesis, etc.) could be integrated in a more global rule for Usefulness.
Persuasive Technologies in Energy Economy
Participants : Bernard Senach, Anne-Laure Negri.
The ECOFFICES project [51] was for AxIS project team our first step towards eco-behaviour study. This research was complemented in 2012 with a literature review aiming at a deeper understanding of breaks and levers to eco behavior adoption. The work in this topic lead to a presentation (URL: http://www-sop.inria.fr/axis/papers/2012/GreenCode_2012 )in the mobility context during the GreenCode Forum (see the video on YouTube) and to an internal seminar for Axis members. A draft of an Inria research report on this topic has been started.
The two research lines "Energy Economy" and "Persuasive Technology" have been merged and an analysis of the Ecoffices challenge has been engaged in the light of works in the fields of Persuasive Technologies and Game Design. In this analysis, the Ecoffices Energy challenge is considered as an hybrid system combining gamification and persuasive principles. Using available models of each field, the experimental device used in the Ecoffices project is deconstructed and evaluated. The persuasive quality analysis relies on the Persuasive System Design model [62] . Concerning the gaming quality of Ecoffices, a first model (Octalysis http://www.yukaichou.com/gamification-examples/octalysis-complete-gamification-framework/ ) was discarded and we are now using the gamification principles from the literature for the analysis [76] .
At the end of 2012, we joined the work group PISTIL (Persuasive Interaction for SusTainabILity) and engaged several actions within this group and two papers are planned for the JIPS 2014 Special Issues on Persuasive Technologies (On-line journal : Journal d' Interaction Personne-Système, Journal of "Association Francophone d'Interaction Homme-Machine".): one on an analysis of the ECOFFICES challenge (under writing) and another on the design and evaluation of persuasive systems.
Persuasive Technologies in Green Services
Participants : Brigitte Trousse, Anne-Laure Negri, Mylène Leitzelman, Florian Bonacina, Caroline Tiffon.
The ELLIOT project was for AxIS project team our second step towards eco-behaviour study. It provided us a very rich context to study behaviour changes related to pollution awareness. Our experimental results showed a very promising tendancy in terms of user behaviour changes and the impact of MyGreenServices on leading user eco-behaviours [38] .
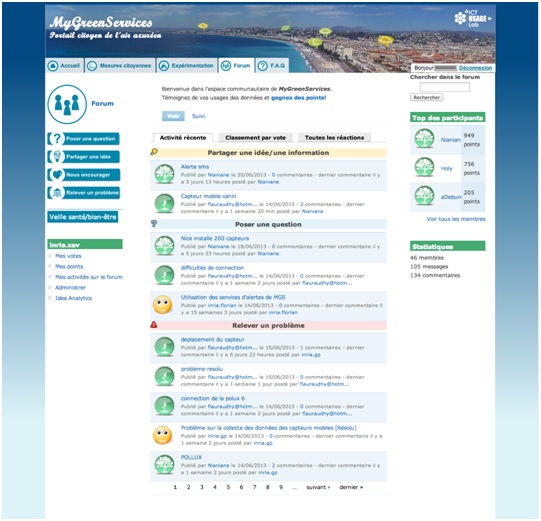
Persuasive technologies and gamification were used in the context of green Services use case. A specific focus was on gamification for the two customised Ideastream-based tools we developed for the co-creation step and mainly for the one used inside MyGreenServices platform (see Figure 5 ).


