

Section: New Results
Graph analysis of functional brain networks: practical issues in translational neurosciences
Participants : Fabrizio de Vico Fallani [correspondant] , Sophie Achard, Jonas Richiardi, Mario Chavez.
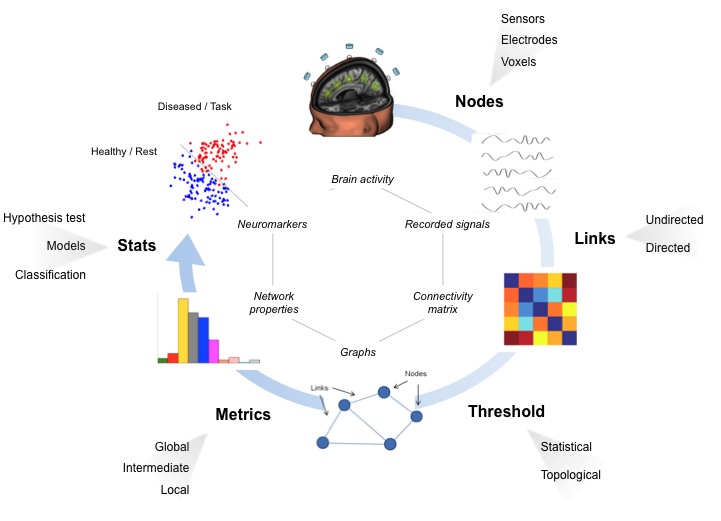
The brain can be regarded as a network: a connected system where nodes, or units, represent different specialized regions and links, or connections, represent communication pathways. From a functional perspective, communication is coded by temporal dependence between the activities of different brain areas. In the last decade, the abstract representation of the brain as a graph has allowed to visualize functional brain networks and describe their non-trivial topological properties in a compact and objective way. Nowadays, the use of graph analysis in translational neuroscience has become essential to quantify brain dysfunctions in terms of aberrant reconfiguration of functional brain networks. Despite its evident impact, graph analysis of functional brain networks is not a simple toolbox that can be blindly applied to brain signals. On the one hand, it requires the know-how of all the methodological steps of the pipeline that manipulate the input brain signals and extract the functional network properties. On the other hand, knowledge of the neural phenomenon under study is required to perform physiologically relevant analysis. The aim of our work is to provide practical indications to make sense of brain network analysis and contrast counterproductive attitudes.
|
More details in [11] .