

Section: New Results
Hierarchy of neural organisation in the zebra fish spinal cord: causality analysis of in-vivo calcium imaging data
Participants : Fabrizio de Vico Fallani [correspondant] , Martina Corazzol, Jnena Sternberg, Kevin Fidelin, Claire Wyart, Mario Chavez.
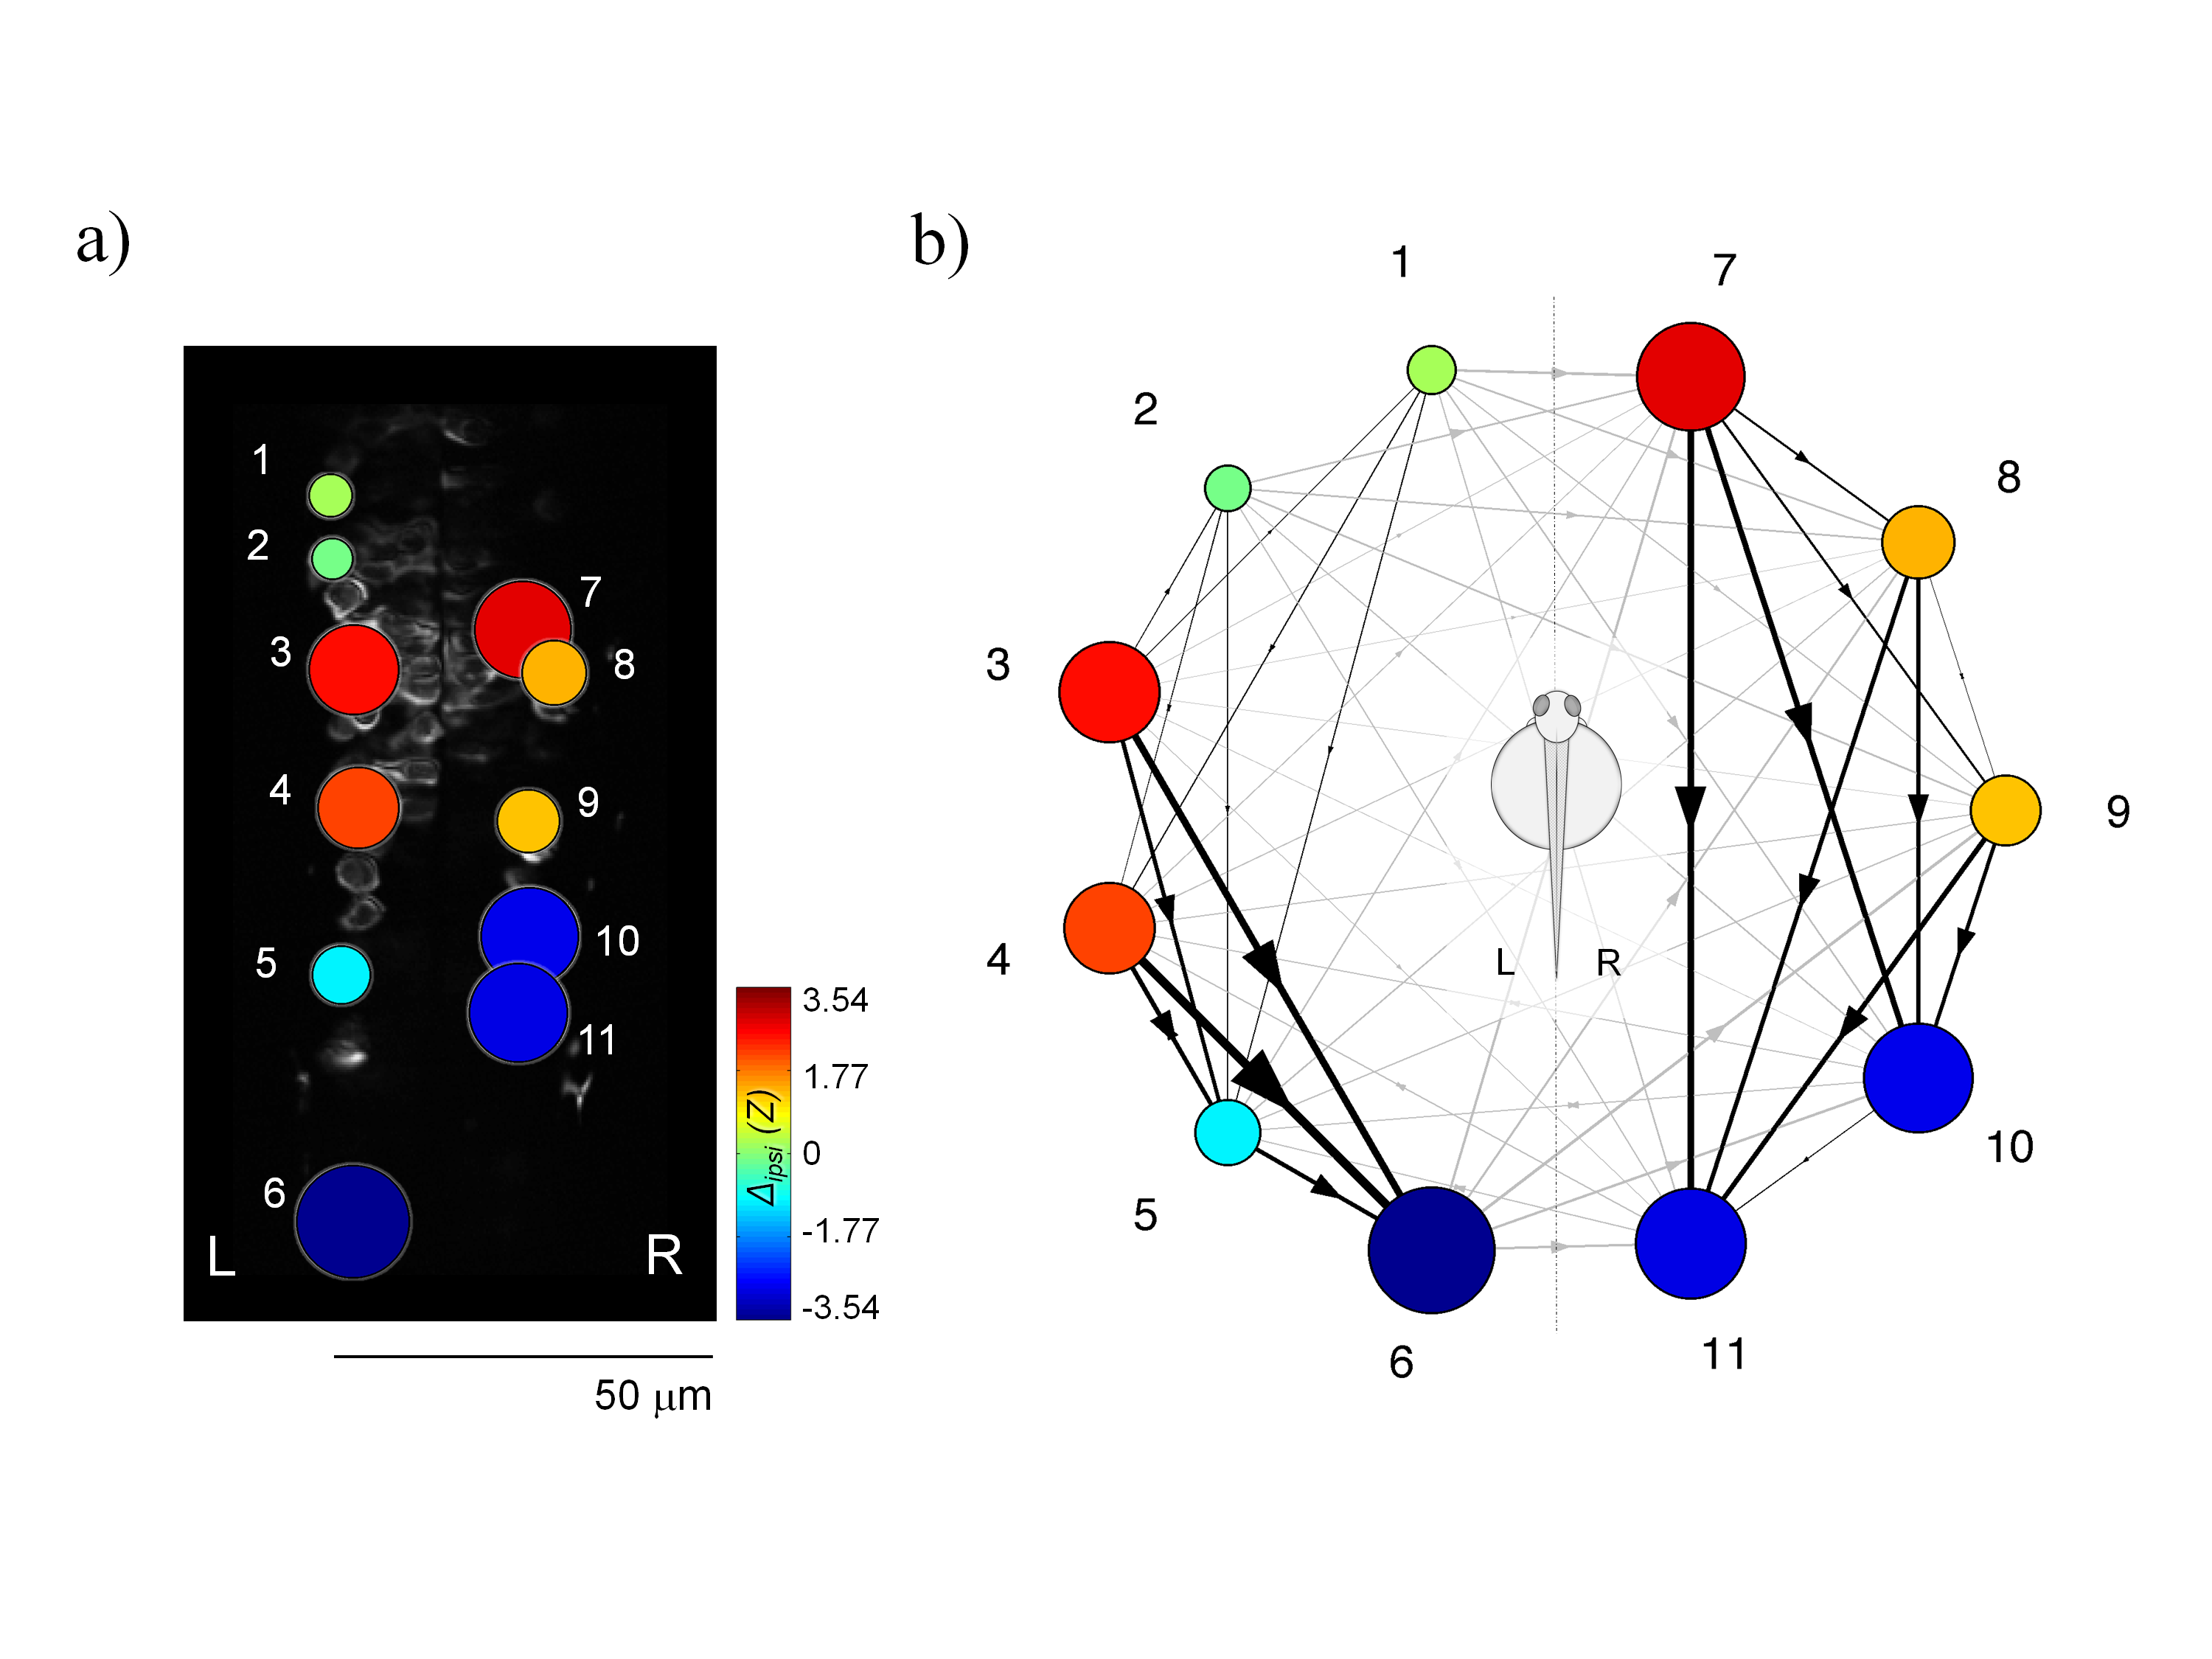
The recent development of genetically encoded calcium indicators enables monitoring in vivo the activity of neuronal populations. Most analysis of these calcium transients relies on linear regression analysis based on the sensory stimulus applied or the behavior observed. To estimate the basic properties of the functional neural circuitry, we propose a network-based approach based on calcium imaging recorded at single cell resolution. Differently from previous analysis based on cross-correlation, we used Granger causality estimates to infer activity propagation between the activities of different neurons. The resulting functional networks were then modeled as directed graphs and characterized in terms of connectivity and node centralities. We applied our approach to calcium transients recorded at low frequency (4 Hz) in ventral neurons of the zebrafish spinal cord at the embryonic stage when spontaneous coiling of the tail occurs. Our analysis on population calcium imaging data revealed a strong ipsilateral connectivity and a characteristic hierarchical organization of the network hubs that supported established propagation of activity from rostral to caudal spinal cord. Our method could be used for detecting functional defects in neuronal circuitry during development and pathological conditions.
|
More details in [9] .