

Section: New Software and Platforms
MakerVis
Participants : Sai Ganesh Swaminathan, Shi Conglei, Yvonne Jansen, Pierre Dragicevic [correspondant] , Lora Oehlberg, Jean-Daniel Fekete.
|
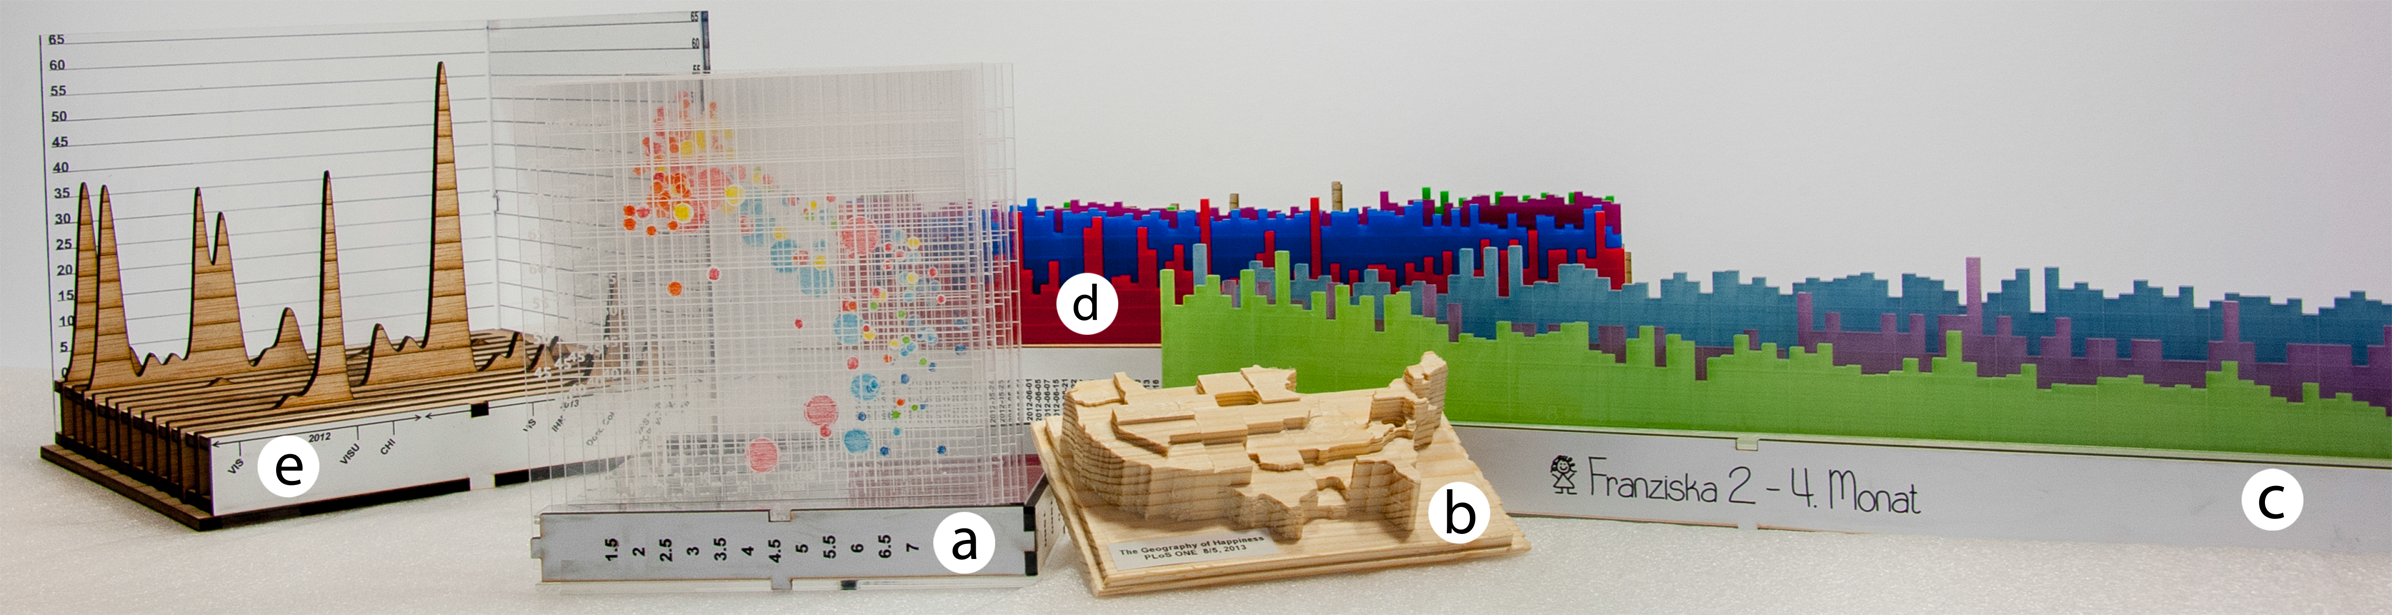
An increasing variety of physical visualizations are being built, for purposes ranging from art and entertainment to business analytics and scientific research. However, crafting them remains a laborious process and demands expertise in both data visualization and digital fabrication. We created the MakerVis prototype [34] , the first tool that integrates the whole workflow, from data filtering to physical fabrication. The design of MakerVis tries to overcome the limitations of current workflows, that we initially analyzed through three real case studies. Design sessions with three end users shows that tools such as MakerVis can dramatically lower the barriers behind producing physical visualizations. Observations and interviews also revealed important directions for future research. These include rich support for customization, and extensive software support for materials that accounts for their unique physical properties as well as their limited supply.
More details on the Web page: www.aviz.fr/makervis