

Section: New Results
Assessing Visualization Literacy
Participants : Jeremy Boy, Ronald A. Rensink, Enrico Bertini, Jean-Daniel Fekete.
|
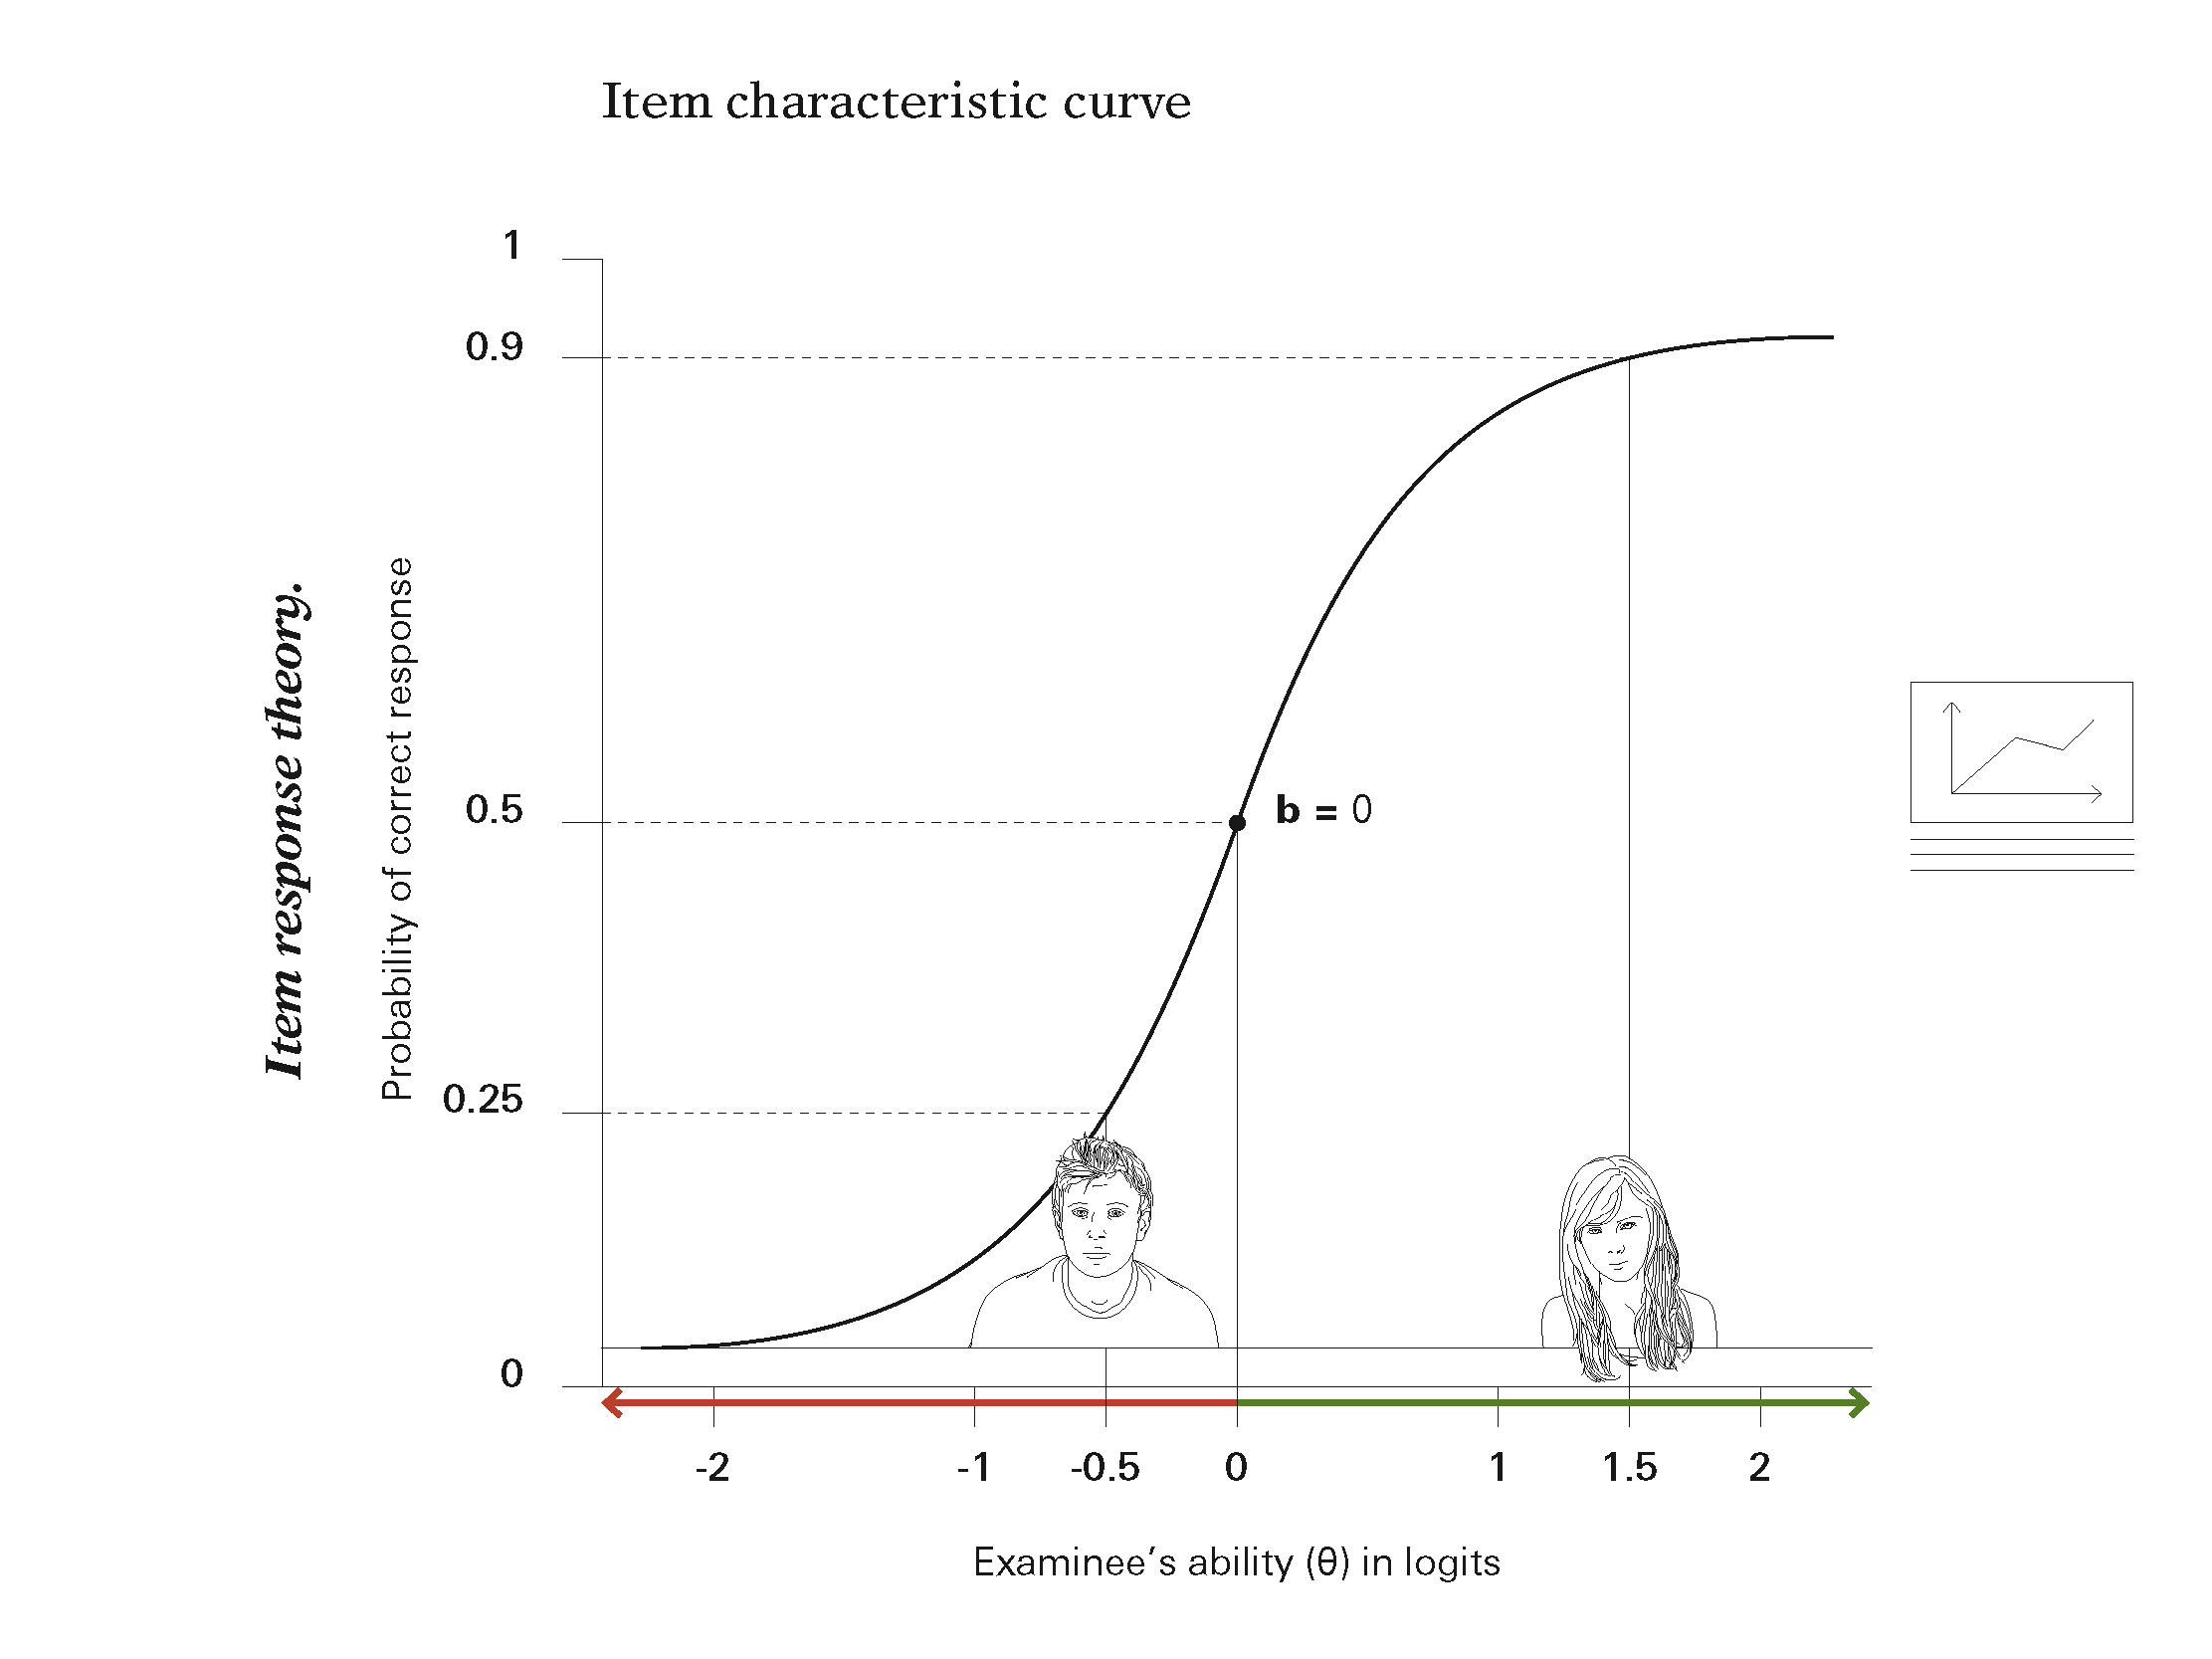
We described a method for assessing the visualization literacy (VL) of a user [14] . Assessing how well people understand visualizations has great value for research (e.g., to avoid confounds), for design (e.g., to best determine the capabilities of an audience), for teaching (e. g., to assess the level of new students), and for recruiting (e. g., to assess the level of interviewees). In this project we proposed a method for assessing VL based on Item Response Theory. We described the design and evaluation of two VL tests for line graphs, and presents the extension of the method to bar charts and scatterplots. Finally, we discussed the reimplementation of these tests for fast, effective, and scalable web-based use.
More on the project Web page: peopleviz/vLiteracy/home .