

Section: New Results
HCI Requirements for Progressive Data Analysis
Participants : Jean-Daniel Fekete [correspondant] , Sriram Karthik Badam, Niklas Elmqvist.
|
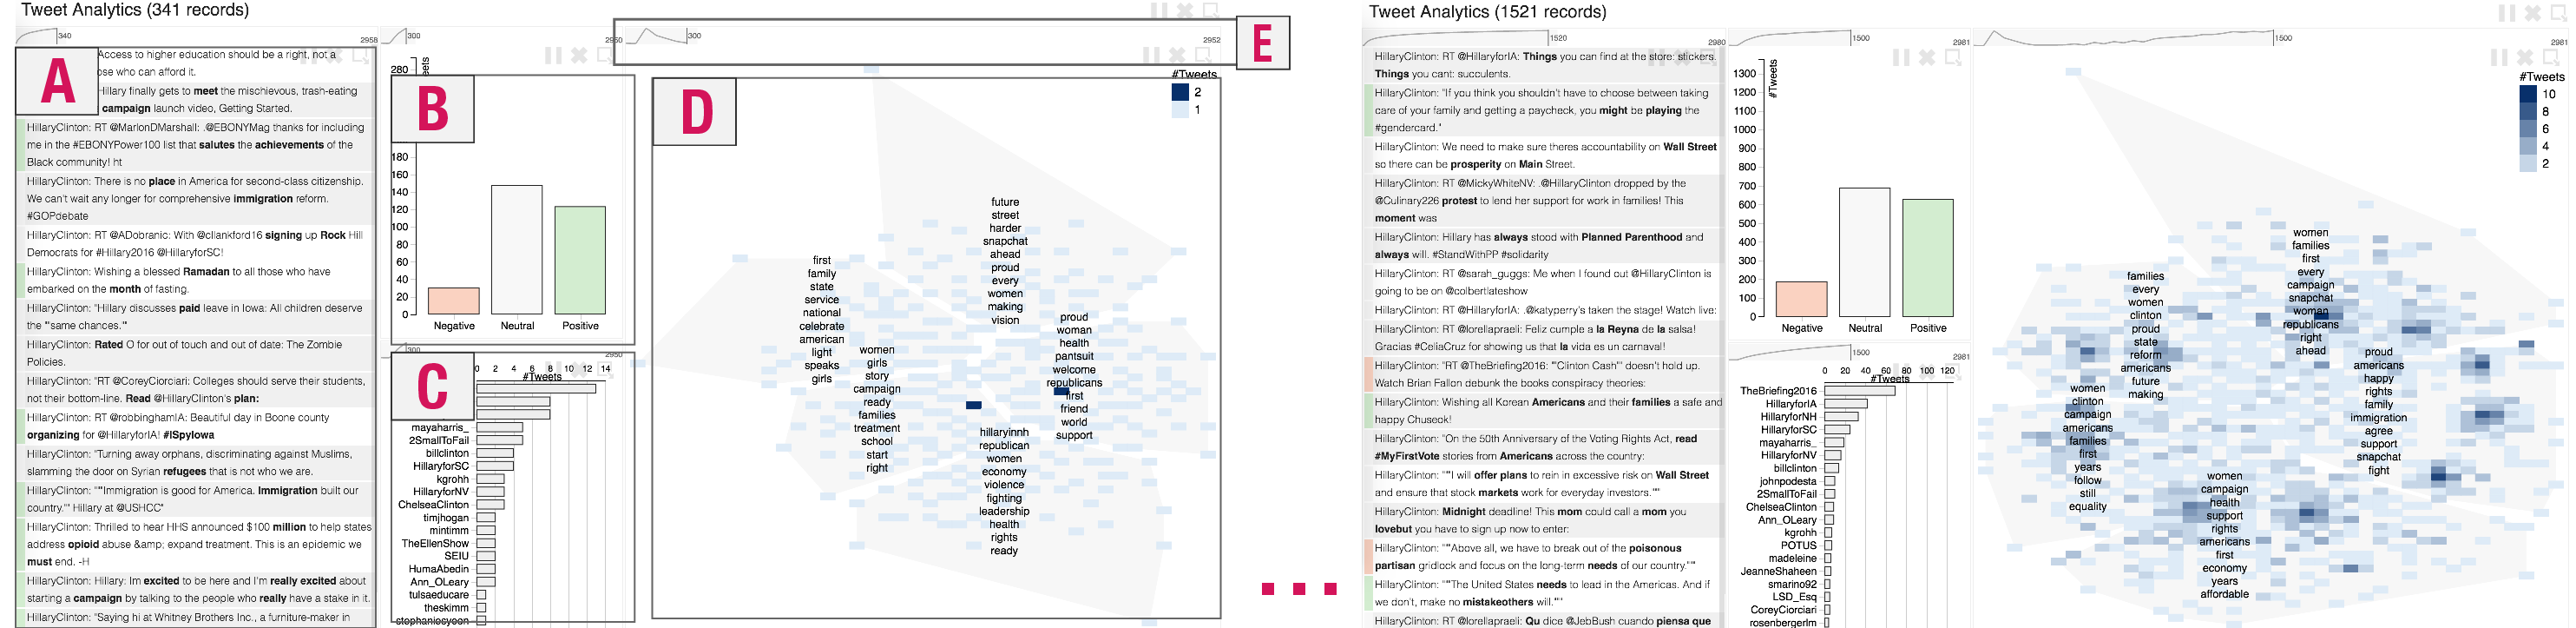
Progressive visual analytics (PVA) has emerged in recent years to manage the latency of data analysis systems. When analysis is performed progressively, rough estimates of the results are generated quickly and are then improved over time. Analysts can therefore monitor the progression of the results, steer the analysis algorithms, and make early decisions if the estimates provide a convincing picture. In this article, we describe interface design guidelines for helping users understand progressively updating results and make early decisions based on progressive estimates. To illustrate our ideas, we present a prototype PVA tool called INSIGHTSFEED for exploring Twitter data at scale. As validation, we investigate the tradeoffs of our tool when exploring a Twitter dataset in a user study. We report the usage patterns in making early decisions using the user interface, guiding computational methods, and exploring different subsets of the dataset, compared to sequential analysis without progression.
More on the project Web page: ProgressiveDataAnalysis.