

Section: New Results
Glanceable Visualizations for Smartwatches
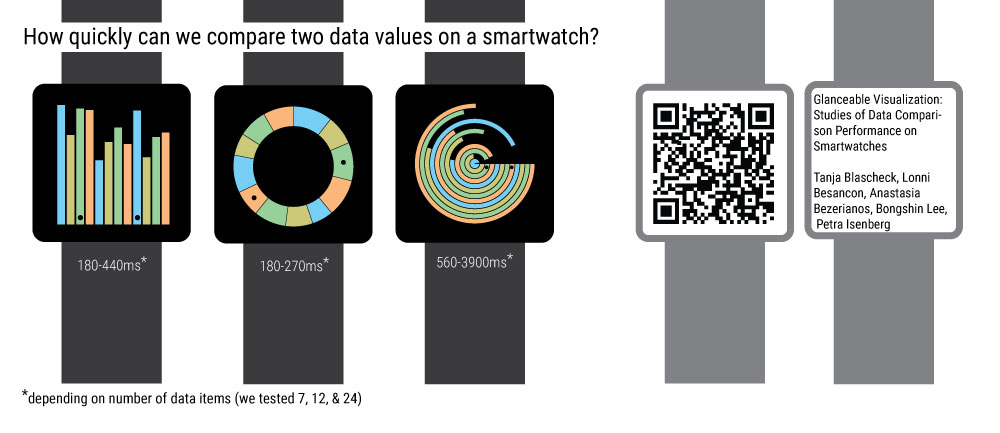
Participants : Tanja Blascheck [correspondant] , Lonni Besançon [Linköpping University] , Anastasia Bezerianos, Bongshin Lee [Microsoft Research] , Petra Isenberg.
The goal of this project is to study very small data visualizations, micro visualizations, in display contexts that can only dedicate minimal rendering space for data representations. Specifically, we define micro visualizations as small-scale visualizations that lack or have a limited set of reference structures such as labels, data axes, or grid lines and have a small physical footprint of a few square centimeters. Micro visualizations can be as simple as small unit-based visualizations such as a battery indicator but also include multi-dimensional visualizations such as star glyphs, small geographic visualizations or even small network visualizations. Although micro visualizations are essential to mobile visualization contexts, we know surprisingly little about their general visual and interaction design space or people's ability in interpreting micro visualizations. We will address this gap by proposing a common framework, conducting empirical studies to understand people's abilities to interpret these visualizations while in motion, and by developing a software toolkit to aid practitioners in developing micro visualizations for emerging mobile and wearable displays.
In summary, we aim at paving the way for a pervasive use of visualizations and thus a better and broader understanding of the complex world around us.
More information in related publications ([1],[48]) and on the project Web page: https://www.aviz.fr/smartwatchperception.