

Section: New Results
Classification and Modeling of the Fibronectin Networks in Extracellular Matrices
Participants : Anca-Ioana Grapa, Laure Blanc-Féraud, Xavier Descombes.
This work is done in collaboration with Ellen Van Obberghen-Schilling and Georgios Efthymiou (iBV).
We are interested in the numerical analysis and modeling of the Fibronectin (FN) networks, a major extracellular matrix (ECM) molecule, expressed in pathological states (fibrosis, cancer, etc). Our goal is to develop numerical quantitative biomarkers that describe the geometrical organization of the different four variants of the FN fiber networks, from 2D confocal microscopy images. Since the functions of these variants are not well defined in the context of their role within the tumour microenvironment, we hope that a computational model might be able to provide a meaningful description that incorporates the structural differences among the variants.
In a previous work, we have derived a pipeline to classify a given tissue among the four FN variants (cell-derived matrices), based on a decomposition into discrete fast curvelet transform coefficients. We ensured the invariance to rotation of the coefficients and then fed them to a DAG-SVM multiclassifier, in order to prove their discriminative ability in the context of classification of the four FN variants. The results were published in [24] and show that the curvelet coefficients are capable of discerning among the four FN variants with similar performances to those of a human annotator.
The second step of our work consisted in setting up the modeling of the FN networks starting from a graph-based representation, built on top of Gabor features (fiber scale, orientation, etc). The graph parameters corresponding to the geometrical and topological features of the improved skeletonizations (i.e. median pore circularity, ratio of fiber thinness, fiber thickness kurtosis, fiber connectivity) of the four FN variants, are then classified by a DAG-SVM. It is thus shown through the analysis of the feature distribution over the four variants, features PCA analysis and SVM-based classification, that graph features can discriminate among the FN variants almost as well as our first work. This proves that the graph representation embeds the most relevant information provided by the image.
The next step focused on the development of a metric between graphs that takes into account their topology and geometry. This distance is bound to provide a quantitative but also a qualitative comparison of the four FN variants as well as a differentiation between normal and tumour-like FN fibers. In order to evaluate the distance among graphs, we have referred to graph-matching techniques, which are considered standard problems that deal with graph comparison. The main idea is to obtain an evaluation of the similarity between two graphs, by finding the optimal correspondence between their nodes, such as to align their structure, i.e their adjacency matrices. We expect to obtain invariance with respect to translation, rotation and scale.
|
More specifically, we are interested in one of the various techniques to perform many-to-many graph matching [32], where the merging of multiple nodes to match another one is allowed, especially in the case of graphs with different dimensions (i.e. different number of total vertices). Alternatively, we considered a different line of work, based on optimal transport for the comparison of structured objects (e.g. graphs) with associated probability distributions. We focus on the work of Peyré et al. [26] that have considered a metric called Gromov-Wasserstein, capable of comparing objects that lie in spaces with different dimensions, by minimizing the cost of mass transport from one discrete distribution to the other. In the context of graph matching techniques, this can be regarded as a probabilistic assignment problem.
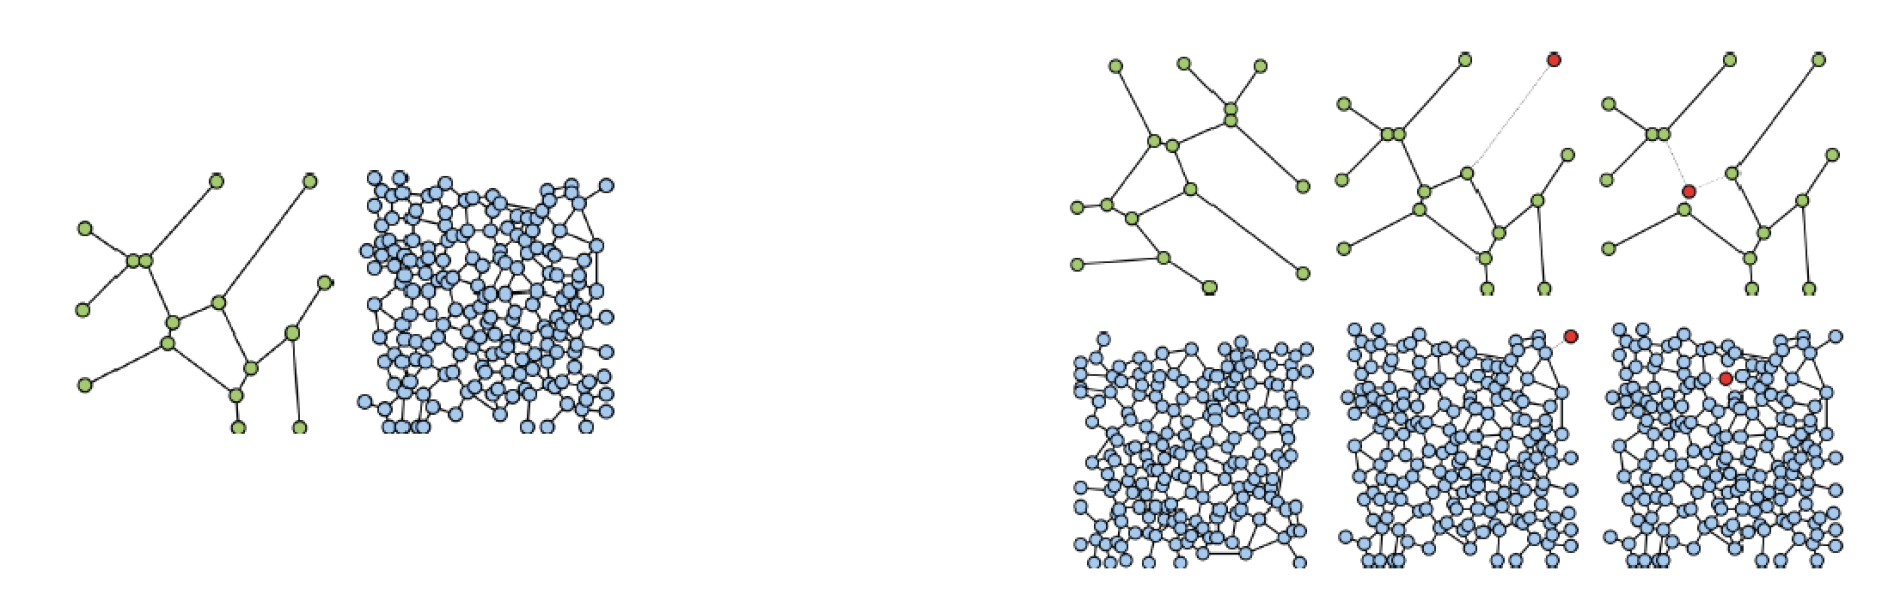
In [13], we have compared the two aforementioned approaches from a graph-matching perspective, on randomly generated graphs (Figure 3), in the context of a preliminary study for the future modeling of FN graph-based representations. We have tested different graph scenarios, with various information captured by the adjacency matrix (binary adjacency matrix, shortest path between nodes). Moreover, we have slightly modified the second method by optimal transport, to make it feasible for direct one-to-one matching, by adding dummy masses. We have concluded that the graph matching by many-to-many assignment, captures a meaningful distance between two given graphs with good performances, while the Gromov-Wasserstein discrepancy is computed faster but with lower performances.
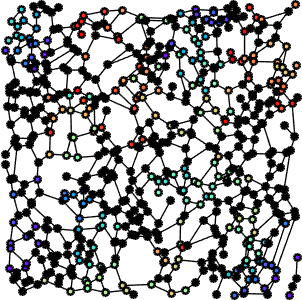
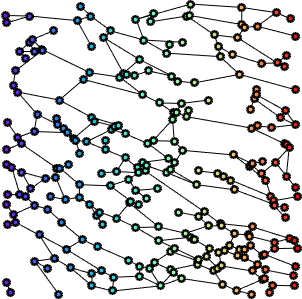
One advantage of using graph-matching techniques for comparing fiber networks, comes from the possibility of defining a median graph that will be representative of a FN class. Currently, we are developing methodologies for deriving the representative graph for FN variants, using the metric provided by the many-to-many graph assignment problem. The challenges range from deciding a good technique to perform a meaningful matching among the graphs, to determining the adjacency of the median graph and the corresponding physical localization of the nodes.
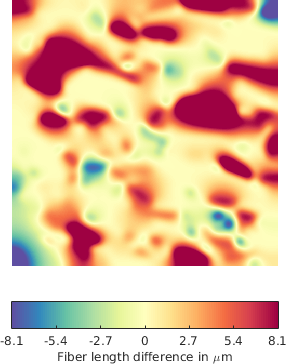
A second advantage is given by the possibility of computing various deformation maps between FN fiber networks: the matching serves as a registration between the graphs, and once after having obtained an assignment between the corresponding graph edges, we can compute the differences in terms of fiber length, orientation, etc (see Figure 4 for a example of a deformation map in terms of fiber length - which can be regarded as a local stretching of the fibers that should be applied to first graph in order to obtain the second one)).
The deformation maps can subsequently be analyzed in a test hypothesis framework that decides whether the variation of a certain parameter (e.g. length) is due to the the variance within the same class or not.
|
Once we have derived a meaningful median graph based on graph-matching distances, we might be able to perform classification of the graph networks. Additionally, the fiber properties statistics inferred from the graph local properties, as well as Gabor filters parameters, can be of use to interpret the local differences within a specific class and among FN variants.
Anca Grapa's work is supported by the French Government (National Research Agency, ANR) through the ”Investments for the Future” LABEX SIGNALIFE: program reference ANR-11-LABX-0028-01.