Section: New Results
Classification of the Fibronectin Networks in Extracellular Matrices using CNN and DAG-SVM of confocal and coverslip scanner images
Participants : Ghosh Avrajit, Anca-Ioana Grapa, Laure Blanc-Féraud, Xavier Descombes.
This work is done in collaboration with Ellen Van Obberghen-Schilling and Georgios Efthymiou (iBV).
We are interested in the numerical analysis and modeling of the Fibronectin (FN) networks, a major extracellular matrix (ECM) molecule, expressed in pathological states (fibrosis, cancer, etc).
Firstly, during one experiment, confocal images pixels with a lateral resolution of m/pixel were acquired with a Zeiss LSM710 confocal system with the pinhole diameter set to its maximal value. Subsequently, images of FN variants in a different experiment were acquired using a coverslip scanner (Vectra Polaris Automated Quantitative Pathology Imaging System) based on fluorescence whole-slide scanning on a similar resolution to that of the confocal system.
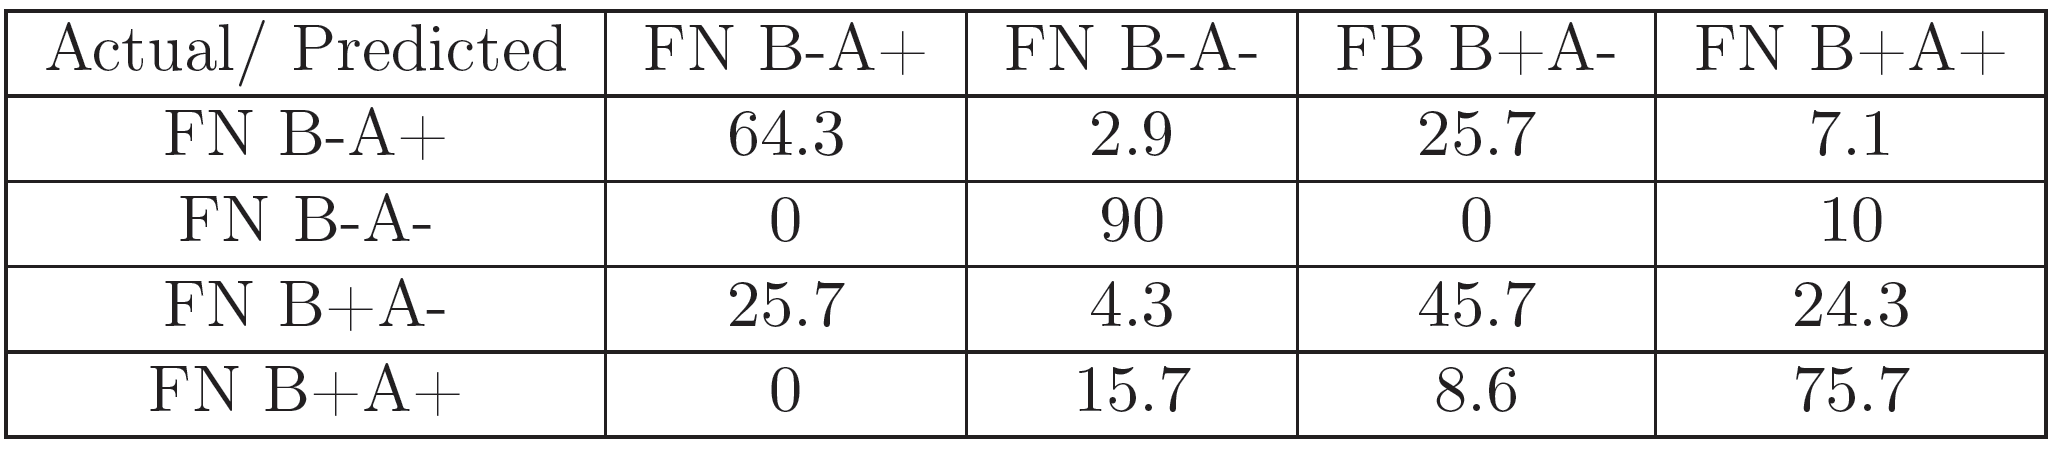
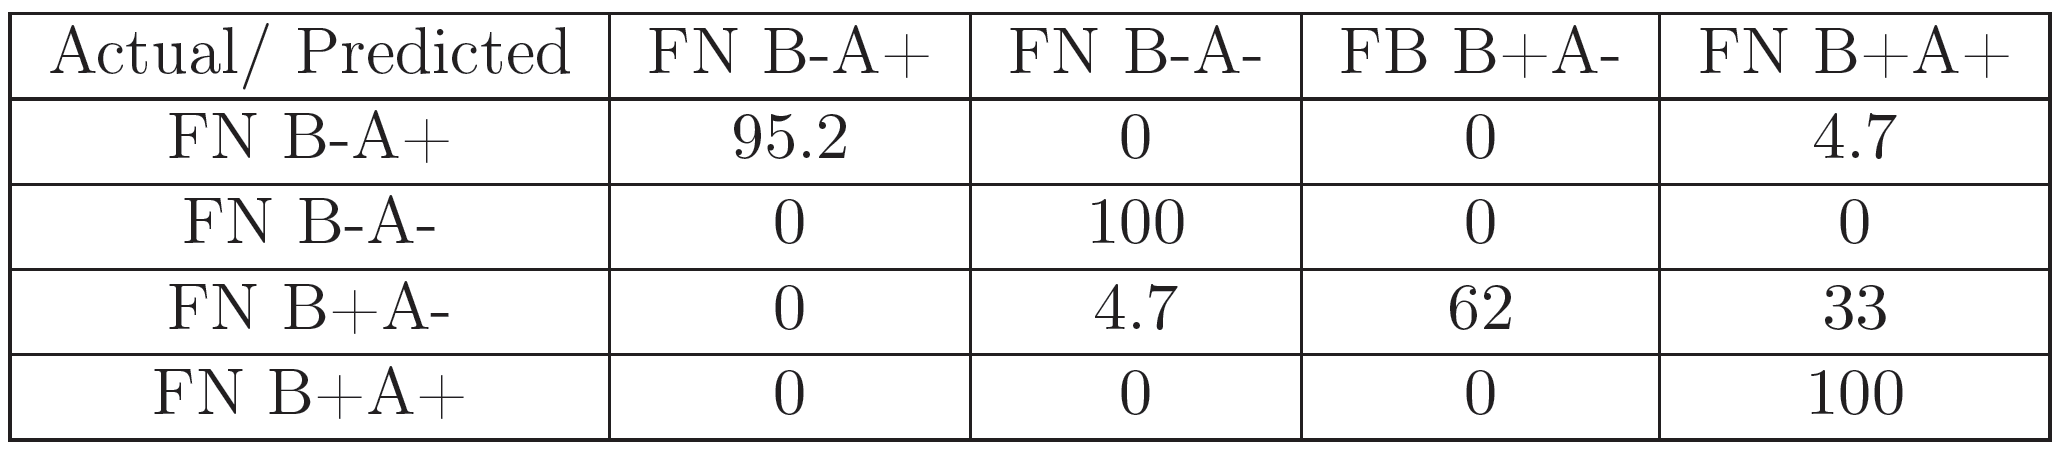
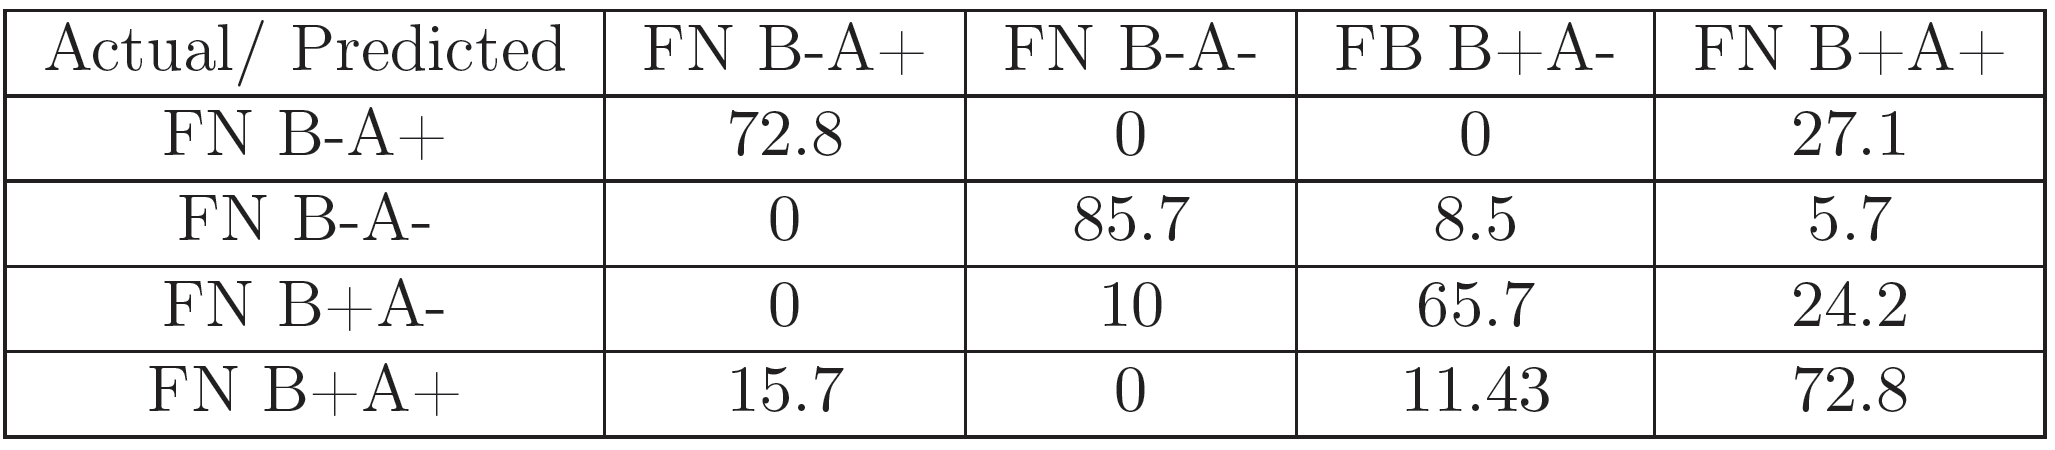
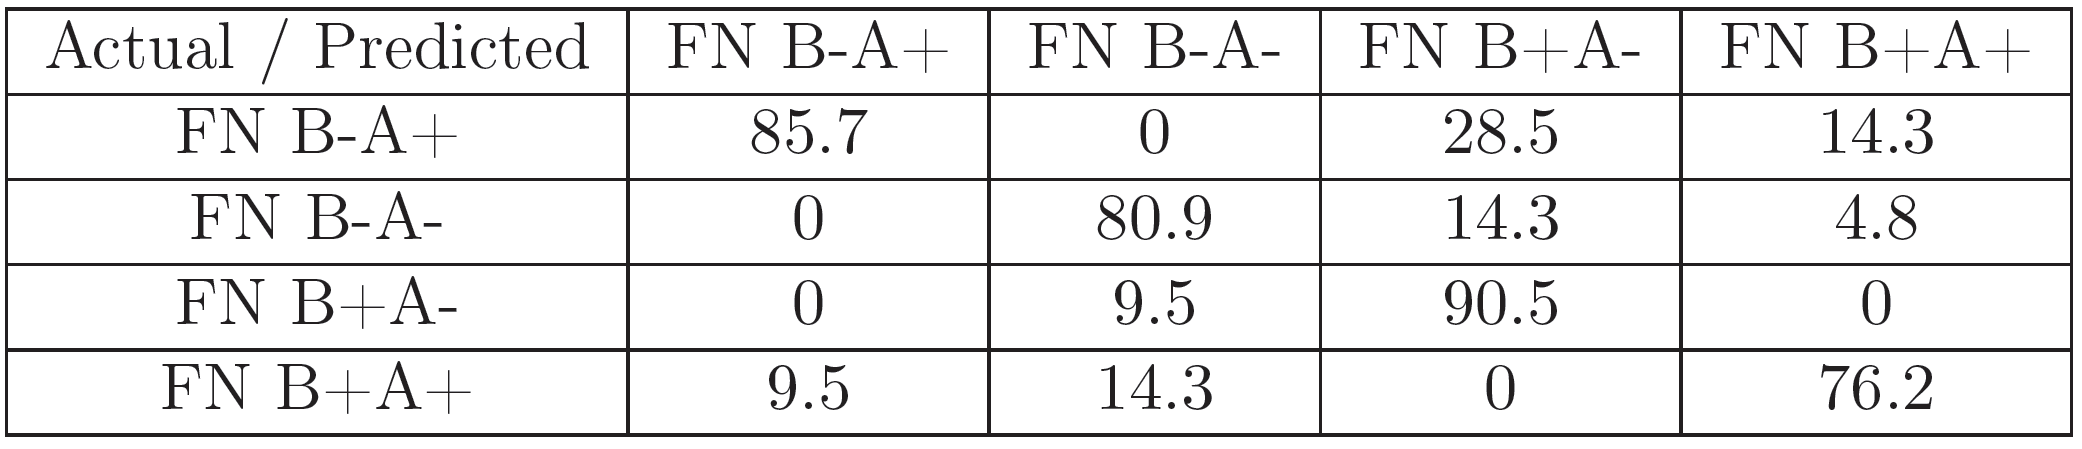
For each of the experiments, 70 images (for every FN variant) corresponding to a representative region of pixels were selected for feature extraction and classification.The set of 280 gray-scale images was classified with a DAG-SVM classifier using curvelet features using the parametrization from [24]. Additionally, it was classified with the GoogLeNet [30] pretrained Convolutional Neural Net (CNN) architecture using the MATLAB Deep Learning Toolbox and a 22-layer deep network trained on more than 1 million images for classification into 1000 object categories. A set of 196 images was used for the training of the algorithm, and the remaining 84 for testing it. The training image set was presented to the algorithm 25 times (epochs), in order to improve classification accuracy.
The results (Figures 5, 7, 6, and 8) show that the information in the FN images is relevant enough in a CNN-based classification to distinguish FN variants better than curvelet-based features. Additionally, the coverslip scanner acquired samples are classified with a higher accuracy, underlining the potential benefit of using the scanner for future experiments.
|
|