
Keywords
Computer Science and Digital Science
- A3.1.7. Open data
- A3.1.10. Heterogeneous data
- A3.1.11. Structured data
- A3.2.4. Semantic Web
- A3.2.5. Ontologies
- A3.2.6. Linked data
- A5.1. Human-Computer Interaction
- A5.1.1. Engineering of interactive systems
- A5.1.2. Evaluation of interactive systems
- A5.1.5. Body-based interfaces
- A5.1.6. Tangible interfaces
- A5.1.9. User and perceptual studies
- A5.2. Data visualization
- A5.5.4. Animation
- A5.6.1. Virtual reality
- A5.6.2. Augmented reality
Other Research Topics and Application Domains
- B9.5.3. Physics
- B9.5.6. Data science
- B9.6.7. Geography
- B9.7.2. Open data
- B9.11. Risk management
1 Team members, visitors, external collaborators
Research Scientists
- Emmanuel Pietriga [Team leader, Inria, Senior Researcher, HDR]
- Caroline Appert [CNRS, Senior Researcher, HDR]
- Olivier Chapuis [CNRS, Researcher]
Faculty Member
- Anastasia Bezerianos [Univ Paris-Sud, Associate Professor, HDR]
Post-Doctoral Fellow
- Vanessa Pena Araya [Inria]
PhD Students
- Eugenie Brasier [Univ Paris-Sud]
- Mehdi Chakhchoukh [Univ Paris-Saclay, from Oct 2020]
- Emmanuel Courtoux [Univ Paris-Sud]
- Marie Destandau [Inria]
- Raphael James [Univ Paris-Sud]
- Tong Xue [Inria, until Mar 2020]
Technical Staff
- Dylan Lebout [Inria, Engineer]
Interns and Apprentices
- Mehdi Chakhchoukh [Univ Paris-Saclay, from Apr 2020 until Jun 2020]
- Maya Gawinowski [Inria, from Apr 2020 until Jun 2020]
Administrative Assistant
- Katia Evrat [Inria, from Oct 2020]
2 Overall objectives
In an increasing number of domains, computer users are faced with large datasets, that are often interlinked and organized according to elaborate structures thanks to new data models such as those that are arising with the development of, e.g., the Web of Data. Rather than seeing the inherent complexity of those data models as a hindrance, we aim at leveraging it to design new interactive systems that can better assist users in their data understanding and processing tasks.
These “Data-centric Interactive Systems” aim at providing users with the right information at the right time, presenting it in the most meaningful manner, and letting users efficiently manipulate, edit and share these data with others. This entails minimizing the effort required to retrieve and relate data from relevant sources; displaying data using visual presentation techniques that match the data's characteristics and the users' tasks; and providing users with means of interacting with the data that effectively support their train of thought.
Our approach is based on the idea of bringing the fields of Web data management 28 and Human-computer interaction 45, 66 closer together, based on the strong belief that they have the potential to cross-fertilize one another. User interface design is essential to the management and understanding of large, heterogeneous and interlinked datasets. Interlinked datasets enriched with even a small amount of semantics have the potential to help create interfaces that let users analyze and manipulate data in a more efficient manner by providing them with, e.g., more relevant query results and giving them efficient means to navigate and relate those results. Our ultimate, long-term goal is to design interactive systems that make it as straightforward to manipulate large webs of data as spreadsheets do for tabular data.
3 Research program
3.1 Introduction
Our ability to acquire or generate, store, process, interlink and query data has increased spectacularly over the last few years. The corresponding advances are commonly grouped under the umbrella of so called Big Data. Even if the latter has become a buzzword, these advances are real, and they are having a profound impact in domains as varied as scientific research, commerce, social media, industrial processes or e-government. Yet, looking ahead, technologies related to what we now call the Web of Data (a.k.a the Semantic Web) have the potential to create an even larger revolution in data-driven activities, by making information accessible to machines as semistructured data 27 that eventually becomes actionable knowledge. Indeed, novel Web data models considerably ease the interlinking of semi-structured data originating from multiple independent sources. They make it possible to associate machine-processable semantics with the data. This in turn means that heterogeneous systems can exchange data, infer new data using reasoning engines, and that software agents can cross data sources, resolving ambiguities and conflicts between them 64. Datasets are becoming very rich and very large. They are gradually being made even larger and more heterogeneous, but also much more useful, by interlinking them, as exemplified by the Linked Data initiative 43.
These advances raise research questions and technological challenges that span numerous fields of computer science research: databases, communication networks, security and trust, data mining, as well as human-computer interaction. Our research is based on the conviction that interactive systems play a central role in many data-driven activity domains. Indeed, no matter how elaborate the data acquisition, processing and storage pipelines are, data eventually get processed or consumed one way or another by users. The latter are faced with large, increasingly interlinked heterogeneous datasets that are organized according to complex structures, resulting in overwhelming amounts of both raw data and structured information. Users thus require effective tools to make sense of their data and manipulate them.
We approach this problem from the perspective of the Human-Computer Interaction (HCI) field of research, whose goal is to study how humans interact with computers and inspire novel hardware and software designs aimed at optimizing properties such as efficiency, ease of use and learnability, in single-user or cooperative work contexts. More formally, HCI is about designing systems that lower the barrier between users' cognitive model of what they want to accomplish, and computers' understanding of this model. HCI is about the design, implementation and evaluation of computing systems that humans interact with 45, 66. It is a highly multidisciplinary field, with experts from computer science, cognitive psychology, design, engineering, ethnography, human factors and sociology.
In this broad context, ILDA aims at designing interactive systems that display 34, 50, 73 the data and let users interact with them, aiming to help users better navigate and comprehend large datasets represented visually 259, as well as relate and manipulate them.
Our research agenda consists of the three complementary axes detailed in the following subsections. Designing systems that consider interaction in close conjunction with data structure and semantics is pivotal to all three axes. This will help drive navigation in, and manipulation of, the data, so as to optimize the communication bandwidth between users and data.
3.2 Novel Forms of Display for Groups and Individuals
Participants: Caroline Appert, Anastasia Bezerianos, Olivier Chapuis, Emmanuel Pietriga, Vanessa Peña-Araya, Eugénie Brasier, Mehdi Chakhchoukh, Raphaël James, Dylan Lebout.
Data sense-making and analysis is not limited to individual users working with a single device, but increasingly involves multiple users working together in a coordinated manner in multi-display environments: workstations, wall displays, handheld devices, mixed reality. We investigate how to empower users working with complex data by leveraging novel types of displays and combinations of displays, designing visualizations adapted to their capabilities.
The foundational question addressed here is what to display when, where and how, so as to provide effective support to users in their data understanding and manipulation tasks. ILDA targets contexts in which workers have to interact with complementary views on the same data, or with views on different-but-related datasets, possibly at different levels of abstraction. Being able to combine or switch between representations of the data at different levels of detail and merge data from multiple sources in a single representation is central to many scenarios. This is especially true in both of the application domains we consider: mission-critical systems (e.g., natural disaster crisis management) and the exploratory analysis of scientific data (e.g., correlate theories and heterogeneous observational data for an analysis of a given celestial body in Astrophysics).
A significant part of our research over the last ten years has focused on multi-scale interfaces. We designed and evaluated novel interaction techniques, but also worked actively on the development of open-source UI toolkits for multi-scale interfaces. These interfaces let users navigate large but relatively homogeneous datasets at different levels of detail, on both workstations 62, 30, 58, 57, 56, 31, 55, 29, 61 and wall-sized displays 52, 46, 60, 51, 32, 36, 35. This part of the ILDA research program is about extending multi-scale navigation in two directions: 1. Enabling the representation of multiple, spatially-registered but widely varying, multi-scale data layers in Geographical Information Systems (GIS); 2. Generalizing the multi-scale navigation paradigm to interconnected, heterogeneous datasets as found on the Web of Data.
The first research problem has been mainly investigated in collaboration with IGN in the context of ANR project MapMuxing, which stands for multi-dimensional map multiplexing, from 2014 to early 2019. Project MapMuxing aimed at going beyond the traditional pan & zoom and overview+detail interface schemes, and at designing and evaluating novel cartographic visualizations that rely on high-quality generalization, i.e., the simplification of geographic data to make it legible at a given map scale 69, 70, and symbol specification. Beyond project MapMuxing, we are also investigating multi-scale multiplexing techniques for geo-localized data in the specific context of ultra-high-resolution wall-sized displays, where the combination of a very high pixel density and large physical surface enable us to explore designs that involve collaborative interaction and physical navigation in front of the workspace.
The second research problem is about the extension of multi-scale navigation to interconnected, heterogeneous datasets. Generalization has a rather straightforward definition in the specific domain of geographical information systems, where data items are geographical entities that naturally aggregate as scale increases. But it is unclear how generalization could work for representations of the more heterogeneous webs of data that we consider in the first axis of our research program. Those data form complex networks of resources with multiple and quite varied relationships between them, that cannot rely on a single, unified type of representation (a role played by maps in GIS applications).
Relevant publications by team members this year: 22, 21, 19, 24, 23, 13, 20, 26.
3.3 Novel Forms of Input for Groups and Individuals
Participants: Caroline Appert, Anastasia Bezerianos, Olivier Chapuis, Emmanuel Pietriga, Eugénie Brasier, Emmanuel Courtoux, Raphaël James.
Analyzing and manipulating large datasets can involve multiple users working together in a coordinated manner in multi-display environments: workstations, handheld devices, wall-sized displays 32. Those users work towards a common goal, navigating and manipulating data displayed on various hardware surfaces in a coordinated manner. Group awareness 42, 40 is central in these situations, as users, who may or may not be co-located in the same room, can have an optimal individual behavior only if they have a clear picture of what their collaborators have done and are currently doing in the global context. We work on the design and implementation of interactive systems that improve group awareness in co-located situations 47, making individual users able to figure out what other users are doing without breaking the flow of their own actions.
In addition, users need a rich interaction vocabulary to handle large, structured datasets in a flexible and powerful way, regardless of the context of work. Input devices such as mice and trackpads provide a limited number of input actions, thus requiring users to switch between modes to perform different types of data manipulation and navigation actions. The action semantics of these input devices are also often too much dependent on the display output. For instance, a mouse movement and click can only be interpreted according to the graphical controller (widget) above which it is moved. We focus on designing powerful input techniques based upon technologies such as tactile surfaces (supported by UI toolkits developed in-house), 3D motion tracking systems, or custom-built controllers 49to complement (rather than replace) traditional input devices such as keyboards, that remain the best method so far for text entry, and indirect input devices such as mice or trackpads for pixel-precise pointing actions.
The input vocabularies we investigate enable users to navigate and manipulate large and structured datasets in environments that involve multiple users and displays that vary in their size, position and orientation 32, 41, each having their own characteristics and affordances: wall displays 52, 75, workstations, tabletops 54, 39, tablets 53, 71, smartphones 74, 37, 67, 68, and combinations thereof 38, 72, 51, 32.
We aim at designing rich interaction vocabularies that go far beyond what current touch interfaces offer, which rarely exceeds five gestures such as simple slides and pinches. Designing larger gesture vocabularies requires identifying discriminating dimensions (e.g., the presence or absence of anchor points and the distinction between internal and external frames of reference 53) in order to structure a space of gestures that interface designers can use as a dictionary for choosing a coherent set of controls. These dimensions should be few and simple, so as to provide users with gestures that are easy to memorize and execute. Beyond gesture complexity, the scalability of vocabularies also depends on our ability to design robust gesture recognizers that will allow users to fluidly chain simple gestures that make it possible to interlace navigation and manipulation actions.
We also study how to further extend input vocabularies by combining touch 53, 74, 54 and mid-air gestures 52 with physical objects 44, 65, 49 and classical input devices such as keyboards to enable users to input commands to the system or to involve other users in their workflow (request for help, delegation, communication of personal findings, etc.) 33, 48. Gestures and objects encode a lot of information in their shape, dynamics and direction, that can be directly interpreted in relation with the user, independently from the display output. Physical objects can also greatly improve coordination among actors for, e.g., handling priorities or assigning specific roles.
3.4 Interacting with Diverse Data
Participants: Emmanuel Pietriga, Caroline Appert, Anastasia Bezerianos, Mehdi Chakhchoukh, Marie Destandau, Tong Xue, Dylan Lebout.
Research in data management is yielding novel models that enable diverse structuring and querying strategies, give machine-processable semantics to the data and ease their interlinking. This, in turn, yields datasets that can be distributed at the scale of the Web, highly-heterogeneous and thus rich but also quite complex. We investigate ways to leverage this richness from the users' perspective, designing interactive systems adapted to the specific characteristics of data models and data semantics of the considered application area.
To be successful, interaction paradigms that let users navigate and manipulate data on the Web have to be tailored to the radically different way of browsing information enabled by it, where users directly interact with the data rather than with monolithic documents. The general research question addressed in this part of our research program is how to design novel interaction techniques that help users manipulate their data more efficiently. By data manipulation, we mean all low-level tasks related to manually creating new content, modifying and cleaning existing content, merging data from different sources, establishing connections between datasets, categorizing data, and eventually sharing the end results with other users; tasks that are currently considered quite tedious because of the sheer complexity of the concepts, data models and syntax, and the interplay between all of them.
Our approach is based on the conviction that there is a strong potential for cross-fertilization, as mentioned earlier: on the one hand, user interface design is essential to the management and understanding of webs of data; on the other hand, interlinked datasets enriched with even a small amount of semantics can help create more powerful user interfaces, that provide users with the right information at the right time.
We envision systems that focus on the data themselves, exploiting the underlying semantics and structure in the background rather than exposing them – which is what current user interfaces for the Web of Data often do. We envision interactive systems in which the semantics and structure are not exposed directly to users, but serve as input to the system to generate interactive representations that convey information relevant to the task at hand and best afford the possible manipulation actions.
4 Application domains
4.1 Mission-critical systems
Mission-critical contexts of use include emergency response & management, and critical infrastructure operations, such as public transportation systems, communications and power distribution networks, or the operations of large scientific instruments such as particle accelerators and astronomical observatories. Central to these contexts of work is the notion of situation awareness 40, i.e., how workers perceive and understand elements of the environment with respect to time and space, such as maps and geolocated data feeds from the field, and how they form mental models that help them predict future states of those elements. One of the main challenges is how to best assist subject-matter experts in constructing correct mental models and making informed decisions, often under time pressure. This can be achieved by providing them with, or helping them efficiently identify and correlate, relevant and timely information extracted from large amounts of raw data, taking into account the often cooperative nature of their work and the need for task coordination. With this application area, our goal is to investigate novel ways of interacting with computing systems that improve collaborative data analysis capabilities and decision support assistance in a mission-critical, often time-constrained, work context.
4.2 Exploratory analysis of scientific data
Many scientific disciplines are increasingly data-driven, including astronomy, molecular biology, particle physics, or neuroanatomy. While making the right decision under time pressure is often less of critical issue when analyzing scientific data, at least not on the same temporal scale as truly time-critical systems, scientists are still faced with large-to-huge amounts of data. No matter their origin (experiments, remote observations, large-scale simulations), these data are difficult to understand and analyze in depth because of their sheer size and complexity. Challenges include how to help scientists freely-yet-efficiently explore their data, keep a trace of the multiple data processing paths they considered to verify their hypotheses and make it easy to backtrack, and how to relate observations made on different parts of the data and insights gained at different moments during the exploration process. With this application area, our goal is to investigate how data-centric interactive systems can improve collaborative scientific data exploration, where users' goals are more open-ended, and where roles, collaboration and coordination patterns 42 differ from those observed in mission-critical contexts of work.
Relevant publications by team members last year: 19.
5 New software and platforms
5.1 New software
5.1.1 S-Paths
- Name: S-Paths: Set-based visual exploration of linked data
- Keywords: LOD - Linked open data, Data visualization
- Functional Description: Meaningful information about an RDF resource can be obtained not only by looking at its properties, but by putting it in the broader context of similar resources. Classic navigation paradigms on the Web of Data that employ a follow-your-nose strategy fail to provide such context, and put strong emphasis on first-level properties, forcing users to drill down in the graph one step at a time. S-Paths is based on the concept of semantic paths: starting from a set of resources, it follows and analyses chains of triples and characterize the sets of values at their end. This novel navigation strategy is based on aggregation, relying on path characteristics to determine the most readable representation.
-
URL:
https://
gitlab. inria. fr/ mdestand/ s-paths - Publication: hal-02416185
- Authors: Marie Destandau, Emmanuel Pietriga, Caroline Appert
- Contacts: Marie Destandau, Emmanuel Pietriga
6 New results
6.1 Geospatial Data Visualization
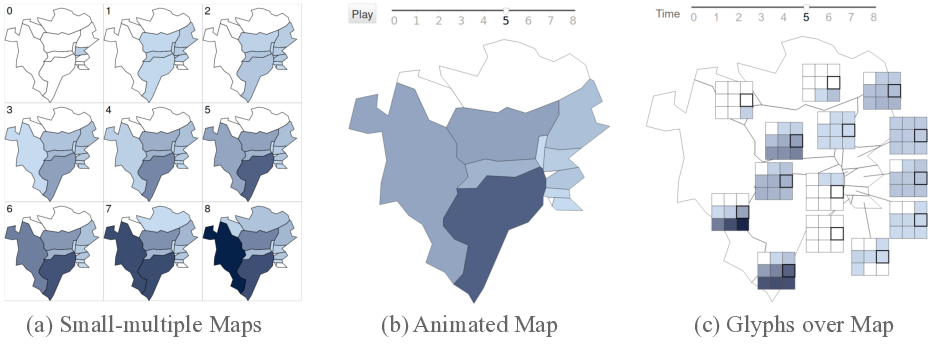
Following up on our comparison of visualization techniques to help analysts identify correlation between variables over space and time 7, we ran a study to compare different techniques for visualizing geographical propagation phenomena 22. Such phenomena occur in multiple domains, such as in epidemiology and social media. Propagation dynamics are often complex, and visualizations play a key role in helping subject-matter experts understand and analyze them. However, there is little empirical data about the effectiveness of the various strategies used to visualize geographical propagation. To fill this gap, we conducted an experiment to evaluate the effectiveness of three strategies: an animated map, small-multiple maps, and a single map with glyphs. See Figure 1. We compared them under five tasks that vary in one of the following dimensions: propagation scope, direction, speed, peaks, and spatial jumps. Our results show that small-multiple maps perform best overall, but that the effectiveness of each visualization varies depending on the task considered.
6.2 Interacting with Novel Forms of Displays
Augmented Reality as well as ultra-high-resolution wall-sized displays are two display technologies that have much potential in the contexts of use we target at ILDA (see both Sections 3 and 4).
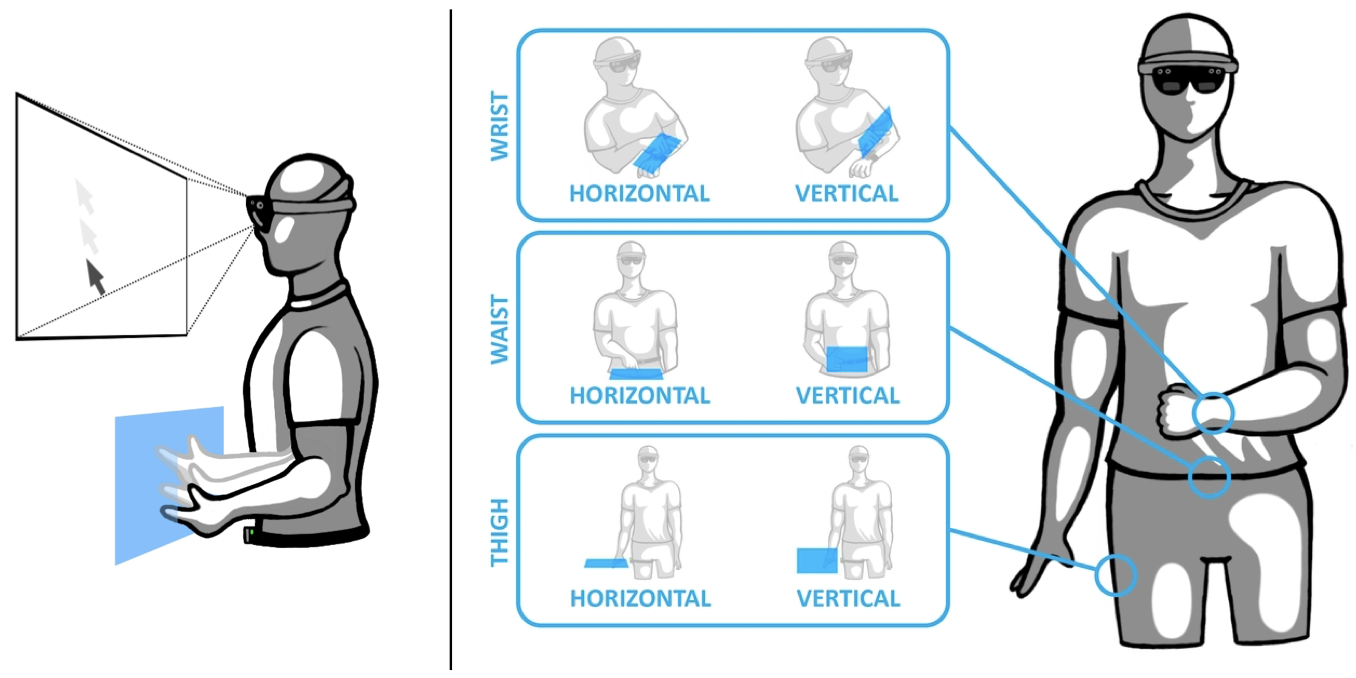
Interacting efficiently and comfortably with Augmented Reality (AR) headsets remains a major issue. We investigated the concept of mid-air pads, which we call ARPads 1, as an alternative to gaze or direct hand input to control a cursor in windows anchored in the environment. ARPads allow users to control the cursor displayed in the headset screen through movements on a mid-air plane, which is not spatially aligned with the headset screen (see Figure 2). We investigated a design space for ARPads, which takes into account the position of the pad relative to the user's body, and the orientation of the pad relative to that of the headset screen. Results from this study suggest that 1) indirect input can achieve the same performance as direct input while causing less fatigue than hand raycast, 2) an ARPad should be attached to the wrist or waist rather than to the thigh, and 3) the ARPad and the screen should have the same orientation.
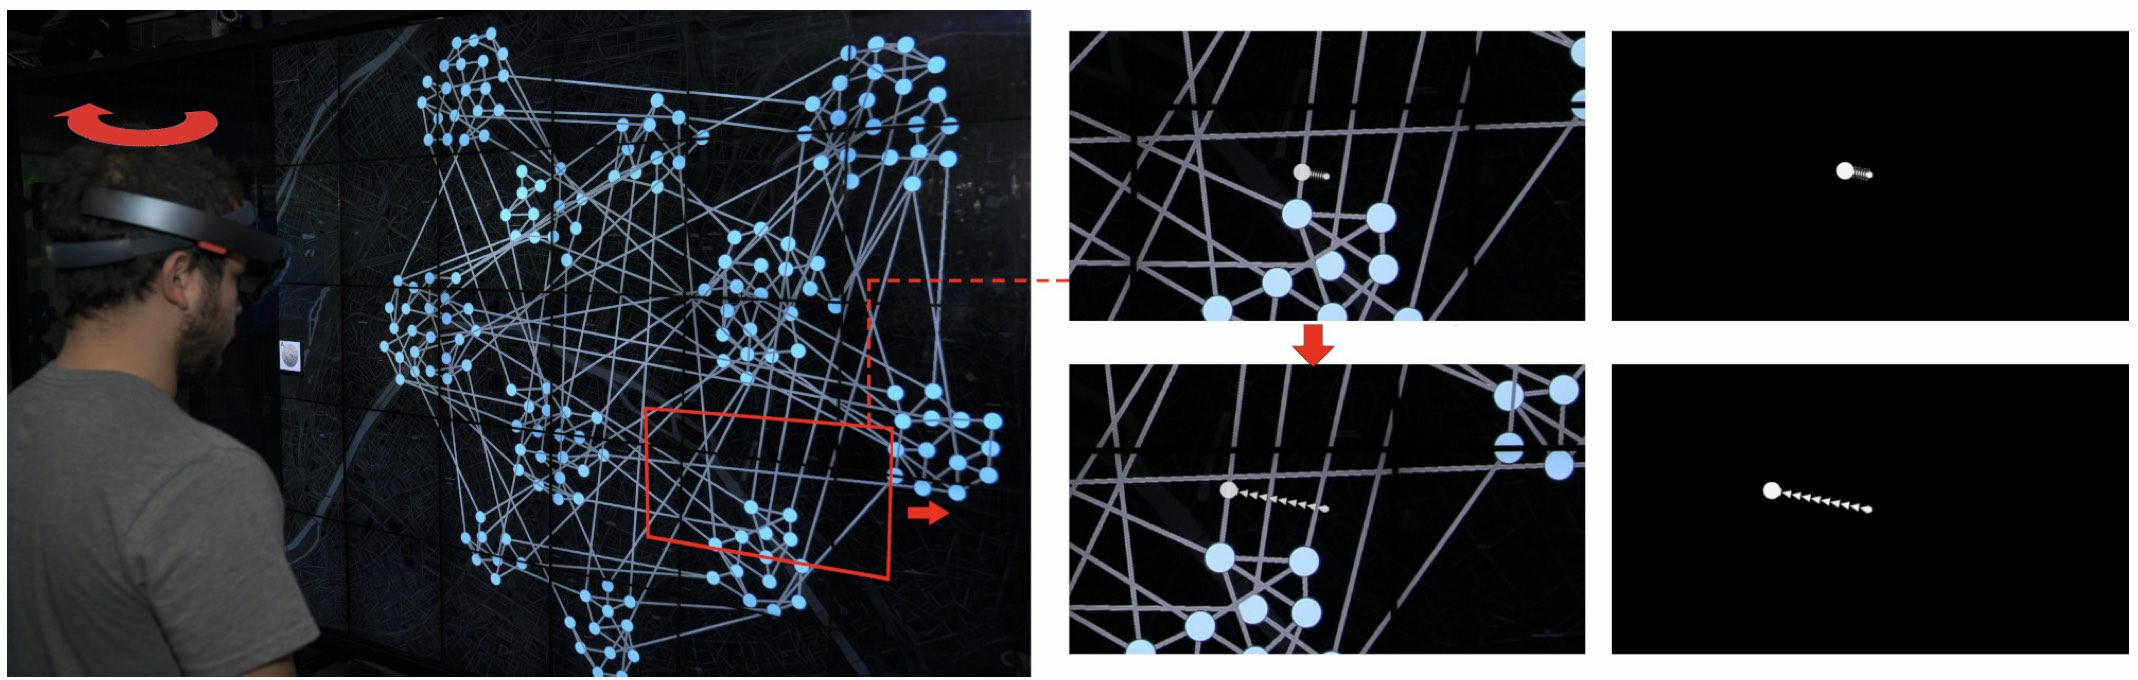
Combining a large, shared display with Augmented Reality (AR) headsets allows interaction without altering the context on the large display, which is typically shared by multiple users (they are well suited to public viewing and collaboration). We studied 21 a set of such interaction techniques in the context of network navigation, in particular path following, an important network analysis task (Figure 3). The proposed techniques allow for hands-free interaction, rendering visual aids inside the headset, in order to help the viewer maintain a connection between the AR cursor and the network that is only shown on the shared display. In two experiments on path following, we found that adding persistent connections between the AR cursor and the network on the shared display works well for high precision tasks, but more transient connections work best for lower precision tasks. More broadly, we showed that combining personal AR interaction with shared displays is feasible for network navigation.
On the opposite side of the spectrum, smartwatches enable a new type of mobile interaction, based on a very small wristworn display. Together with colleagues from Télécom ParisTech, we investigated gesture-based interaction for menu selection on such devices. Supporting many gestures on small surfaces allows users to interact remotely with complex environments such as smart homes, large remote displays, or virtual reality environments, and switching between them (e.g., AR setup in a smart home). Providing eyes-free gestures in these contexts is important as this avoids disrupting the user's visual attention. However, very few techniques enable large sets of commands on small wearable devices supporting the user's mobility and even less provide eyes-free interaction. We designed Side-Crossing Menus 14, a gestural technique enabling large sets of gestures on a smartwatch, which relies on broad and shallow menus that favor small and rapid gestures.
Again related to interacting with very small displays, we worked with Inria Saclay Aviz team members on a survey with 237 smartwatch wearers to better understand the current use of data visualizations on smartwatches, and to identify missed visualization opportunities 26. We found a predominant display of health & fitness data, with icons accompanied by text being the most frequent representation type. Combining these results with a further analysis of online searches of watch faces and the data tracked on smartwatches that are not commonly visualized, we identified opportunities for further visualization research.
6.3 Expressive Visualization Authoring
In collaboration with other research laboratories, we continued to investigate novel ways to author expressive visualizations, an area we started to investigate with the Graphies project 63. While Graphies was about the expressive authoring of node-link diagrams, Dear Pictograph 23 investigates how to make visualization experiences more enjoyable and engaging: by considering aspects of personalization and immersion. Much of the visualization literature focuses on assessment of visual representations with regard to their effectiveness for understanding data. This work instead focused on making data visualization experiences more enjoyable, to foster deeper engagement with data. Results indicate that personalization and immersion both have positive impact on making visualizations more enjoyable experiences. This work was conducted in collaboration with Microsoft Research.
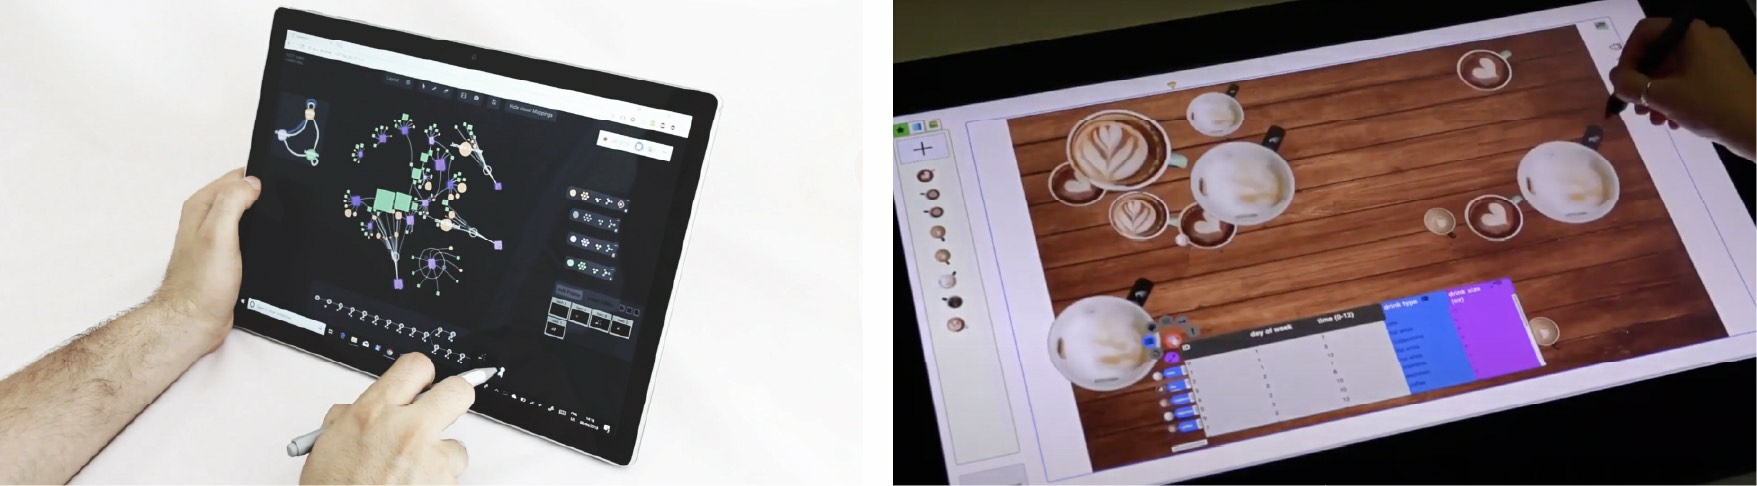
In the same area of research, we worked with colleagues from the University of Toronto on a system to craft pictorial visualizations 24. DataQuilt is a novel system that enables visualization authors to iteratively design pictorial visualizations as collages. Real images (e.g., paintings, photographs, sketches) act as both inspiration and as a resource of visual elements that can be mapped to data. The creative pipeline involves the semi-guided extraction of relevant elements of an image (arbitrary regions, regular shapes, color palettes, textures) aided by computer vision techniques; the binding of these graphical elements and their features to data in order to create meaningful visualizations; and the iterative refinement of both features and visualizations through direct manipulation.
6.4 Interactive Exploration of Complex Data
We continued our work on the exploratory visualization of Linked Data 43, which uses RDF as the fundamental data model. Meaningful information about an RDF resource can be obtained not only by looking at its properties, but by putting it in the broader context of similar resources. Classic navigation paradigms on the Web of Linked Data that employ a follow-your-nose strategy fail to provide such context, and put strong emphasis on first-level properties, forcing users to drill down in the graph one step at a time. We introduced the concept of semantic paths 12: starting from a set of resources, we follow and analyse chains of triples and characterize the sets of values at their end. We investigated a navigation strategy based on aggregation, relying on path characteristics to determine the most readable representation. We implemented this approach in S-Paths (Figure 5), a browsing tool for linked datasets that systematically identifies the best rated view on a given resource set, leaving users free to switch to another resource set, or to get a different perspective on the same set by selecting other semantic paths to visualize. See also Section 5.

Together with CEDAR team members at Inria Saclay, we started investigating the related topic of exploring heterogeneous datasets 17. An interesting class of such datasets, encountered for instance in data journalism applications, results from the interconnection of data sources of different data models, ranging from very structured (e.g., relational or graphs) to semistructured (e.g., JSON, HTML, XML) to completely unstructured (text). Such heterogeneous graphs can be exploited, e.g., by keyword search, to uncover connection between search keywords]. We presented preliminary work on a vision toward making such graphs easily comprehensible by human users, such as journalists seeking to understand and explore them. Our proposal is twofold: (i) abstracting the graph by recognizing structured entities; this simplifies the graph without information loss; (ii) relying on data visualization techniques to help users grasp the graph contents.
Our earlier work on similarity perception in time-series visualization 3 in collaboration with Université Paris-Descartes also led to advances in data series query techniques. Existing systems dealing with the increasing volume of data series cannot guarantee interactive response times, even for fundamental tasks such as similarity search. Therefore, it was necessary to develop analytic approaches that support exploration and decision making by providing progressive results, before the final and exact ones have been computed. We developed and experimentally evaluated a new probabilistic learning-based method 19 that provides quality guarantees for progressive Nearest Neighbor (NN) query answering. This technique provides both initial and progressive estimates of the final answer that are getting better during the similarity search, as well suitable stopping criteria for the progressive queries. Experiments with synthetic and diverse real datasets demonstrated that our prediction methods constitute the first practical solution to the problem, significantly outperforming competing approaches.
Finally, following up on the IEEE Vis Workshop on the evaluation of interactive visual machine learning systems that we co-organized with INRAE collaborators, we participated to a paper 11 outlining challenges and research gaps in mixe initiative systems. In interactive visual machine learning (IVML), humans and machine learning algorithms collaborate to achieve tasks mediated by interactive visual interfaces. This human-in-the-loop approach to machine learning brings forth not only numerous intelligibility, trust and usability issues, but also many open questions with respect to the evaluation of the IVML system, both as separate components, and as a holistic entity that includes both human and machine intelligence.
7 Partnerships and cooperations
7.1 International initiatives
7.1.1 Collaborations with major European organizations
Deutsches Elektronen-Synchrotron (DESY): Scientific collaboration on the design and implementation of user interfaces for array operations monitoring and control for the Cherenkov Telescope Array (CTA) project, to be built in the Canary Islands (Spain) and in the Atacama desert (Chile), 5 years, contract started May 2018. Participants: Emmanuel Pietriga (PI), Dylan Lebout. https://
7.2 National initiatives
7.2.1 INRIA Project Lab (IPL)
ILDA participates to Inria Project Lab iCODA : Data Journalism : knowledge-mediated Content and Data Interactive Analytics, that started in 2017. A key issue in data science is the design of algorithms that enable analysts to infer information and knowledge by exploring heterogeneous information sources, structured data, or unstructured content. With journalism data as a landmark use-case, iCODA aims to develop the scientific and technological foundation for collaborative, heterogeneous data analysis, guided by formalized, user-centric knowledge. The project relies on realistic scenarios in data-journalism to assess the contribution of the project to this area. iCODA is at the crossroads of several research areas (content analysis, data management, knowledge representation, visualization) and is part of a club of partners of the world of the press. Equipes-projets Inria : Graphik, Ilda, Linkmedia, Cedar. Press partners: Le Monde, OuestFrance, AFP. Participants: Anastasia Bezerianos (PI), Vanessa Peña-Araya, Emmanuel Pietriga, Tong Xue. https://
8 Dissemination
8.1 Promoting scientific activities
8.1.1 Scientific events: organisation
Member of the organizing committees
- ACM CHI Steering Committee, ACM SIGCHI Conference on Human Factors in Computing Systems: Caroline Appert
8.1.2 Scientific events: selection
Chair of conference program committees
- CHI 2022, 40th ACM SIGCHI Conference on Human Factors in Computing Systems: Caroline Appert (TPC - Technical Program Chair)
- CHI 2021, 39th ACM SIGCHI Conference on Human Factors in Computing Systems: Caroline Appert (SC - subcommittee chair)
Member of the conference program committees
- CHI 2021, 39th ACM SIGCHI Conference on Human Factors in Computing Systems: Emmanuel Pietriga (AC - associate chair)
- MobileHCI, ACM International Conference on Mobile Human-Computer Interaction: Olivier Chapuis (AC - associate chair)
- ISS 2020, ACM Conference on Interactive Surfaces and Spaces: Caroline Appert (AC - associate chair)
Reviewer
- ACM UIST 2020, Interface Software and Technologies Symposium: Anastasia Bezerianos, Olivier Chapuis, Emmanuel Pietriga
- ACM CHI 2021, Conference on Human Factors in Computing Systems: Anastasia Bezerianos, Olivier Chapuis, Vanessa Peña-Araya
- ACM ISS 2020, Conference on Interactive Surfaces and Spaces: Olivir Chapuis
- ACM EICS 2020, SIGCHI Symposium on Engineering Interactive Computing Systems: Emmanuel Pietriga
- IEEE VIS 2020, Visualization Conference (InfoVis): Anastasia Bezerianos, Vanessa Peña-Araya
- IEEE VR 2020, Conference on Virtual Reality and 3D User Interfaces: Olivier Chapuis
- IEEE/ACM ISMAR 2020, International Symposium on Mixed and Augmented Reality: Olivier Chapuis
- IHM 2020, Conférence francophone d'interaction homme machine: Eugénie Brasier, Olivier Chapuis
8.1.3 Journal
Member of the editorial boards
- ACM ToCHI, Transactions on Computer-Human Interaction: Caroline Appert (associate editor)
Reviewer - reviewing activities
- ACM ToCHI, Transactions on Computer-Human Interaction: Olivier Chapuis
- IEEE TVCG, Transactions on Visualization and Computer graphics: Anastasia Bezerianos, Vanessa Peña-Araya
- IJHCS, International Journal of Human-Computer Studies: Vanessa Peña-Araya
8.1.4 Leadership within the scientific community
- Conseil Scientifique d'Institut (CNRS/INS2I): Caroline Appert
- SigCHI Paris Local Chapter, vice-chair: Caroline Appert
8.1.5 Scientific expertise
- Evaluator for the European Research Council ERC Advanced Grant 2021 Call, PE6 Computer Science and Informatics: Emmanuel Pietriga
8.1.6 Research administration
- Member of Conseil de l'École Doctorale STIC Paris Saclay (Pôle B): Caroline Appert
- Member of Conseil de Laboratoire (LRI): Caroline Appert
- Member of Commissions Consultatives de Spécialités d’Université (CCSU) at Université Paris Saclay: Anastasia Bezerianos
8.2 Teaching
- Ingénieur: Emmanuel Pietriga, Data Visualization (INF552), 36h, 3A/M1, École Polytechnique
- Ingénieur: Caroline Appert, Data Visualization (INF552), 18h, 3A/M1, École Polytechnique
- Ingénieur: Vanessa Peña-Araya, Data Visualization (INF552), 18h, 3A/M1, École Polytechnique
- Master: Emmanuel Pietriga, Data Visualization, 24h, M2 Informatique Décisionnelle, Univ. Paris Dauphine
- Master: Caroline Appert, Experimental Design and Analysis, 21h, M2 Interaction, Univ. Paris Saclay
- Master: Anastasia Bezerianos, Evaluation of Interactive Systems (Intro), 16h, M2 Interaction, Univ. Paris Saclay
- Master: Anastasia Bezerianos, Programming of Interactive Systems, 21h, M2 Interaction, Univ. Paris Saclay
- Master: Anastasia Bezerianos, Career Seminar, 21h, M2 Interaction, Univ. Paris Saclay
- Master: Anastasia Bezerianos, Augmented Reality and Tangible Interaction, 12h, M2 Interaction, Univ. Paris Saclay
- Master: Anastasia Bezerianos, Interactive Information Visualization, 10.5h, M2 Interaction, Univ. Paris Saclay
- Master: Anastasia Bezerianos, HCI Project, 21h, M2 Interaction and HCID, Univ. Paris Saclay
- Master: Anastasia Bezerianos, Intro aux Systèmes Interactives, 15h, M1 Informatique, Univ. Paris Saclay
- Ingénieur: Eugénie Brasier, Concepts Objet et Java, 24h00, 3A (Et3), Polytech
- Ingénieur: Eugénie Brasier, Interaction Homme-Machine, 12h00, 3A (Et3), Polytech
- Master: Raphaël James, Programming of Interactive Systems, 10.5h, Univ. Paris Saclay
- Master: Raphaël James, Fundamentals of HCI, 22h, Univ. Paris Saclay
- Master: Eugénie Brasier, Career Seminar, 11h00, M2 Interaction and HCID, Univ. Paris Saclay
- Master: Mehdi Chakhchoukh, Programming of Interactive Systems, 10.5h, Univ. Paris Saclay
- Master: Vanessa Peña-Araya, Introduction to Data Mining, 3h, Faculty of Medicine, Universidad de Chile
- Licence: Mehdi Chakhchoukh, Introduction à l'Interaction Humain-Machine, 12h, Univ. Paris Saclay
- License: Emmanuel Courtoux, Génie Logiciel Avancé, 18h, L3 Informatique, Univ. Paris-Saclay
- License: Emmanuel Courtoux, Introduction à la programmation fonctionnelle, 14h, L2 MPI, Univ. Paris-Saclay
8.2.1 Supervision
- HDR (defended) : Anastasia Bezerianos, Increasing the bandwidth of Interactive Visualizations, using complex display environments and targeted designs, July 2020
- PhD in progress : Eugénie Brasier, Interaction techniques for remote manipulation in multi-display environments, since October 2018, Advisors: Caroline Appert
- PhD in progress : Raphaël James, Environnements de réalité physique et augmentée utilisés dans l'analyse visuelle collaborative, since October 2018, Advisors: Anastasia Bezerianos, Olivier Chapuis, Tim Dwyer
- PhD in progress : Emmanuel Courtoux, Tangible Collaborative Interaction for Wall-sized Displays, since October 2019, Advisors: Olivier Chapuis, Caroline Appert
- PhD in progress : Mehdi Chakhchoukh, CHORALE: Collaborative Human-Model Interaction to Support Multi-Criteria Decision Making in Agronomy, since October 2020, Advisors: Anastasia Bezerianos, Nadia Boukhelifa
- PhD (defended) : Marie Destandau, Interactive Visual Exploration of Webs of Data, October 2017 - December 2020, Advisors: Emmanuel Pietriga, Jean-Daniel Fekete
- Master 2 Internship: Mehdi Chakhchoukh, Visualizing Provenance to Support Trade-off Analysis, 6 months, Advisors: Anastasia Bezerianos, Nadia Boukhelifa
- IUT Internship: Maya Gawinowski, Extending Copy-and-Paste Interactions on Mobile Devices with Offscreen Multi-clipboards, 3 months, Advisors: Caroline Appert, Emmanuel Pietriga
8.2.2 Juries
- PhD: Nicole Ke Chen Pong, Université de Lille: Caroline Appert (examinateur)
- PhD: Shu-Yuan Hsueh, Université Paris Saclay: Caroline Appert (president)
- HDR: Célia Martinie, Université Paul Sabatier - Toulouse: Caroline Appert (reviewer)
8.3 Popularization
8.3.1 Articles and contents
- April 2020: A Comparison of Geographical Propagation Visualizations, Medium - Visualization Research Explained https://
medium. com/ multiple-views-visualization-research-explained/ a-comparison-of-geographical-propagation-visualizations-2f280634b99e
8.3.2 Interventions
- Eugénie Brasier, March 2020: Ma thèse en 180 secondes, finale régionale, Université Paris-Saclay, Eugénie won the 2nd prize https://
www. youtube. com/ watch?v=Eagv581HYpQ&feature=youtu. be&t=2648 - Emmanuel Pietriga, October 2020: Fête de la Science, ANDRA (Agence Nationale pour la Gestion des Déchets Radioactifs) - Sanctuary : la mémoire de l'humanité sur la Lune https://
www. youtube. com/ watch?v=5XLbtNSetUo
9 Scientific production
9.1 Major publications
- 1 inproceedingsARPads: Mid-air Indirect Input for Augmented RealityISMAR 2020 - IEEE International Symposium on Mixed and Augmented RealityISMAR '20Porto de Galinhas, BrazilIEEENovember 2020, 13 pages
- 2 articleS-Paths: Set-based visual exploration of linked data driven by semantic pathsOpen Journal Of Semantic WebSeptember 2020, 1-18
- 3 articleComparing Similarity Perception in Time Series VisualizationsIEEE Transactions on Visualization and Computer GraphicsOctober 2018, 11
- 4 inproceedings CoReach: Cooperative Gestures for Data Manipulation on Wall-sized Displays Proceedings of the 35th international conference on Human factors in computing systems CHI '17 Denver, United States ACM May 2017
- 5 article Animation Plans for Before-and-After Satellite Images IEEE Transactions on Visualization and Computer Graphics 24 January 2018
- 6 inproceedings TouchTokens: Guiding Touch Patterns with Passive Tokens 2016 CHI Conference on Human Factors in Computing Systems San Jose, CA, United States May 2016
- 7 article A Comparison of Visualizations for Identifying Correlation over Space and Time IEEE Transactions on Visualization and Computer Graphics October 2019
- 8 articleEvaluating Multi-User Selection for Exploring Graph Topology on Wall-DisplaysIEEE Transactions on Visualization and Computer Graphics238August 2017, 1936--1951
- 9 inproceedings SpaceInk: Making Space for In-Context Annotations UIST 2019 - 32nd ACM User Interface Software and Technology Nouvelle-Orleans, United States October 2019
- 10 inproceedingsDesigning Coherent Gesture Sets for Multi-scale Navigation on TabletopsProceedings of the 36th international conference on Human factors in computing systemsCHI '18Montreal, CanadaACMApril 2018, 142:1-142:12
9.2 Publications of the year
International journals
International peer-reviewed conferences
Conferences without proceedings
Doctoral dissertations and habilitation theses
Reports & preprints
Other scientific publications
9.3 Cited publications
- 27 book Data on the Web: From Relations to Semistructured Data and XML Morgan Kaufmann 1999
- 28 inproceedingsThe ERC Webdam on Foundations of Web Data ManagementProc. of the 21st International Conference Companion on World Wide WebWWW '12 CompanionACM2012, 211--214URL: http://doi.acm.org/10.1145/2187980.2188011
- 29 inproceedingsRouteLens: Easy Route Following for Map ApplicationsProceedings of the International Working Conference on Advanced Visual InterfacesAVI '14ACM2014, 125--128
- 30 inproceedingsHigh-precision magnification lensesProceedings of the 28th international conference on Human factors in computing systemsCHI '10Atlanta, Georgia, USAACM2010, 273--282
- 31 inproceedingsOrthoZoom Scroller: 1D Multi-scale NavigationProceedings of the SIGCHI Conference on Human Factors in Computing SystemsCHI '06New York, NY, USAMontréal, Québec, CanadaACM2006, 21--30URL: http://doi.acm.org/10.1145/1124772.1124776
- 32 articleMultisurface Interaction in the WILD RoomIEEE Computer4542012, 48-56
- 33 inproceedingsThe coordinative functions of flight strips: air traffic control work revisitedProceedings of the international ACM SIGGROUP conference on Supporting group workGROUP '99Phoenix, Arizona, United StatesACM1999, 101--110URL: http://doi.acm.org/10.1145/320297.320308
- 34 book Semiology of Graphics University of Wisconsin Press 1983
- 35 articleView and Space Management on Large DisplaysIEEE Computer Graphics and Applications2542005, 34-43
- 36 inproceedingsUsing alternative views for layout, comparison and context switching tasks in wall displaysOZCHI2007, 303-310
- 37 inproceedingsExtending the Vocabulary of Touch Events with ThumbRockProceedings of Graphics InterfaceGI '13Regina, Saskatchewan, CanadaCIPS2013, 221-228
- 38 inproceedingsSmarties: An Input System for Wall Display DevelopmentCHI '14Toronto, CanadaACMApril 2014, 2763-2772
- 39 inproceedingsUnderstanding File Access Mechanisms for Embedded Ubicomp Collaboration InterfacesProceedings of the 11th International Conference on Ubiquitous ComputingUbiComp '09New York, NY, USAOrlando, Florida, USAACM2009, 135--144URL: http://doi.acm.org/10.1145/1620545.1620567
- 40 book M. Endsley D. Jones Designing for Situation Awareness: an Approach to User-Centered Design 370 pages CRC Press, Taylor & Francis 2012
- 41 inproceedingsMulti-user, Multi-display Interaction with a Single-user, Single-display Geospatial ApplicationProceedings of the 19th Annual ACM Symposium on User Interface Software and TechnologyUIST '06Montreux, SwitzerlandACM2006, 273--276URL: http://doi.acm.org/10.1145/1166253.1166296
- 42 articleComputer-Supported Cooperative Work: History and FocusIEEE Computer275May 1994, 19--26URL: http://dx.doi.org/10.1109/2.291294
- 43 book Linked Data: Evolving the Web into a Global Data Space Morgan & Claypool 2011
- 44 inproceedingsTangible Bits: Towards Seamless Interfaces Between People, Bits and AtomsProceedings of the ACM SIGCHI Conference on Human Factors in Computing SystemsCHI '97Atlanta, Georgia, USAACM1997, 234--241URL: http://doi.acm.org/10.1145/258549.258715
- 45 book Human-Computer Interaction Handbook: Fundamentals, Evolving Technologies, and Emerging Applications, 3rd Edition CRC Press 2012
- 46 inproceedingsEffects of Display Size and Navigation Type on a Classification TaskProceedings of the 32nd international conference on Human factors in computing systemsCHI '14Toronto, CAACM2014, 4147-4156
- 47 inproceedingsShared Interaction on a Wall-Sized Display in a Data Manipulation TaskProceedings of the 34th international conference on Human factors in computing systemsCHI '16SigCHI and ACMSan Jose, United StatesMay 2016, 1-12
- 48 articleIs paper safer? The role of paper flight strips in air traffic controlACM Trans. Comput.-Hum. Interact.64December 1999, 311--340URL: http://doi.acm.org/10.1145/331490.331491
- 49 inproceedings TouchTokens: Guiding Touch Patterns with Passive Tokens Proceedings of the SIGCHI Conference on Human Factors in Computing Systems CHI '16 To appear New York, NY, USA ACM 2016
- 50 book Visualization Analysis and Design CRC Press 2014
- 51 inproceedingsHigh-precision pointing on large wall displays using small handheld devicesProceedings of the SIGCHI Conference on Human Factors in Computing SystemsCHI '13Paris, FranceACM2013, 831--840URL: http://doi.acm.org/10.1145/2470654.2470773
- 52 articleMid-air Pointing on Ultra-WallsACM Transactions on Computer-Human Interaction225August 2015, 21:1--21:62
- 53 inproceedingsMulti-Touch Gestures for Discrete and Continuous ControlInternational Working Conference on Advanced Visual Interfaces (AVI)Como, ItalyMay 2014, 8
- 54 inproceedingsProspective Motor Control on Tabletops: Planning Grasp for Multitouch InteractionProceedings of the 32nd international conference on Human factors in computing systemsCHI '14Toronto, CAACM2014, 2893-2902
- 55 inproceedingsA Toolkit for Addressing HCI Issues in Visual Language EnvironmentsIEEE Symposium on Visual Languages and Human-Centric Computing (VL/HCC)IEEE Computer Society2005, 145-152
- 56 inproceedingsPointing and beyond: an operationalization and preliminary evaluation of multi-scale searchingCHI '07: Proceedings of the SIGCHI conference on Human factors in computing systemsSan Jose, California, USAACM Press2007, 1215--1224
- 57 inproceedingsSigma lenses: focus-context transitions combining space, time and translucenceCHI '08: Proceeding of the twenty-sixth annual CHI conference on Human factors in computing systemsFlorence, ItalyACM2008, 1343--1352
- 58 articleRepresentation-Independent In-Place Magnification with Sigma LensesIEEE Transactions on Visualization and Computer Graphics (TVCG)16032010, 455-467
- 59 inproceedingsBrowsing Linked Data Catalogs with LODAtlasISWC 2018 - 17th International Semantic Web ConferenceMonterey, United StatesSpringerOctober 2018, 137-153
- 60 inproceedingsRapid development of user interfaces on cluster-driven wall displays with jBricksProceedings of the 3rd ACM SIGCHI symposium on Engineering interactive computing systemsEICS '11Pisa, ItalyACM2011, 185--190URL: http://doi.acm.org/10.1145/1996461.1996518
- 61 inproceedingsDrilling into complex 3D models with gimlensesProceedings of the 19th ACM Symposium on Virtual Reality Software and TechnologyVRST '13SingaporeACM2013, 223--230URL: http://doi.acm.org/10.1145/2503713.2503714
- 62 inproceedingsJellyLens: Content-Aware Adaptive LensesUIST - 25th Symposium on User Interface Software and Technology - 2012Proceedings of the 25th Symposium on User Interface Software and TechnologyACMCambridge, MA, United StatesACMOctober 2012, 261-270
- 63 articleExpressive Authoring of Node-Link Diagrams with GraphiesIEEE Transactions on Visualization and Computer GraphicsNovember 2019, 1
- 64 articleThe Semantic Web RevisitedIEEE Intelligent Systems2132006, 96-101URL: http://doi.ieeecomputersociety.org/10.1109/MIS.2006.62
- 65 articleTangible User Interfaces: Past, Present, and Future DirectionsFound. Trends Hum.-Comput. Interact.31–2January 2010, 1--137URL: http://dx.doi.org/10.1561/1100000026
- 66 book Designing the User Interface, 4th Edition Pearson Addison Wesley 2005
- 67 inproceedingsControlling widgets with one power-up buttonProceedings of the 26th annual ACM symposium on User interface software and technologyUIST '13St. Andrews, Scotland, United KingdomACM2013, 71--74URL: http://doi.acm.org/10.1145/2501988.2502025
- 68 inproceedingsSide pressure for bidirectional navigation on small devicesProceedings of the 15th international conference on Human-computer interaction with mobile devices and servicesMobileHCI '13Munich, GermanyACM2013, 11--20URL: http://doi.acm.org/10.1145/2493190.2493199
- 69 articleScaleMaster 2.0: a ScaleMaster extension to monitor automatic multi-scales generalizationsCartography and Geographic Information Science4032013, 192--200URL: http://dx.doi.org/10.1080/15230406.2013.809233
- 70 inproceedingsSocial Welfare to Assess the Global Legibility of a Generalized MapInternational Conference on Geographic InformationSpringer2012, 198--211URL: http://dx.doi.org/10.1007/978-3-642-33024-7_15
- 71 inproceedingsCoordination of Tilt and Touch in One- and Two-Handed UseProceedings of the 32nd international conference on Human factors in computing systemsCHI '14Toronto, CAACM2014, 2001-2004
- 72 inproceedingsSketchSliders: Sketching Widgets for Visual Exploration on Wall DisplaysProceedings of the 33rd Annual ACM Conference on Human Factors in Computing SystemsACMSeoul, South KoreaApril 2015, 3255-3264
- 73 book Information visualization: perception for design Elsevier 2012
- 74 articleFoundational Issues in Touch-Screen Stroke Gesture Design - An Integrative ReviewFoundations and Trends in Human-Computer Interaction52December 2012, 97-205
- 75 inproceedingsLooking behind bezels: french windows for wall displaysProceedings of the International Working Conference on Advanced Visual InterfacesAVI '12Capri Island, ItalyACM2012, 124--131URL: http://doi.acm.org/10.1145/2254556.2254581