
Keywords
Computer Science and Digital Science
- A3.1.7. Open data
- A3.1.10. Heterogeneous data
- A3.1.11. Structured data
- A3.2.4. Semantic Web
- A3.2.5. Ontologies
- A3.2.6. Linked data
- A5.1. Human-Computer Interaction
- A5.1.1. Engineering of interactive systems
- A5.1.2. Evaluation of interactive systems
- A5.1.5. Body-based interfaces
- A5.1.6. Tangible interfaces
- A5.1.9. User and perceptual studies
- A5.2. Data visualization
- A5.5.4. Animation
- A5.6.1. Virtual reality
- A5.6.2. Augmented reality
Other Research Topics and Application Domains
- B9.5.3. Physics
- B9.5.6. Data science
- B9.6.7. Geography
- B9.7.2. Open data
- B9.11. Risk management
1 Team members, visitors, external collaborators
Research Scientists
- Emmanuel Pietriga [Team leader, Inria, Senior Researcher, HDR]
- Caroline Appert [CNRS, Senior Researcher, HDR]
- Olivier Chapuis [CNRS, Researcher]
- Vanessa Pena Araya [Inria, from Oct 2021, Starting Faculty Position]
Faculty Member
- Anastasia Bezerianos [Univ Paris-Saclay, Associate Professor, HDR]
Post-Doctoral Fellow
- Vanessa Pena Araya [Inria, until Apr 2021]
PhD Students
- Eugenie Brasier [Univ Paris-Saclay]
- Vincent Cavez [Inria, from Oct 2021]
- Mehdi Chakhchoukh [Univ Paris-Saclay]
- Emmanuel Courtoux [Univ Paris-Saclay]
- Raphael James [Univ Paris-Saclay]
Technical Staff
- Rim Hajri [Inria, Engineer, from Sep 2021]
- Dylan Lebout [Inria, Engineer]
- Vanessa Pena Araya [Inria, Engineer, from May 2021 until Sep 2021]
Interns and Apprentices
- Francesco Di Gioia [Inria, from Mar 2021 until Aug 2021]
- Juliette Fournis D Albiat [Inria, from Mar 2021 until Aug 2021]
- Golina Hulstein [Inria, from Mar 2021 until Sep 2021]
- Theo Imbert [Inria, from Apr 2021 until Jul 2021]
Administrative Assistants
- Katia Evrat [Inria, Jan 2021]
- Katia Evrat [Inria, from Feb 2021]
2 Overall objectives
In an increasing number of domains, computer users are faced with large datasets, that are often interlinked and organized according to elaborate structures thanks to new data models such as those that are arising with the development of, e.g., the Web of Data. Rather than seeing the inherent complexity of those data models as a hindrance, we aim at leveraging it to design new interactive systems that can better assist users in their data understanding and processing tasks.
These “Data-centric Interactive Systems” aim at providing users with the right information at the right time, presenting it in the most meaningful manner, and letting users efficiently manipulate, edit and share these data with others. This entails minimizing the effort required to retrieve and relate data from relevant sources; displaying data using visual presentation techniques that match the data's characteristics and the users' tasks; and providing users with means of interacting with the data that effectively support their train of thought.
Our approach is based on the idea of bringing the fields of Web data management 22 and Human-computer interaction 41, 63 closer together, based on the strong belief that they have the potential to cross-fertilize one another. User interface design is essential to the management and understanding of large, heterogeneous and interlinked datasets. Interlinked datasets enriched with even a small amount of semantics have the potential to help create interfaces that let users analyze and manipulate data in a more efficient manner by providing them with, e.g., more relevant query results and giving them efficient means to navigate and relate those results. Our ultimate, long-term goal is to design interactive systems that make it as straightforward to manipulate large webs of data as spreadsheets do for tabular data.
3 Research program
3.1 Introduction
Our ability to acquire or generate, store, process, interlink and query data has increased spectacularly over the last few years. The corresponding advances are commonly grouped under the umbrella of so called Big Data. Even if the latter has become a buzzword, these advances are real, and they are having a profound impact in domains as varied as scientific research, commerce, social media, industrial processes or e-government. Yet, looking ahead, technologies related to what we now call the Web of Data (a.k.a the Semantic Web) have the potential to create an even larger revolution in data-driven activities, by making information accessible to machines as semistructured data 21 that eventually becomes actionable knowledge. Indeed, novel Web data models considerably ease the interlinking of semi-structured data originating from multiple independent sources. They make it possible to associate machine-processable semantics with the data. This in turn means that heterogeneous systems can exchange data, infer new data using reasoning engines, and that software agents can cross data sources, resolving ambiguities and conflicts between them 61. Datasets are becoming very rich and very large. They are gradually being made even larger and more heterogeneous, but also much more useful, by interlinking them, as exemplified by the Linked Data initiative 39.
These advances raise research questions and technological challenges that span numerous fields of computer science research: databases, communication networks, security and trust, data mining, as well as human-computer interaction. Our research is based on the conviction that interactive systems play a central role in many data-driven activity domains. Indeed, no matter how elaborate the data acquisition, processing and storage pipelines are, data eventually get processed or consumed one way or another by users. The latter are faced with large, increasingly interlinked heterogeneous datasets that are organized according to complex structures, resulting in overwhelming amounts of both raw data and structured information. Users thus require effective tools to make sense of their data and manipulate them.
We approach this problem from the perspective of the Human-Computer Interaction (HCI) field of research, whose goal is to study how humans interact with computers and inspire novel hardware and software designs aimed at optimizing properties such as efficiency, ease of use and learnability, in single-user or cooperative work contexts. More formally, HCI is about designing systems that lower the barrier between users' cognitive model of what they want to accomplish, and computers' understanding of this model. HCI is about the design, implementation and evaluation of computing systems that humans interact with 41, 63. It is a highly multidisciplinary field, with experts from computer science, cognitive psychology, design, engineering, ethnography, human factors and sociology.
In this broad context, ILDA aims at designing interactive systems that display 30, 47, 70 the data and let users interact with them, aiming to help users better navigate and comprehend large datasets represented visually 357, as well as relate and manipulate them.
Our research agenda consists of the three complementary axes detailed in the following subsections. Designing systems that consider interaction in close conjunction with data structure and semantics is pivotal to all three axes. This will help drive navigation in, and manipulation of, the data, so as to optimize the communication bandwidth between users and data.
3.2 Novel Forms of Display for Groups and Individuals
Participants: Caroline Appert, Anastasia Bezerianos, Olivier Chapuis, Emmanuel Pietriga, Vanessa Peña-Araya, Eugénie Brasier, Vincent Cavez, Mehdi Chakhchoukh, Raphaël James, Dylan Lebout.
Data sense-making and analysis is not limited to individual users working with a single device, but increasingly involves multiple users working together in a coordinated manner in multi-display environments: workstations, wall displays, handheld devices, mixed reality. We investigate how to empower users working with complex data by leveraging novel types of displays and combinations of displays, designing visualizations adapted to their capabilities.
The foundational question addressed here is what to display when, where and how, so as to provide effective support to users in their data understanding and manipulation tasks. ILDA targets contexts in which workers have to interact with complementary views on the same data, or with views on different-but-related datasets, possibly at different levels of abstraction. Being able to combine or switch between representations of the data at different levels of detail and merge data from multiple sources in a single representation is central to many scenarios. This is especially true in both of the application domains we consider: mission-critical systems (e.g., natural disaster crisis management) and the exploratory analysis of scientific data (e.g., correlate theories and heterogeneous observational data for an analysis of a given celestial body in Astrophysics).
A significant part of our research over the last ten years has focused on multi-scale interfaces. We designed and evaluated novel interaction techniques, but also worked actively on the development of open-source UI toolkits for multi-scale interfaces. These interfaces let users navigate large but relatively homogeneous datasets at different levels of detail, on both workstations 60, 25, 56, 55, 54, 26, 53, 24, 59 and wall-sized displays 49, 42, 58, 48, 28, 32, 31. This part of the ILDA research program is about extending multi-scale navigation in two directions: 1. Enabling the representation of multiple, spatially-registered but widely varying, multi-scale data layers in Geographical Information Systems (GIS); 2. Generalizing the multi-scale navigation paradigm to interconnected, heterogeneous datasets as found on the Web of Data.
The first research problem has been mainly investigated in collaboration with IGN in the context of ANR project MapMuxing, which stands for multi-dimensional map multiplexing, from 2014 to early 2019. Project MapMuxing aimed at going beyond the traditional pan & zoom and overview+detail interface schemes, and at designing and evaluating novel cartographic visualizations that rely on high-quality generalization, i.e., the simplification of geographic data to make it legible at a given map scale 66, 67, and symbol specification. Beyond project MapMuxing, we are also investigating multi-scale multiplexing techniques for geo-localized data in the specific context of ultra-high-resolution wall-sized displays, where the combination of a very high pixel density and large physical surface enable us to explore designs that involve collaborative interaction and physical navigation in front of the workspace.
The second research problem is about the extension of multi-scale navigation to interconnected, heterogeneous datasets. Generalization has a rather straightforward definition in the specific domain of geographical information systems, where data items are geographical entities that naturally aggregate as scale increases. But it is unclear how generalization could work for representations of the more heterogeneous webs of data that we consider in the first axis of our research program. Those data form complex networks of resources with multiple and quite varied relationships between them, that cannot rely on a single, unified type of representation (a role played by maps in GIS applications).
Relevant publications by team members this year: 13, 14, 18, 16, 20.
3.3 Novel Forms of Input for Groups and Individuals
Participants: Caroline Appert, Anastasia Bezerianos, Olivier Chapuis, Emmanuel Pietriga, Eugénie Brasier, Vincent Cavez, Emmanuel Courtoux, Raphaël James.
Analyzing and manipulating large datasets can involve multiple users working together in a coordinated manner in multi-display environments: workstations, handheld devices, wall-sized displays 28. Those users work towards a common goal, navigating and manipulating data displayed on various hardware surfaces in a coordinated manner. Group awareness 38, 36 is central in these situations, as users, who may or may not be co-located in the same room, can have an optimal individual behavior only if they have a clear picture of what their collaborators have done and are currently doing in the global context. We work on the design and implementation of interactive systems that improve group awareness in co-located situations 43, making individual users able to figure out what other users are doing without breaking the flow of their own actions.
In addition, users need a rich interaction vocabulary to handle large, structured datasets in a flexible and powerful way, regardless of the context of work. Input devices such as mice and trackpads provide a limited number of input actions, thus requiring users to switch between modes to perform different types of data manipulation and navigation actions. The action semantics of these input devices are also often too much dependent on the display output. For instance, a mouse movement and click can only be interpreted according to the graphical controller (widget) above which it is moved. We focus on designing powerful input techniques based upon technologies such as tactile surfaces (supported by UI toolkits developed in-house), 3D motion tracking systems, or custom-built controllers 46to complement (rather than replace) traditional input devices such as keyboards, that remain the best method so far for text entry, and indirect input devices such as mice or trackpads for pixel-precise pointing actions.
The input vocabularies we investigate enable users to navigate and manipulate large and structured datasets in environments that involve multiple users and displays that vary in their size, position and orientation 28, 37, each having their own characteristics and affordances: wall displays 49, 23, workstations, tabletops 51, 35, tablets 50, 68, smartphones 71, 33, 64, 65, and combinations thereof 34, 69, 48, 28.
We aim at designing rich interaction vocabularies that go far beyond what current touch interfaces offer, which rarely exceeds five gestures such as simple slides and pinches. Designing larger gesture vocabularies requires identifying discriminating dimensions (e.g., the presence or absence of anchor points and the distinction between internal and external frames of reference 50) in order to structure a space of gestures that interface designers can use as a dictionary for choosing a coherent set of controls. These dimensions should be few and simple, so as to provide users with gestures that are easy to memorize and execute. Beyond gesture complexity, the scalability of vocabularies also depends on our ability to design robust gesture recognizers that will allow users to fluidly chain simple gestures that make it possible to interlace navigation and manipulation actions.
We also study how to further extend input vocabularies by combining touch 50, 71, 51 and mid-air gestures 49 with physical objects 40, 62, 46 and classical input devices such as keyboards to enable users to input commands to the system or to involve other users in their workflow (request for help, delegation, communication of personal findings, etc.) 29, 44. Gestures and objects encode a lot of information in their shape, dynamics and direction, that can be directly interpreted in relation with the user, independently from the display output. Physical objects can also greatly improve coordination among actors for, e.g., handling priorities or assigning specific roles.
Relevant publications by team members this year: 17, 16, 14.
3.4 Interacting with Diverse Data
Participants: Emmanuel Pietriga, Caroline Appert, Anastasia Bezerianos, Vanessa Peña-Araya, Mehdi Chakhchoukh, Rim Hajri.
Research in data management is yielding novel models that enable diverse structuring and querying strategies, give machine-processable semantics to the data and ease their interlinking. This, in turn, yields datasets that can be distributed at the scale of the Web, highly-heterogeneous and thus rich but also quite complex. We investigate ways to leverage this richness from the users' perspective, designing interactive systems adapted to the specific characteristics of data models and data semantics of the considered application area.
To be successful, interaction paradigms that let users navigate and manipulate data on the Web have to be tailored to the radically different way of browsing information enabled by it, where users directly interact with the data rather than with monolithic documents. The general research question addressed in this part of our research program is how to design novel interaction techniques that help users manipulate their data more efficiently. By data manipulation, we mean all low-level tasks related to manually creating new content, modifying and cleaning existing content, merging data from different sources, establishing connections between datasets, categorizing data, and eventually sharing the end results with other users; tasks that are currently considered quite tedious because of the sheer complexity of the concepts, data models and syntax, and the interplay between all of them.
Our approach is based on the conviction that there is a strong potential for cross-fertilization, as mentioned earlier: on the one hand, user interface design is essential to the management and understanding of webs of data; on the other hand, interlinked datasets enriched with even a small amount of semantics can help create more powerful user interfaces, that provide users with the right information at the right time.
We envision systems that focus on the data themselves, exploiting the underlying semantics and structure in the background rather than exposing them – which is what current user interfaces for the Web of Data often do. We envision interactive systems in which the semantics and structure are not exposed directly to users, but serve as input to the system to generate interactive representations that convey information relevant to the task at hand and best afford the possible manipulation actions.
Relevant publications by team members this year: 13, 11, 18, 12, 15.
4 Application domains
4.1 Mission-critical Systems
Mission-critical contexts of use include emergency response & management, and critical infrastructure operations, such as public transportation systems, communications and power distribution networks, or the operations of large scientific instruments such as particle accelerators and astronomical observatories. Central to these contexts of work is the notion of situation awareness 36, i.e., how workers perceive and understand elements of the environment with respect to time and space, such as maps and geolocated data feeds from the field, and how they form mental models that help them predict future states of those elements. One of the main challenges is how to best assist subject-matter experts in constructing correct mental models and making informed decisions, often under time pressure. This can be achieved by providing them with, or helping them efficiently identify and correlate, relevant and timely information extracted from large amounts of raw data, taking into account the often cooperative nature of their work and the need for task coordination. With this application area, our goal is to investigate novel ways of interacting with computing systems that improve collaborative data analysis capabilities and decision support assistance in a mission-critical, often time-constrained, work context.
Relevant publications by team members this year: 20.
4.2 Exploratory Analysis of Scientific Data
Many scientific disciplines are increasingly data-driven, including astronomy, molecular biology, particle physics, or neuroanatomy. While making the right decision under time pressure is often less of critical issue when analyzing scientific data, at least not on the same temporal scale as truly time-critical systems, scientists are still faced with large-to-huge amounts of data. No matter their origin (experiments, remote observations, large-scale simulations), these data are difficult to understand and analyze in depth because of their sheer size and complexity. Challenges include how to help scientists freely-yet-efficiently explore their data, keep a trace of the multiple data processing paths they considered to verify their hypotheses and make it easy to backtrack, and how to relate observations made on different parts of the data and insights gained at different moments during the exploration process. With this application area, our goal is to investigate how data-centric interactive systems can improve collaborative scientific data exploration, where users' goals are more open-ended, and where roles, collaboration and coordination patterns 38 differ from those observed in mission-critical contexts of work.
5 New software and platforms
The following new software applications were developed this year. We have been actively using existing platforms WILD and WILDER (ultra-high-resolution wall-sized displays), which are going to get overhauled in the near future as part of ANR EquipEx+ project Continuum (see Section 7.2).
5.1 New software
5.1.1 HyperStoryLines
-
Keywords:
Data visualization, Hypergraphs
-
Scientific Description:
HyperStorylines is a technique that generalizes Storylines to visualize the evolution of relationships involving multiple types of entities such as, for example, people, locations, and companies. Datasets which describe such multi-entity relationships are often modeled as hypergraphs, that can be difficult to visualize, especially when these relationships evolve over time. HyperStorylines builds upon Storylines, enabling the aggregation and nesting of these dynamic, multi-entity relationships.
-
Functional Description:
A visualization tool to represent relationships among different types of entities, forming a hypergraph, and that evolve over time.
- URL:
- Publication:
-
Contact:
Vanessa Pena Araya
-
Participants:
Vanessa Pena Araya, Anastasia Bezerianos, Emmanuel Pietriga, Rim Hajri, Laurent Amsaleg
5.1.2 wildmap
-
Name:
Wall-sized Interaction with Large Map Data
-
Keyword:
Geo-visualization
-
Functional Description:
A library to enable the interactive visualization of map data on ultra-high-resolution wall-sized displays using Web-based technologies.
- URL:
-
Contact:
Emmanuel Pietriga
-
Participants:
Emmanuel Pietriga, Olivier Gladin
5.1.3 WallTokens
-
Keyword:
Tangible interface
-
Scientific Description:
angibles can enrich interaction with digital surfaces. Among others, they support eyes-free control or enhance awareness of others' actions. Tangibles have been studied in combination with horizontal surfaces such as tabletops, but not with vertical surfaces such as wall displays. The obvious obstacle is gravity as tangibles cannot be laid on the surface without falling. We present WallTokens, which are easy-to-fabricate tangibles to interact with a vertical surface. A WallToken is a plastic token whose footprint is recognized on a tactile surface. It is equipped with a push-handle that controls a suction cup. This makes it easy for users to switch between sliding or attaching it to the wall. This project is a step towards enabling tangible interaction in a wall display context.
-
Functional Description:
Tools and Software to use the WallTokens. WallTokens are easy-to-fabricate tangibles to interact with a vertical surface. A WallToken is a plastic token whose footprint is recognized on a tactile surface. It is equipped with a push-handle that controls a suction cup. This makes it easy for users to switch between sliding or attaching it to the wall. https://walltokens.lisn.upsaclay.fr/
- URL:
- Publication:
-
Contact:
Olivier Chapuis
-
Participants:
Emmanuel Courtoux, Olivier Chapuis, Caroline Appert
6 New results
Participants: Caroline Appert, Anastasia Bezerianos, Olivier Chapuis, Vanessa Peña-Araya, Emmanuel Pietriga, Eugénie Brasier, Emmanuel Courtoux.
6.1 Interacting with Novel Forms of Displays
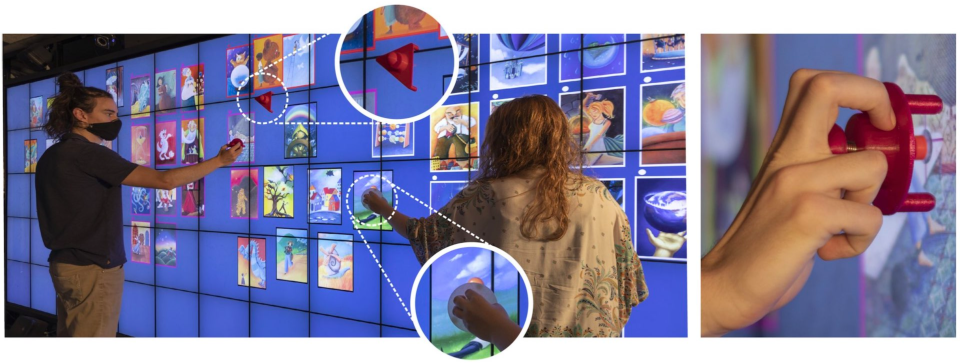
A picture of two users interacting with tangible objects in front of a wall display, including a closeup on one of those tangibles.
Following-up on recent work in the team about tangible interaction using passive tokens on multi-touch surfaces 464527, we investigated the specific case of tangible interaction on vertical displays using such passive tokens. Tangibles can enrich interaction with digital surfaces. Among others, they support eyes-free control or increase awareness of other users' actions. Tangibles have been studied in combination with horizontal surfaces such as tabletops, but not with vertical screens such as wall displays. The obvious obstacle is gravity: tangibles cannot be placed on such surfaces without falling. We developed WallTokens 2, which are easy-to-fabricate tangibles to interact with a vertical surface. A WallToken, illustrated in Figure 1, is a passive token whose footprint is recognized on a tactile surface. It is equipped with a push-handle that controls a suction cup. This makes it easy for users to switch between sliding the token or attaching it to the wall. We developed a method to build such tokens and to recognize them on a tactile surface. We ran a user study showing the benefits of WallTokens for manipulating virtual objects over multi-touch gestures.
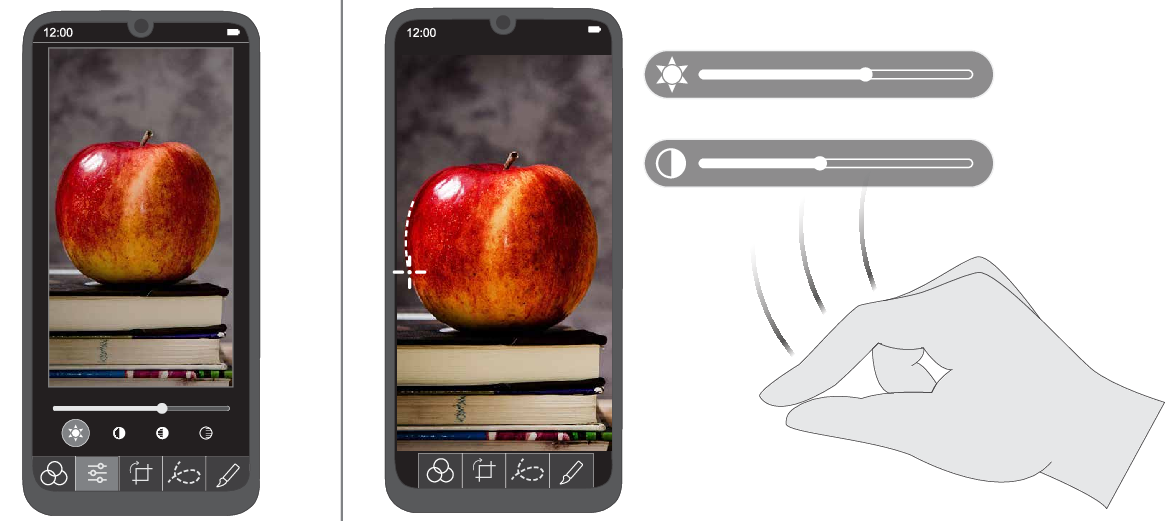
An illustration of what a minimalistic photo editor for smartphones would look like if some of its widgets could be offloaded to the air around the phone.
Augmented Reality (AR) is another novel form of display that we study in the team. Recent work in the team 1 investigated different input techniques for indirect pointing in AR. This year, we studied how AR could improve interaction with handheld devices. We performed a detailed investigation of AR-enhanced widgets for smartphones 16, where AR technology is not only used to offload widgets from the phone to the air around it, but to give users more control on input precision as well. Such widgets, as illustrated in Figure 2, have the obvious benefit of freeing up screen real-estate on the phone, but their other potential benefits remain largely theoretical. Their limitations are not well understood, most particularly in terms of input performance. We compare different AR-enhanced widget designs against their state-of-the-art touch-only counterparts with a series of exploratory studies in which participants had to perform three tasks: command trigger, parameter value adjustment, and precise 2D selection. We then derive guidelines from our empirical observations.
6.2 Interactive Visual Exploration of Complex Data
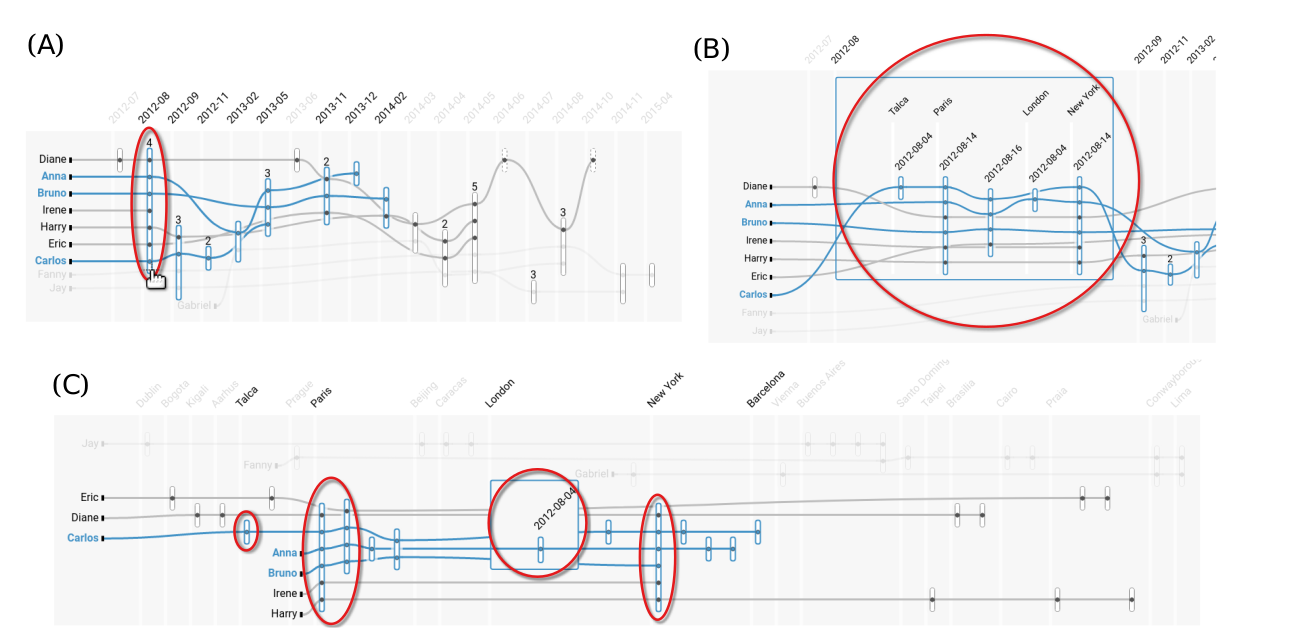
Three states of a HyperStoryLine visualization emphasizing the interactive nesting of entities.
Recent work in the team investigated different visualization techniques for the understanding of spatio-temporal, multivariate data 752, using low-level, generic data analysis tasks. We continued this line of research, this time focusing on data modeled as hypergraphs, with a strong temporal aspect and lesser emphasis on the geo-spatial aspect. We developed HyperStoryLines 13, a technique that generalizes Storylines to visualize the evolution of relationships involving multiple types of entities such as, for example, people, locations, and companies (see Figure 3). Datasets which describe such multi-entity relationships are often modeled as hypergraphs, that can be difficult to visualize, especially when these relationships evolve over time. HyperStorylines enable the aggregation and nesting of these dynamic, multi-entity relationships. The design of HyperStorylines was informed by discussions and workshops with data journalists from Ouest France – a large francophone news office – and by the results of a comparative study in which participants had to answer questions inspired by the tasks that journalists typically perform with such data.
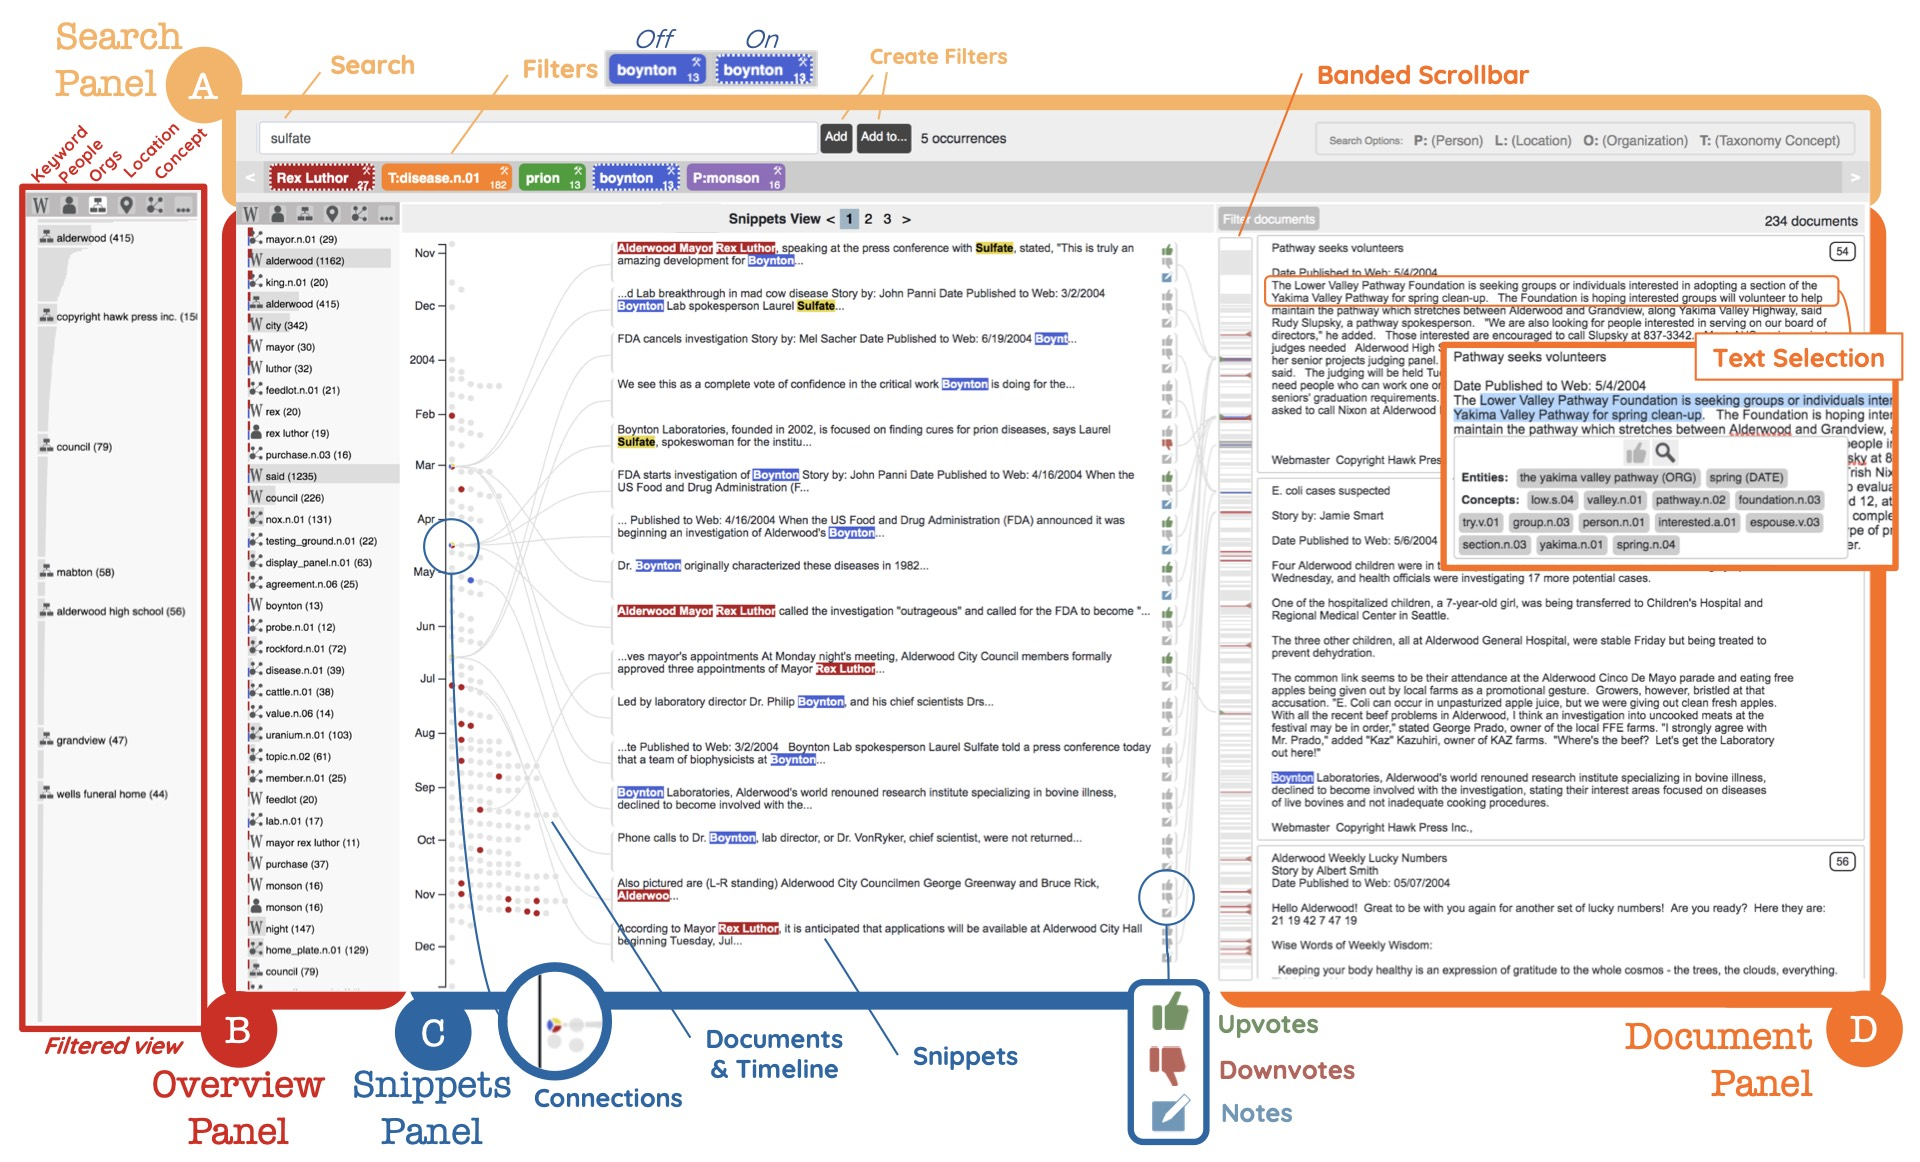
Screenshot of the Storifier text analytics tool.
Data journalism has also been the specific application area considered in a collaborative research project with the University of Toronto, this time rather involving text visualization and close reading 18. Journalistic inquiry often requires analysis and close study of large text collections around a particular topic. This practice could benefit from a more text- and reading-centered approach to journalistic text analysis, one that allows for a fluid transition between overview of entities of interest, the context of these entities in the text, down to the detailed documents they are extracted from. This project investigated the design and development of Storyfier, a text visualization tool (Figure 4) created in close collaboration with the same large francophone news office involved in the HyperStorylines project.
Together with colleagues from INRAe, we demonstrated how analytic provenance can be exploited to re-construct user trust in a guided Visual Analytics (VA) system, suggesting that interaction log data analysis can be a valuable tool for on-line trust monitoring 15. The approach explores objective trust measures that can be continuously tracked and updated during the exploration, and reflect both the confidence of the user in system suggestions, and the uncertainty of the system with regards to user goals. We argue that this approach is more suitable for guided VA systems where user strategies, goals and even trust can evolve over time, in reaction to new system feedback and insights from the exploration.
Finally, we were involved in a broad collaboration with visualization researchers from other universities in Canada and the USA. This project was about a comparative study of visualization task performance and spatial ability across disciplines 12. Problem-driven visualization work is rooted in deeply understanding the data, actors, processes, and workflows of a target domain. Data journalism (see above) being one example. However, an individual's personality traits and cognitive abilities may also influence visualization use. Diverse user needs and abilities raise natural questions for specificity in visualization design. This study bridges domain-specific perspectives on visualization design with those provided by cognition and perception. We measure variations in visualization task performance across chemistry, computer science, and education, and relate these differences to variations in spatial ability. These findings offer a fresh perspective on discipline-specific visualization with specific recommendations to help guide visualization design.
7 Partnerships and cooperations
7.1 European initiatives
7.1.1 Other european programs/initiatives
Participants: Emmanuel Pietriga, Dylan Lebout.
Deutsches Elektronen-Synchrotron (DESY): Scientific collaboration on the design and implementation of user interfaces for array operations monitoring and control for the Cherenkov Telescope Array (CTA) project, to be built in the Canary Islands (Spain) and in the Atacama desert (Chile), 5 years, contract started May 2018. Participants: Emmanuel Pietriga (PI), Dylan Lebout. www.cta-observatory.org
7.2 National initiatives
7.2.1 EquipEx+ Continuum (ANR)
Participants: Caroline Appert, Anastasia Bezerianos, Olivier Chapuis, Emmanuel Pietriga, Vanessa Peña-Araya, Eugénie Brasier, Vincent Cavez, Raphaël James.
ILDA participates to EquipEx+ project Continuum, a collaborative research infrastructure of 30 platforms located throughout France to advance interdisciplinary research based on interaction between computer science and the human and social sciences. Funded by the French National Research Agency (ANR) from 2021 to 2029. 19 academic institutions and 3 research organizations.
7.2.2 INRIA Project Lab (IPL)
Participants: Anastasia Bezerianos, Vanessa Peña-Araya, Rim Hajri, Emmanuel Pietriga.
ILDA participates to Inria Project Lab iCODA : Data Journalism : knowledge-mediated Content and Data Interactive Analytics (2017-2021). A key issue in data science is the design of algorithms that enable analysts to infer information and knowledge by exploring heterogeneous information sources, structured data, or unstructured content. With journalism data as a landmark use-case, iCODA aims to develop the scientific and technological foundation for collaborative, heterogeneous data analysis, guided by formalized, user-centric knowledge. The project relies on realistic scenarios in data-journalism to assess the contribution of the project to this area. iCODA is at the crossroads of several research areas (content analysis, data management, knowledge representation, visualization) and is part of a club of partners of the world of the press. Equipes-projets Inria : Graphik, Ilda, Linkmedia, Cedar. Press partners: Le Monde, OuestFrance, AFP. Participants: Anastasia Bezerianos (PI), Vanessa Peña-Araya, Rim Hajri, Emmanuel Pietriga. See Section 6.2.
8 Dissemination
Participants: Caroline Appert, Anastasia Bezerianos, Olivier Chapuis, Vanessa Peña-Araya, Emmanuel Pietriga, Eugénie Brasier, Emmanuel Courtoux, Raphaël James.
8.1 Promoting scientific activities
8.1.1 Scientific events: organisation
General chair, scientific chair
- ACM CHI 2022, 40th ACM SIGCHI Conference on Human Factors in Computing Systems: Caroline Appert (TPC - Technical Program Chair)
Member of the organizing committees
- ACM CHI Steering Committee (2019-...), ACM SIGCHI Conference on Human Factors in Computing Systems: Caroline Appert
- IEEE VIS Executive Committee (2021-...), Visualization Conference: Anastasia Bezerianos
- BELIV workshop series, organizer (2021): Anastasia Bezerianos
- IEEE VIS tutorial organizer (How to be a better PC member): Anastasia Bezerianos
- ACM MobileHCI 2021, Conference on Mobile Human-Computer Interaction: Eugénie Brasier (student volunteer chair)
- ACM CHI 2022, 40th ACM SIGCHI Conference on Human Factors in Computing Systems: Vanessa Peña-Araya, Emmanuel Pietriga (data chairs)
8.1.2 Scientific events: selection
Chair of conference program committees
- ACM CHI 2021, 39th ACM SIGCHI Conference on Human Factors in Computing Systems: Caroline Appert (SC - subcommittee chair)
- IEEE VIS 2021, Visualization Conference: Anastasia Bezerianos (Area Paper Chair)
Member of the conference program committees
- ACM CHI 2021, 39th ACM SIGCHI Conference on Human Factors in Computing Systems: Emmanuel Pietriga (AC - Associate Chair)
- IEEE VIS 2021, Visualization Conference: Emmanuel Pietriga (AC - Associate Chair)
- IEEE VIS 2021, Visualization Conference: Vanessa Peña-Araya (short papers)
- ACM MobileHCI 2021, Conference on Mobile Human-Computer Interaction: Olivier Chapuis (AC - Associate Chair)
Reviewer
- ACM CHI 2022, Conference on Human Factors in Computing Systems: Anastasia Bezerianos, Olivier Chapuis, Vanessa Peña-Araya, Emmanuel Pietriga
- IEEE VIS 2021, Visualization Conference: Caroline Appert, Vanessa Peña-Araya
- IEEE/ACM ISMAR 2021, International Symposium on Mixed and Augmented Reality: Emmanuel Pietriga
- ACM MobileHCI 2021, International Conference on Mobile Human-Computer Interaction: Anastasia Bezerianos
- IEEE PacificVis 2022, Pacific Visualization Symposium: Vanessa Peña-Araya
- IEEE VR 2022, Conference on Virtual Reality and 3D User Interfaces: Olivier Chapuis
- ACM CHI 2022, Conference on Human Factors in Computing Systems, Late-breaking Work: Raphaël James
- IHM 2020-21, conférence francophone d'Interaction Humain Machine: Eugénie Brasier
8.1.3 Journal
Member of the editorial boards
- ACM ToCHI, Transactions on Computer-Human Interaction: Caroline Appert (associate editor)
Reviewer - reviewing activities
- ACM ToCHI, Transactions on Computer-Human Interaction: Olivier Chapuis, Emmanuel Pietriga
- IEEE TVCG, Transactions on Visualization and Computer graphics: Anastasia Bezerianos, Vanessa Peña-Araya, Emmanuel Pietriga
8.1.4 Leadership within the scientific community
- Conseil Scientifique d'Institut (CNRS/INS2I): Caroline Appert
8.1.5 Research administration
- Responsable du Département Interaction avec l'Humain (IaH) du LISN (UMR9015): Olivier Chapuis
- Member of Conseil de l'École Doctorale STIC Paris Saclay: Caroline Appert
- Member of pôle B de l'École Doctorale STIC Paris Saclay: Caroline Appert
- Member of Conseil de Laboratoire (LISN): Caroline Appert
- Responsable Mobilité Internationale, Comp. Sci. department, Université Paris-Saclay: Anastasia Bezerianos
- Member of Commissions Consultatives de Spécialités d’Université (CCSU) at Université Paris Saclay: Anastasia Bezerianos
8.2 Teaching - Supervision - Juries
- Ingénieur (X-3A)/Master (M1/M2): Emmanuel Pietriga, Data Visualization (INF552), 36h, École Polytechnique / Institut Polytechnique de Paris
- Ingénieur (X-3A)/Master (M1/M2): Caroline Appert, Data Visualization (INF552), 18h, École Polytechnique / Institut Polytechnique de Paris
- Master (M1/M2): Caroline Appert, Experimental Design and Analysis, 22h, Université Paris Saclay
- Master (M2): Emmanuel Pietriga, Data Visualization, 24h, Université Paris Dauphine
- Master (M2): Anastasia Bezerianos, Career Seminar, 21h, Univ. Paris Saclay
- Master (M1/M2): Anastasia Bezerianos, Interactive Information Visualization, 10.5h, Univ. Paris Saclay
- Master (M1/M2): Anastasia Bezerianos, Mixed Reality and Tangible Interaction, 12h, Univ. Paris Saclay
- Master (M1/M2): Anastasia Bezerianos, Groupware and Collaborative Interaction, 8h, Univ. Paris Saclay
- Master (M2): Eugénie Brasier, Winter school, 11h, Univ. Paris Saclay
- Master (M1): Anastasia Bezerianos, Programming of Interactive Systems (M1 HCI/HCID), 21h, Univ. Paris Saclay
- Master (M1): Anastasia Bezerianos, Evaluation of Interactive Systems (M1 HCI/HCID), 12h, Univ. Paris Saclay
- Master (M1): Anastasia Bezerianos, Design Project (M1 HCI/HCID), 21h, Univ. Paris Saclay
- Master (M1): Raphaël James, Fundamentals of HCI, 22h, Université Paris Saclay
- Master (M1): Raphaël James, Programming of Interactive Systems, 10h, Université Paris Saclay
- Master (M1): Eugénie Brasier, Career Seminar project, 11h, Univ. Paris Saclay
- Ingénieur (Et3): Eugénie Brasier, Concepts Objet et Java, 24h, Polytech Paris-Saclay
- Ingénieur (Et3): Eugénie Brasier, Interaction Humain-Machine, 12h, Polytech Paris-Saclay
- License (L3/IUT): Anastasia Bezerianos, Programmation Android IUT, 31h, Université Paris Saclay
- License (L3): Raphaël James, Algorithmique Générale, 24h, Université Paris Saclay
- License (L2): Raphaël James, Introduction à l'Interaction Humain-Machine, 12h, Université Paris Saclay
8.2.1 Supervision
- PhD (defended): Eugénie Brasier, Interaction techniques for remote manipulation in multi-display environments, October 2018 - December 2021, Advisor: Caroline Appert
- PhD in progress: Raphaël James, Environnements de réalité physique et augmentée utilisés dans l'analyse visuelle collaborative, since October 2018, Advisors: Anastasia Bezerianos, Olivier Chapuis
- PhD in progress: Emmanuel Courtoux, Tangible Collaborative Interaction for Wall-sized Displays, since October 2019, Advisors: Olivier Chapuis, Caroline Appert
- PhD in progress : Mehdi Chakhchoukh, CHORALE: Collaborative Human-Model Interaction to Support Multi-Criteria Decision Making in Agronomy, since October 2020, Advisors: Anastasia Bezerianos, Nadia Boukhelifa
- PhD in progress : Lijie Yao, Situated/embedded visualizations in motion and mobile visualizations, since October 2020, Advisors: Petra Isenberg (EPC Aviz), Anastasia Bezerianos
- PhD in progress : Vincent Cavez, Post-WIMP Data Wrangling, since October 2021, Advisors: Emmanuel Pietriga, Caroline Appert
- M2 internship: Francesco di Gioia, AR-enhanced annotations on mobile devices, 6 months. Advisors: Caroline Appert, Eugénie Brasier.
- M2 internship: Juliette Fournis d'Albiat, Synchronizing DOM trees on cluster-driven wall displays, 6 months. Advisors: Olivier Chapuis, Emmanuel Pietriga.
- M2 internship: Golina Hulstein, Integrating thematic Maps into Storyline Visualizations, 6 months. Advisors: Anastasia Bezerianos, Vanessa Peña-Araya.
- X-3A/M1 internship: Théo Imbert. Advisors: Caroline Appert, Emmanuel Pietriga.
- M1 internship: Camille Dupré. PhotoVR: Tri de Photos Collaboratif en Réalité Virtuelle. Advisor: Olivier Chapuis.
- M1 internship: Julia Biesiada. Visualization techniques to communicate estimates in progressive time series queries. Advisors: Theophanis Tsandilas (EPC Ex-Situ), Anastasia Bezerianos.
8.2.2 Juries
- PhD: Rajkumar Darbar, Université de Bordeaux: Caroline Appert (présidente)
- PhD: Ludovic Gardy, Université de Toulouse: Anastasia Bezerianos (rapporteur)
- PhD: Jiali Liu, Telecom Paris: Anastasia Bezerianos (examinatrice)
- PhD: Mickaël Serano, Université Paris-Saclay: Caroline Appert (présidente)
- PhD: Matthieu Viry, Université Grenoble-Alpes: Emmanuel Pietriga (rapporteur)
- PhD: Marc Baloup, Université de Lille: Olivier Chapuis (examiner)
8.3 Popularization
8.3.1 Articles and contents
Olivier Chapuis, Sur l'utilisation de murs d'écrans interactifs en gestion de crise, chapitre de Vers le cyber-monde : Humain et numerique en interaction. Bouzeghoub M., Daafouz J. & Jutten C., CNRS Ed., 2021. 20
9 Scientific production
9.1 Major publications
- 1 inproceedingsARPads: Mid-air Indirect Input for Augmented Reality.ISMAR 2020 - IEEE International Symposium on Mixed and Augmented RealityISMAR '20Porto de Galinhas, BrazilIEEENovember 2020, 13 pages
- 2 inproceedingsWallTokens: Surface Tangibles for Vertical Displays.Proceedings of the international conference on Human factors in computing systemsCHI 2021 - International conference on Human factors in computing systemsCHI '21Yokoama / Virtual, JapanACMMay 2021, 13 pages
- 3 articleS-Paths: Set-based visual exploration of linked data driven by semantic paths.Open Journal Of Semantic WebSeptember 2020, 1-18
- 4 articleComparing Similarity Perception in Time Series Visualizations.IEEE Transactions on Visualization and Computer GraphicsOctober 2018, 11
- 5 articleAnimation Plans for Before-and-After Satellite Images.IEEE Transactions on Visualization and Computer Graphics24January 2018
- 6 articleHyperStorylines: Interactively untangling dynamic hypergraphs.Information VisualizationSeptember 2021, 1-21
- 7 articleA Comparison of Visualizations for Identifying Correlation over Space and Time.IEEE Transactions on Visualization and Computer GraphicsOctober 2019
- 8 articleExpressive Authoring of Node-Link Diagrams with Graphies.IEEE Transactions on Visualization and Computer Graphics274April 2021, 2329-2340
- 9 inproceedingsSpaceInk: Making Space for In-Context Annotations.UIST 2019 - 32nd ACM User Interface Software and TechnologyNouvelle-Orleans, United StatesOctober 2019
- 10 inproceedingsDesigning Coherent Gesture Sets for Multi-scale Navigation on Tabletops.Proceedings of the 36th international conference on Human factors in computing systemsCHI '18Montreal, CanadaACMApril 2018, 142:1-142:12
9.2 Publications of the year
International journals
International peer-reviewed conferences
Reports & preprints
9.3 Cited publications
- 21 bookData on the Web: From Relations to Semistructured Data and XML.Morgan Kaufmann1999
- 22 inproceedingsThe ERC Webdam on Foundations of Web Data Management.Proc. of the 21st International Conference Companion on World Wide WebWWW '12 CompanionACM2012, 211--214URL: http://doi.acm.org/10.1145/2187980.2188011
- 23 inproceedingsLooking behind bezels: french windows for wall displays.Proceedings of the International Working Conference on Advanced Visual InterfacesAVI '12Capri Island, ItalyACM2012, 124--131URL: http://doi.acm.org/10.1145/2254556.2254581
- 24 inproceedingsRouteLens: Easy Route Following for Map Applications.Proceedings of the International Working Conference on Advanced Visual InterfacesAVI '14ACM2014, 125--128
- 25 inproceedingsHigh-precision magnification lenses.Proceedings of the 28th international conference on Human factors in computing systemsCHI '10Atlanta, Georgia, USAACM2010, 273--282
- 26 inproceedingsOrthoZoom Scroller: 1D Multi-scale Navigation.Proceedings of the SIGCHI Conference on Human Factors in Computing SystemsCHI '06New York, NY, USAMontréal, Québec, CanadaACM2006, 21--30URL: http://doi.acm.org/10.1145/1124772.1124776
- 27 inproceedingsCustom-made Tangible Interfaces with TouchTokens.International Working Conference on Advanced Visual Interfaces (AVI '18)Proceedings of the 2018 International Conference on Advanced Visual InterfacesGrosseto, ItalyACMMay 2018, 15
- 28 articleMultisurface Interaction in the WILD Room.IEEE Computer4542012, 48-56
- 29 inproceedingsThe coordinative functions of flight strips: air traffic control work revisited.Proceedings of the international ACM SIGGROUP conference on Supporting group workGROUP '99Phoenix, Arizona, United StatesACM1999, 101--110URL: http://doi.acm.org/10.1145/320297.320308
- 30 bookSemiology of Graphics.University of Wisconsin Press1983
- 31 articleView and Space Management on Large Displays.IEEE Computer Graphics and Applications2542005, 34-43
- 32 inproceedingsUsing alternative views for layout, comparison and context switching tasks in wall displays.OZCHI2007, 303-310
- 33 inproceedingsExtending the Vocabulary of Touch Events with ThumbRock.Proceedings of Graphics InterfaceGI '13Regina, Saskatchewan, CanadaCIPS2013, 221-228
- 34 inproceedingsSmarties: An Input System for Wall Display Development.CHI '14Toronto, CanadaACMApril 2014, 2763-2772
- 35 inproceedingsUnderstanding File Access Mechanisms for Embedded Ubicomp Collaboration Interfaces.Proceedings of the 11th International Conference on Ubiquitous ComputingUbiComp '09New York, NY, USAOrlando, Florida, USAACM2009, 135--144URL: http://doi.acm.org/10.1145/1620545.1620567
- 36 bookM. R.M. R. EndsleyD. G.D. G. JonesDesigning for Situation Awareness: an Approach to User-Centered Design.370 pagesCRC Press, Taylor & Francis2012
- 37 inproceedingsMulti-user, Multi-display Interaction with a Single-user, Single-display Geospatial Application.Proceedings of the 19th Annual ACM Symposium on User Interface Software and TechnologyUIST '06Montreux, SwitzerlandACM2006, 273--276URL: http://doi.acm.org/10.1145/1166253.1166296
- 38 articleComputer-Supported Cooperative Work: History and Focus.IEEE Computer275May 1994, 19--26URL: http://dx.doi.org/10.1109/2.291294
- 39 bookLinked Data: Evolving the Web into a Global Data Space.Morgan & Claypool2011
- 40 inproceedingsTangible Bits: Towards Seamless Interfaces Between People, Bits and Atoms.Proceedings of the ACM SIGCHI Conference on Human Factors in Computing SystemsCHI '97Atlanta, Georgia, USAACM1997, 234--241URL: http://doi.acm.org/10.1145/258549.258715
- 41 bookHuman-Computer Interaction Handbook: Fundamentals, Evolving Technologies, and Emerging Applications, 3rd Edition.CRC Press2012
- 42 inproceedingsEffects of Display Size and Navigation Type on a Classification Task.Proceedings of the 32nd international conference on Human factors in computing systemsCHI '14Toronto, CAACM2014, 4147-4156
- 43 inproceedingsShared Interaction on a Wall-Sized Display in a Data Manipulation Task.Proceedings of the 34th international conference on Human factors in computing systemsCHI '16SigCHI and ACMSan Jose, United StatesMay 2016, 1-12
- 44 articleIs paper safer? The role of paper flight strips in air traffic control.ACM Trans. Comput.-Hum. Interact.64December 1999, 311--340URL: http://doi.acm.org/10.1145/331490.331491
- 45 inproceedingsPassive yet Expressive TouchTokens.Proceedings of the 35th SIGCHI conference on Human Factors in computing systemsDenver, United StatesMay 2017, 3741 - 3745
- 46 inproceedingsTouchTokens: Guiding Touch Patterns with Passive Tokens.Proceedings of the 2016 CHI Conference on Human Factors in Computing SystemsCHI '16San Jose, CA, United StatesACMMay 2016, 4189-4202
- 47 bookVisualization Analysis and Design.CRC Press2014
- 48 inproceedingsHigh-precision pointing on large wall displays using small handheld devices.Proceedings of the SIGCHI Conference on Human Factors in Computing SystemsCHI '13Paris, FranceACM2013, 831--840URL: http://doi.acm.org/10.1145/2470654.2470773
- 49 articleMid-air Pointing on Ultra-Walls.ACM Transactions on Computer-Human Interaction225August 2015, 21:1--21:62
- 50 inproceedingsMulti-Touch Gestures for Discrete and Continuous Control.International Working Conference on Advanced Visual Interfaces (AVI)Como, ItalyMay 2014, 8
- 51 inproceedingsProspective Motor Control on Tabletops: Planning Grasp for Multitouch Interaction.Proceedings of the 32nd international conference on Human factors in computing systemsCHI '14Toronto, CAACM2014, 2893-2902
- 52 inproceedingsA Comparison of Geographical Propagation Visualizations.CHI '20 - 38th SIGCHI conference on Human Factors in computing systemsHonolulu, United StatesApril 2020, 223:1--223:14
- 53 inproceedingsA Toolkit for Addressing HCI Issues in Visual Language Environments.IEEE Symposium on Visual Languages and Human-Centric Computing (VL/HCC)IEEE Computer Society2005, 145-152
- 54 inproceedingsPointing and beyond: an operationalization and preliminary evaluation of multi-scale searching.CHI '07: Proceedings of the SIGCHI conference on Human factors in computing systemsSan Jose, California, USAACM Press2007, 1215--1224
- 55 inproceedingsSigma lenses: focus-context transitions combining space, time and translucence.CHI '08: Proceeding of the twenty-sixth annual CHI conference on Human factors in computing systemsFlorence, ItalyACM2008, 1343--1352
- 56 articleRepresentation-Independent In-Place Magnification with Sigma Lenses.IEEE Transactions on Visualization and Computer Graphics (TVCG)16032010, 455-467
- 57 inproceedingsBrowsing Linked Data Catalogs with LODAtlas.ISWC 2018 - 17th International Semantic Web ConferenceMonterey, United StatesSpringerOctober 2018, 137-153
- 58 inproceedingsRapid development of user interfaces on cluster-driven wall displays with jBricks.Proceedings of the 3rd ACM SIGCHI symposium on Engineering interactive computing systemsEICS '11Pisa, ItalyACM2011, 185--190URL: http://doi.acm.org/10.1145/1996461.1996518
- 59 inproceedingsDrilling into complex 3D models with gimlenses.Proceedings of the 19th ACM Symposium on Virtual Reality Software and TechnologyVRST '13SingaporeACM2013, 223--230URL: http://doi.acm.org/10.1145/2503713.2503714
- 60 inproceedingsJellyLens: Content-Aware Adaptive Lenses.UIST - 25th Symposium on User Interface Software and Technology - 2012Proceedings of the 25th Symposium on User Interface Software and TechnologyACMCambridge, MA, United StatesACMOctober 2012, 261-270
- 61 articleThe Semantic Web Revisited.IEEE Intelligent Systems2132006, 96-101URL: http://doi.ieeecomputersociety.org/10.1109/MIS.2006.62
- 62 articleTangible User Interfaces: Past, Present, and Future Directions.Found. Trends Hum.-Comput. Interact.31–2January 2010, 1--137URL: http://dx.doi.org/10.1561/1100000026
- 63 bookDesigning the User Interface, 4th Edition.Pearson Addison Wesley2005
- 64 inproceedingsControlling widgets with one power-up button.Proceedings of the 26th annual ACM symposium on User interface software and technologyUIST '13St. Andrews, Scotland, United KingdomACM2013, 71--74URL: http://doi.acm.org/10.1145/2501988.2502025
- 65 inproceedingsSide pressure for bidirectional navigation on small devices.Proceedings of the 15th international conference on Human-computer interaction with mobile devices and servicesMobileHCI '13Munich, GermanyACM2013, 11--20URL: http://doi.acm.org/10.1145/2493190.2493199
- 66 articleScaleMaster 2.0: a ScaleMaster extension to monitor automatic multi-scales generalizations.Cartography and Geographic Information Science4032013, 192--200URL: http://dx.doi.org/10.1080/15230406.2013.809233
- 67 inproceedingsSocial Welfare to Assess the Global Legibility of a Generalized Map.International Conference on Geographic InformationSpringer2012, 198--211URL: http://dx.doi.org/10.1007/978-3-642-33024-7_15
- 68 inproceedingsCoordination of Tilt and Touch in One- and Two-Handed Use.Proceedings of the 32nd international conference on Human factors in computing systemsCHI '14Toronto, CAACM2014, 2001-2004
- 69 inproceedingsSketchSliders: Sketching Widgets for Visual Exploration on Wall Displays.Proceedings of the 33rd Annual ACM Conference on Human Factors in Computing SystemsACMSeoul, South KoreaApril 2015, 3255-3264
- 70 bookInformation visualization: perception for design.Elsevier2012
- 71 articleFoundational Issues in Touch-Screen Stroke Gesture Design - An Integrative Review.Foundations and Trends in Human-Computer Interaction52December 2012, 97-205